Races in Kingsgate, Washington (WA) Detailed Stats
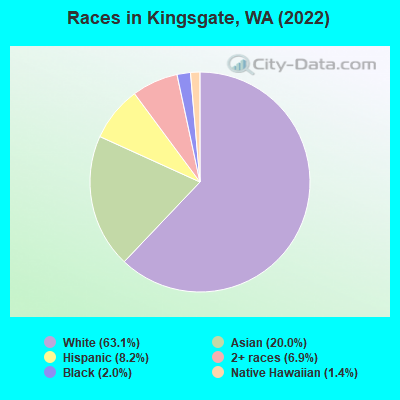
According to 2022 data, the most numerous races in Kingsgate, WA are White alone (10,257 residents), Hispanic (1,338 residents), and Asian alone (3,257 residents). 70.9% of Kingsgate residents speak English at home. 17.9% of Kingsgate, WA residents are foreign-born (10.0% born in Asia, 4.0% born in Europe, 3.1% born in Latin America), which is 16.4% greater than the foreign-born rate of 15.0% across the entire state of Washington.
Race distribution in Kingsgate
2000 2022
4,652,490 78.9% White alone 441,509 7.5% Hispanic 319,401 5.4% Asian alone 184,631 3.1% Black alone 175,926 3.0% Two or more races 85,396 1.4% American Indian alone 22,779 0.4% Native Hawaiian and Other 11,989 0.2% Other race alone
4,941,456 63.5% White alone 1,093,313 14.0% Hispanic 755,832 9.7% Asian alone 523,448 6.7% Two or more races 299,537 3.8% Black alone 69,024 0.9% American Indian alone 52,231 0.7% Native Hawaiian and Other 50,945 0.7% Other race alone
Income and house value in Kingsgate Median household income in 2022 $116,466 White non-Hispanic householders$199,295 Black householders$24,399 American Indian and Alaska Native householders$166,781 Asian householders$116,482 Native Hawaiian and other Pacific Islander householders$45,804 Some other race householders$159,620 Two or more races householders$60,905 Hispanic or Latino race householdersMedian 2022 house value $901,425 White Non-Hispanic householders$714,056 Black or African American householders $952,075 Asian householdersover $1,000,000 Native Hawaiian and other Pacific Islander householders$247,539 Some other race householders$875,148 Two or more races householders$853,440 Hispanic or Latino householders
Median age by race in Kingsgate
41.9 Median age for White residents39.2 45.3 39.4 Median age for Black or African American residents48.7 18.2 23.1 Median age for American Indian / Alaska Native residents38.0 Median age for Asian residents38.3 37.2 32.3 Median age for Native Hawaiian / Pacific Islander residents30.0 33.3 37.1 Median age for Other race residents38.7 17.0 34.5 Median age for Two or more races residents34.6 40.0 43.1 Median age for White alone residents39.7 45.8 34.0 Median age for Hispanic or Latino residents34.8 33.8
Owner/renter occupied households by race in Kingsgate
House owners and renters - White residents 3,606 79.5% Owner occupied929 20.5% Renter occupiedHouse owners and renters - Black or African American residents 62 100.0% Owner occupiedHouse owners and renters - American Indian / Alaska Native residents 8 100.0% Owner occupiedHouse owners and renters - Asian residents 794 69.6% Owner occupied347 30.4% Renter occupiedHouse owners and renters - Native Hawaiian / Pacific Islander residents 39 100.0% Owner occupiedHouse owners and renters - Other race residents 11 8.4% Owner occupied123 91.6% Renter occupiedHouse owners and renters - Two or more races residents 387 66.6% Owner occupied194 33.4% Renter occupiedHouse owners and renters - White alone residents 3,506 79.1% Owner occupied925 20.9% Renter occupiedHouse owners and renters - Hispanic or Latino residents 193 57.5% Owner occupied143 42.5% Renter occupied
Language usage in Kingsgate
English speakers - Total 70.9% of residents of Kingsgate speak English at home.
7.2% of residents speak Spanish at home 777 69.5% Speak English very well341 30.5% Speak English less than very well23.7% of residents speak other language at home 2,248 61.2% Speak English very well1,427 38.8% Speak English less than very well
English speakers - Born in the United States 90.6% of residents of Kingsgate speak English at home.
3.9% of residents speak Spanish at home 170 81.7% Speak English very well38 18.3% Speak English less than very well5.6% of residents speak other language at home 277 92.3% Speak English very well23 7.7% Speak English less than very well
English speakers - Native, born elsewhere 72.3% of residents of Kingsgate speak English at home.
25.1% of residents speak Spanish at home 65 68.4% Speak English very well30 31.6% Speak English less than very well5.5% of residents speak other language at home 21 100.0% Speak English very well
English speakers - Foreign-born 15.4% of residents of Kingsgate speak English at home.
14.0% of residents speak Spanish at home 271 49.0% Speak English very well282 51.0% Speak English less than very well74.1% of residents speak other language at home 1,650 56.2% Speak English very well1,286 43.8% Speak English less than very well
White (Caucasian) - Speak only English Native:
94.6% (8,450)Foreign-born:
29.4% (331)
White (Caucasian) - Speak another language Native:
5.2% (466)Foreign-born:
70.2% (792)
Asian - Speak only English Native:
48.7% (477)Foreign-born:
9.1% (196)
Asian - Speak another language Native:
49.7% (487)Foreign-born:
90.4% (1,943)
Other race - Speak another language Native:
85.0% (234)Foreign-born:
99.2% (329)
Two or more races - Speak only English Native:
89.3% (1,076)Foreign-born:
25.3% (59)
White alone - Speak only English Native:
95.4% (8,325)Foreign-born:
28.5% (346)
White alone - Speak another language Native:
4.4% (388)Foreign-born:
73.4% (890)
Hispanic or Latino - Speak another language Native:
64.5% (407)Foreign-born:
100.0% (522)
Foreign-born residents in Kingsgate 2,915 residents are foreign born (10.0% Asia , 4.0% Europe , 3.1% Latin America ).
This city:
17.9%Washington:
100.0%
Marital status for residents in Kingsgate Marital status - White (Caucasian) population 15 years and over
Males 34.4% Never married53.4% Now married2.2% Separated0.5% Widowed9.4% DivorcedFemales 25.9% Never married49.2% Now married0.8% Separated5.2% Widowed18.9% DivorcedWomen who gave birth in the past 12 months Now married:
81.5% (145)Unmarried:
18.5% (33)
Women who did not give birth in the past 12 months Now married:
46.2% (1,065)Unmarried:
53.8% (1,242)
Marital status - Black or African American population 15 years and over
Males 44.2% Never married49.0% Now married0.0% Separated6.8% Widowed0.0% DivorcedFemales 22.2% Never married30.6% Now married0.0% Separated47.2% Widowed0.0% DivorcedWomen who did not give birth in the past 12 months Now married:
57.9% (14)Unmarried:
42.1% (10)
Marital status - Asian population 15 years and over
Males 34.0% Never married60.7% Now married1.2% Separated0.1% Widowed4.0% DivorcedFemales 24.0% Never married56.3% Now married1.8% Separated3.0% Widowed14.9% DivorcedWomen who gave birth in the past 12 months Now married:
100.0% (23)Unmarried:
0.0% (0)
Women who did not give birth in the past 12 months Now married:
45.6% (436)Unmarried:
54.4% (520)
Marital status - Native Hawaiian / Pacific Islander population 15 years and over
Males 42.9% Never married57.1% Now married0.0% Separated0.0% Widowed0.0% DivorcedFemales 55.8% Never married44.2% Now married0.0% Separated0.0% Widowed0.0% DivorcedWomen who did not give birth in the past 12 months Now married:
22.1% (21)Unmarried:
77.9% (76)
Marital status - Other race population 15 years and over
Males 7.8% Never married92.2% Now married0.0% Separated0.0% Widowed0.0% DivorcedFemales 0.0% Never married83.9% Now married0.0% Separated5.4% Widowed10.7% DivorcedWomen who gave birth in the past 12 months Now married:
100.0% (20)Unmarried:
0.0% (0)
Women who did not give birth in the past 12 months Now married:
100.0% (155)Unmarried:
0.0% (0)
Marital status - Two or more races population 15 years and over
Males 31.5% Never married33.3% Now married11.9% Separated0.0% Widowed23.2% DivorcedFemales 14.4% Never married85.6% Now married0.0% Separated0.0% Widowed0.0% DivorcedWomen who did not give birth in the past 12 months Now married:
78.6% (245)Unmarried:
21.4% (67)
Marital status - White alone, not Hispanic / Latino population 15 years and over
Males 33.6% Never married53.7% Now married2.3% Separated0.6% Widowed9.8% DivorcedFemales 26.2% Never married48.5% Now married0.8% Separated5.3% Widowed19.1% DivorcedWomen who gave birth in the past 12 months Now married:
77.7% (116)Unmarried:
22.3% (33)
Women who did not give birth in the past 12 months Now married:
45.7% (1,034)Unmarried:
54.3% (1,229)
Marital status - Hispanic or Latino population 15 years and over
Males 37.0% Never married63.0% Now married0.0% Separated0.0% Widowed0.0% DivorcedFemales 7.7% Never married78.9% Now married0.0% Separated2.8% Widowed10.5% DivorcedWomen who gave birth in the past 12 months Now married:
100.0% (68)Unmarried:
0.0% (0)
Women who did not give birth in the past 12 months Now married:
87.9% (236)Unmarried:
12.1% (32)
Ancestries in Kingsgate
567 7.2% English535 6.8% European459 5.8% German299 3.8% Irish274 3.5% American240 3.0% Norwegian234 3.0% Iranian202 2.5% Eastern European133 1.7% Romanian117 1.5% French114 1.4% Italian98 1.2% Brazilian96 1.2% British79 1.0% Ukrainian76 1.0% Bulgarian69 0.9% Polish68 0.9% Swedish61 0.8% Russian53 0.7% Dutch44 0.6% Czech40 0.5% Israeli34 0.4% Lithuanian30 0.4% Croatian29 0.4% Portuguese29 0.4% Scottish26 0.3% Swiss25 0.3% Danish24 0.3% French Canadian18 0.2% Czechoslovakian18 0.2% Scandinavian17 0.2% Basque17 0.2% Canadian15 0.2% Welsh14 0.2% Scotch-Irish12 0.2% Yugoslavian12 0.2% Australian9 0.1% Northern European9 0.1% Hungarian8 0.1% Finnish8 0.1% Austrian6 0.08% Icelander
Geographical mobility in Kingsgate Same house 1 year ago 9,024 86.6% White (Caucasian)308 92.4% Black or African American9 97.7% American Indian / Alaska Native2,911 89.7% Asian257 100.0% Native Hawaiian / Pacific Islander661 97.9% Other race1,412 88.6% Two or more races8,801 86.8% White alone, not Hispanic / Latino1,197 90.9% Hispanic or LatinoMoved within same county 847 8.1% White / Caucasian35 10.4% Black or African American116 3.6% Asian15 2.3% Other race128 8.1% Two or more races798 7.9% White alone, not Hispanic / Latino104 7.9% Hispanic or LatinoMoved within same state 216 2.1% White / Caucasian76 2.3% Asian219 2.2% White alone, not Hispanic / LatinoMoved from different state 164 1.6% White / Caucasian27 0.8% Asian11 1.6% Other race78 4.9% Two or more races159 1.6% White alone, not Hispanic / Latino16 1.2% Hispanic or LatinoMoved from abroad 113 1.1% White53 1.6% Asian117 1.2% White alone, not Hispanic / Latino
Children Nativity (place of birth) in Kingsgate
Children under 6 years - Living with two parents Both parents native 355 100.0% NativeBoth parents foreign-born 303 100.0% NativeOne native, one foreign-born parent 154 100.0% NativeChildren under 6 years - Living with one parent Native parent 91 100.0% NativeForeign-born parent 91 98.1% Native2 1.9% Foreign-bornChildren 6 to 17 years - Living with two parents Both parents native 748 100.0% NativeBoth parents foreign-born 523 86.9% Native79 13.1% Foreign-bornOne native, one foreign-born parent 355 100.0% NativeChildren 6 to 17 years - Living with one parent Native parent 166 100.0% NativeForeign-born parent 321 68.2% Native150 31.8% Foreign-born
Grandparents responsible for own grandchildren in Kingsgate
Grandparents (30 to 59 years) White / Caucasian 7 31.4% Responsible for grandchildren16 68.6% Not responsible for grandchildrenAsian 15 100.0% Responsible for grandchildrenOther race 23 100.0% Not responsible for grandchildrenWhite alone, not Hispanic / Latino 6 22.6% Responsible for grandchildren20 77.4% Not responsible for grandchildrenHispanic or Latino 22 100.0% Not responsible for grandchildrenGrandparents (60 years and over) White / Caucasian 89 28.9% Responsible for grandchildren219 71.1% Not responsible for grandchildrenAsian 28 27.7% Responsible for grandchildren73 72.3% Not responsible for grandchildrenOther race 14 100.0% Not responsible for grandchildrenWhite alone, not Hispanic / Latino 97 28.4% Responsible for grandchildren245 71.6% Not responsible for grandchildrenHispanic or Latino 16 100.0% Not responsible for grandchildren