Races in Kennesaw, Georgia (GA) Detailed Stats
Data:
Races - White alone (%)
Races - White alone (% change since 2000)
Races - Black alone (%)
Races - Black alone (% change since 2000)
Races - American Indian alone (%)
Races - American Indian alone (% change since 2000)
Races - Asian alone (%)
Races - Asian alone (% change since 2000)
Races - Hispanic (%)
Races - Hispanic (% change since 2000)
Races - Native Hawaiian and Other Pacific Islander alone (%)
Races - Native Hawaiian and Other Pacific Islander alone (% change since 2000)
Races - Two or more races(%)
Races - Two or more races(% change since 2000)
Races - Other race alone (%)
Races - Other race alone (% change since 2000)
Racial diversity
Place of birth - Born in state of residence (%)
Place of birth - Born in state of residence (%) - White
Place of birth - Born in state of residence (%) - Black or African American
Place of birth - Born in state of residence (%) - Asian
Place of birth - Born in state of residence (%) - Hispanic or Latino
Place of birth - Born in state of residence (%) - American Indian and Alaska Native
Place of birth - Born in state of residence (%) - Multirace
Place of birth - Born in state of residence (%) - Other Race
Place of birth - Born in other state (%)
Place of birth - Born in other state (%) - White
Place of birth - Born in other state (%) - Black or African American
Place of birth - Born in other state (%) - Asian
Place of birth - Born in other state (%) - Hispanic or Latino
Place of birth - Born in other state (%) - American Indian and Alaska Native
Place of birth - Born in other state (%) - Multirace
Place of birth - Born in other state (%) - Other Race
Place of birth - Native, outside of US (%)
Place of birth - Native, outside of US (%) - White
Place of birth - Native, outside of US (%) - Black or African American
Place of birth - Native, outside of US (%) - Asian
Place of birth - Native, outside of US (%) - Hispanic or Latino
Place of birth - Native, outside of US (%) - American Indian and Alaska Native
Place of birth - Native, outside of US (%) - Multirace
Place of birth - Native, outside of US (%) - Other Race
Place of birth - Foreign born (%)
Place of birth - Foreign born (%) - White
Place of birth - Foreign born (%) - Black or African American
Place of birth - Foreign born (%) - Asian
Place of birth - Foreign born (%) - Hispanic or Latino
Place of birth - Foreign born (%) - American Indian and Alaska Native
Place of birth - Foreign born (%) - Multirace
Place of birth - Foreign born (%) - Other Race
Residents speaking English at home (%)
Residents speaking English at home - Born in the United States (%)
Residents speaking English at home - Native, born elsewhere (%)
Residents speaking English at home - Foreign born (%)
Residents speaking Spanish at home (%)
Residents speaking Spanish at home - Born in the United States (%)
Residents speaking Spanish at home - Native, born elsewhere (%)
Residents speaking Spanish at home - Foreign born (%)
Residents speaking other language at home (%)
Residents speaking other language at home - Born in the United States (%)
Residents speaking other language at home - Native, born elsewhere (%)
Residents speaking other language at home - Foreign born (%)
Marital status - Never married (%)
Marital status - Now married (%)
Marital status - Separated (%)
Marital status - Widowed (%)
Marital status - Divorced (%)
Ancestries Reported - Arab (%)
Ancestries Reported - Czech (%)
Ancestries Reported - Danish (%)
Ancestries Reported - Dutch (%)
Ancestries Reported - English (%)
Ancestries Reported - French (%)
Ancestries Reported - French Canadian (%)
Ancestries Reported - German (%)
Ancestries Reported - Greek (%)
Ancestries Reported - Hungarian (%)
Ancestries Reported - Irish (%)
Ancestries Reported - Italian (%)
Ancestries Reported - Lithuanian (%)
Ancestries Reported - Norwegian (%)
Ancestries Reported - Polish (%)
Ancestries Reported - Portuguese (%)
Ancestries Reported - Russian (%)
Ancestries Reported - Scotch-Irish (%)
Ancestries Reported - Scottish (%)
Ancestries Reported - Slovak (%)
Ancestries Reported - Subsaharan African (%)
Ancestries Reported - Swedish (%)
Ancestries Reported - Swiss (%)
Ancestries Reported - Ukrainian (%)
Ancestries Reported - United States (%)
Ancestries Reported - Welsh (%)
Ancestries Reported - West Indian (%)
Ancestries Reported - Other (%)
Geographical mobility - Same house 1 year ago (%)
Geographical mobility - Same house 1 year ago (%) - White
Geographical mobility - Same house 1 year ago (%) - Black or African American
Geographical mobility - Same house 1 year ago (%) - Asian
Geographical mobility - Same house 1 year ago (%) - Hispanic or Latino
Geographical mobility - Same house 1 year ago (%) - American Indian and Alaska Native
Geographical mobility - Same house 1 year ago (%) - Multirace
Geographical mobility - Same house 1 year ago (%) - Other Race
Geographical mobility - Moved within same county (%)
Geographical mobility - Moved within same county (%) - White
Geographical mobility - Moved within same county (%) - Black or African American
Geographical mobility - Moved within same county (%) - Asian
Geographical mobility - Moved within same county (%) - Hispanic or Latino
Geographical mobility - Moved within same county (%) - American Indian and Alaska Native
Geographical mobility - Moved within same county (%) - Multirace
Geographical mobility - Moved within same county (%) - Other Race
Geographical mobility - Moved from different county within same state (%)
Geographical mobility - Moved from different county within same state (%) - White
Geographical mobility - Moved from different county within same state (%) - Black or African American
Geographical mobility - Moved from different county within same state (%) - Asian
Geographical mobility - Moved from different county within same state (%) - Hispanic or Latino
Geographical mobility - Moved from different county within same state (%) - American Indian and Alaska Native
Geographical mobility - Moved from different county within same state (%) - Multirace
Geographical mobility - Moved from different county within same state (%) - Other Race
Geographical mobility - Moved from different state (%)
Geographical mobility - Moved from different state (%) - White
Geographical mobility - Moved from different state (%) - Black or African American
Geographical mobility - Moved from different state (%) - Asian
Geographical mobility - Moved from different state (%) - Hispanic or Latino
Geographical mobility - Moved from different state (%) - American Indian and Alaska Native
Geographical mobility - Moved from different state (%) - Multirace
Geographical mobility - Moved from different state (%) - Other Race
Geographical mobility - Moved from abroad (%)
Geographical mobility - Moved from abroad (%) - White
Geographical mobility - Moved from abroad (%) - Black or African American
Geographical mobility - Moved from abroad (%) - Asian
Geographical mobility - Moved from abroad (%) - Hispanic or Latino
Geographical mobility - Moved from abroad (%) - American Indian and Alaska Native
Geographical mobility - Moved from abroad (%) - Multirace
Geographical mobility - Moved from abroad (%) - Other Race
Place of birth for the foreign-born population - Ireland (%)
Place of birth for the foreign-born population - Denmark (%)
Place of birth for the foreign-born population - Norway (%)
Place of birth for the foreign-born population - Sweden (%)
Place of birth for the foreign-born population - United Kingdom (%)
Place of birth for the foreign-born population - England (%)
Place of birth for the foreign-born population - Scotland (%)
Place of birth for the foreign-born population - Other Northern Europe (%)
Place of birth for the foreign-born population - Austria (%)
Place of birth for the foreign-born population - Belgium (%)
Place of birth for the foreign-born population - France (%)
Place of birth for the foreign-born population - Germany (%)
Place of birth for the foreign-born population - Netherlands (%)
Place of birth for the foreign-born population - Switzerland (%)
Place of birth for the foreign-born population - Other Western Europe (%)
Place of birth for the foreign-born population - Greece (%)
Place of birth for the foreign-born population - Italy (%)
Place of birth for the foreign-born population - Portugal (%)
Place of birth for the foreign-born population - Spain (%)
Place of birth for the foreign-born population - Other Southern Europe (%)
Place of birth for the foreign-born population - Albania (%)
Place of birth for the foreign-born population - Belarus (%)
Place of birth for the foreign-born population - Bosnia and Herzegovina (%)
Place of birth for the foreign-born population - Bulgaria (%)
Place of birth for the foreign-born population - Croatia (%)
Place of birth for the foreign-born population - Czechoslovakia (%)
Place of birth for the foreign-born population - Hungary (%)
Place of birth for the foreign-born population - Latvia (%)
Place of birth for the foreign-born population - Lithuania (%)
Place of birth for the foreign-born population - North Macedonia (Macedonia) (%)
Place of birth for the foreign-born population - Moldova (%)
Place of birth for the foreign-born population - Poland (%)
Place of birth for the foreign-born population - Romania (%)
Place of birth for the foreign-born population - Russia (%)
Place of birth for the foreign-born population - Serbia (%)
Place of birth for the foreign-born population - Ukraine (%)
Place of birth for the foreign-born population - Other Eastern Europe (%)
Place of birth for the foreign-born population - China (%)
Place of birth for the foreign-born population - Hong Kong (%)
Place of birth for the foreign-born population - Taiwan (%)
Place of birth for the foreign-born population - Japan (%)
Place of birth for the foreign-born population - Korea (%)
Place of birth for the foreign-born population - Other Eastern Asia (%)
Place of birth for the foreign-born population - Afghanistan (%)
Place of birth for the foreign-born population - Bangladesh (%)
Place of birth for the foreign-born population - India (%)
Place of birth for the foreign-born population - Iran (%)
Place of birth for the foreign-born population - Kazakhstan (%)
Place of birth for the foreign-born population - Nepal (%)
Place of birth for the foreign-born population - Pakistan (%)
Place of birth for the foreign-born population - Sri Lanka (%)
Place of birth for the foreign-born population - Uzbekistan (%)
Place of birth for the foreign-born population - Other South Central Asia (%)
Place of birth for the foreign-born population - Burma (%)
Place of birth for the foreign-born population - Cambodia (%)
Place of birth for the foreign-born population - Indonesia (%)
Place of birth for the foreign-born population - Laos (%)
Place of birth for the foreign-born population - Malaysia (%)
Place of birth for the foreign-born population - Philippines (%)
Place of birth for the foreign-born population - Singapore (%)
Place of birth for the foreign-born population - Thailand (%)
Place of birth for the foreign-born population - Vietnam (%)
Place of birth for the foreign-born population - Other South Eastern Asia (%)
Place of birth for the foreign-born population - Armenia (%)
Place of birth for the foreign-born population - Iraq (%)
Place of birth for the foreign-born population - Israel (%)
Place of birth for the foreign-born population - Jordan (%)
Place of birth for the foreign-born population - Kuwait (%)
Place of birth for the foreign-born population - Lebanon (%)
Place of birth for the foreign-born population - Saudi Arabia (%)
Place of birth for the foreign-born population - Syria (%)
Place of birth for the foreign-born population - Turkey (%)
Place of birth for the foreign-born population - Yemen (%)
Place of birth for the foreign-born population - Other Western Asia (%)
Place of birth for the foreign-born population - Eritrea (%)
Place of birth for the foreign-born population - Ethiopia (%)
Place of birth for the foreign-born population - Kenya (%)
Place of birth for the foreign-born population - Somalia (%)
Place of birth for the foreign-born population - Uganda (%)
Place of birth for the foreign-born population - Zimbabwe (%)
Place of birth for the foreign-born population - Other Eastern Africa (%)
Place of birth for the foreign-born population - Cameroon (%)
Place of birth for the foreign-born population - Congo (%)
Place of birth for the foreign-born population - Democratic Republic of Congo (Zaire) (%)
Place of birth for the foreign-born population - Other Middle Africa (%)
Place of birth for the foreign-born population - Egypt (%)
Place of birth for the foreign-born population - Morocco (%)
Place of birth for the foreign-born population - Sudan (%)
Place of birth for the foreign-born population - Other Northern Africa (%)
Place of birth for the foreign-born population - South Africa (%)
Place of birth for the foreign-born population - Other Southern Africa (%)
Place of birth for the foreign-born population - Cabo Verde (%)
Place of birth for the foreign-born population - Ghana (%)
Place of birth for the foreign-born population - Liberia (%)
Place of birth for the foreign-born population - Nigeria (%)
Place of birth for the foreign-born population - Senegal (%)
Place of birth for the foreign-born population - Sierra Leone (%)
Place of birth for the foreign-born population - Other Western Africa (%)
Place of birth for the foreign-born population - Australia (%)
Place of birth for the foreign-born population - New Zealand (%)
Place of birth for the foreign-born population - Fiji (%)
Place of birth for the foreign-born population - Micronesia (%)
Place of birth for the foreign-born population - Bahamas (%)
Place of birth for the foreign-born population - Barbados (%)
Place of birth for the foreign-born population - Cuba (%)
Place of birth for the foreign-born population - Dominica (%)
Place of birth for the foreign-born population - Dominican Republic (%)
Place of birth for the foreign-born population - Grenada (%)
Place of birth for the foreign-born population - Haiti (%)
Place of birth for the foreign-born population - Jamaica (%)
Place of birth for the foreign-born population - St. Vincent and the Grenadines (%)
Place of birth for the foreign-born population - Trinidad and Tobago (%)
Place of birth for the foreign-born population - West Indies (%)
Place of birth for the foreign-born population - Other Caribbean (%)
Place of birth for the foreign-born population - Belize (%)
Place of birth for the foreign-born population - Costa Rica (%)
Place of birth for the foreign-born population - El Salvador (%)
Place of birth for the foreign-born population - Guatemala (%)
Place of birth for the foreign-born population - Honduras (%)
Place of birth for the foreign-born population - Mexico (%)
Place of birth for the foreign-born population - Nicaragua (%)
Place of birth for the foreign-born population - Panama (%)
Place of birth for the foreign-born population - Other Central America (%)
Place of birth for the foreign-born population - Argentina (%)
Place of birth for the foreign-born population - Bolivia (%)
Place of birth for the foreign-born population - Brazil (%)
Place of birth for the foreign-born population - Chile (%)
Place of birth for the foreign-born population - Colombia (%)
Place of birth for the foreign-born population - Ecuador (%)
Place of birth for the foreign-born population - Guyana (%)
Place of birth for the foreign-born population - Peru (%)
Place of birth for the foreign-born population - Uruguay (%)
Place of birth for the foreign-born population - Venezuela (%)
Place of birth for the foreign-born population - Other South America (%)
Place of birth for the foreign-born population - Canada (%)
Place of birth for the foreign-born population - Other Northern America (%)
Place of birth for the foreign-born population - Other (%)
Latest news about races in Kennesaw, GA collected exclusively by city-data.com from local newspapers, TV, and radio stations
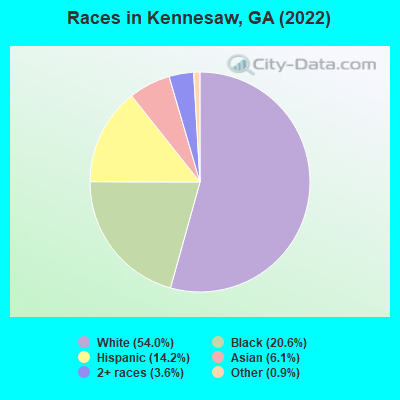
According to 2022 data, the most numerous races in Kennesaw, GA are White alone (18,146 residents), Black alone (6,931 residents), and Hispanic (4,772 residents). 78.2% of Kennesaw residents speak English at home. 16.2% of Kennesaw, GA residents are foreign-born (8.4% born in Latin America, 4.3% born in Asia, 1.8% born in Africa), which is 38.3% greater than the foreign-born rate of 10.0% across the entire state of Georgia.
Race distribution in Kennesaw
2000 2022
5,128,661 62.6% White alone 2,331,465 28.5% Black alone 435,227 5.3% Hispanic 171,513 2.1% Asian alone 87,364 1.1% Two or more races 17,670 0.2% American Indian alone 11,275 0.1% Other race alone 3,278 0.04% Native Hawaiian and Other
5,415,657 49.6% White alone 3,349,240 30.7% Black alone 1,132,604 10.4% Hispanic 479,156 4.4% Asian alone 462,923 4.2% Two or more races 54,416 0.5% Other race alone 11,923 0.1% American Indian alone 6,957 0.06% Native Hawaiian and Other
Income and house value in Kennesaw Median household income in 2022 $80,129 White non-Hispanic householders$59,973 Black householders$133,510 Asian householders$46,835 Some other race householders$108,765 Two or more races householders$96,665 Hispanic or Latino race householdersMedian 2022 house value $316,327 White Non-Hispanic householders$296,703 Black or African American householders$40,884 American Indian or Alaska Native householders $319,832 Asian householders$345,530 Some other race householders$293,198 Two or more races householders$305,814 Hispanic or Latino householders
Median age by race in Kennesaw
39.1 Median age for White residents36.7 41.0 35.7 Median age for Black or African American residents29.2 37.4 29.7 Median age for American Indian / Alaska Native residents30.2 -675,716,439.7 37.4 Median age for Asian residents45.2 30.6 -657,243,815.6 Median age for Native Hawaiian / Pacific Islander residents-693,227,090.9 -776,776,776.0 31.5 Median age for Other race residents16.7 42.1 26.2 Median age for Two or more races residents26.8 21.5 38.7 Median age for White alone residents35.9 40.6 32.3 Median age for Hispanic or Latino residents28.4 34.1
Owner/renter occupied households by race in Kennesaw
House owners and renters - White residents 5,724 66.0% Owner occupied2,945 34.0% Renter occupiedHouse owners and renters - Black or African American residents 1,338 52.5% Owner occupied1,212 47.5% Renter occupiedHouse owners and renters - American Indian / Alaska Native residents 31 100.0% Owner occupiedHouse owners and renters - Asian residents 623 93.0% Owner occupied47 7.0% Renter occupiedHouse owners and renters - Other race residents 241 62.9% Owner occupied142 37.1% Renter occupiedHouse owners and renters - Two or more races residents 917 85.0% Owner occupied162 15.0% Renter occupiedHouse owners and renters - White alone residents 5,461 65.6% Owner occupied2,862 34.4% Renter occupiedHouse owners and renters - Hispanic or Latino residents 1,111 71.6% Owner occupied440 28.4% Renter occupied
Language usage in Kennesaw
English speakers - Total 78.2% of residents of Kennesaw speak English at home.
10.9% of residents speak Spanish at home 2,290 66.6% Speak English very well1,150 33.4% Speak English less than very well10.9% of residents speak other language at home 2,346 68.1% Speak English very well1,101 31.9% Speak English less than very well
English speakers - Born in the United States 93.8% of residents of Kennesaw speak English at home.
3.4% of residents speak Spanish at home 468 95.5% Speak English very well22 4.5% Speak English less than very well2.6% of residents speak other language at home 284 74.9% Speak English very well95 25.1% Speak English less than very well
English speakers - Native, born elsewhere 60.5% of residents of Kennesaw speak English at home.
25.7% of residents speak Spanish at home 147 100.0% Speak English very well9.1% of residents speak other language at home 43 82.7% Speak English very well9 17.3% Speak English less than very well
English speakers - Foreign-born 15.7% of residents of Kennesaw speak English at home.
38.8% of residents speak Spanish at home 1,102 51.0% Speak English very well1,058 49.0% Speak English less than very well44.4% of residents speak other language at home 1,542 62.3% Speak English very well932 37.7% Speak English less than very well
White (Caucasian) - Speak only English Native:
97.6% (16,799)Foreign-born:
43.6% (272)
White (Caucasian) - Speak another language Native:
2.7% (460)Foreign-born:
59.9% (374)
Black or African American - Speak only English Native:
98.3% (5,302)Foreign-born:
25.4% (298)
Black or African American - Speak another language Native:
1.9% (100)Foreign-born:
76.7% (901)
American Indian / Alaska Native - Speak another language Native:
55.6% (45)Foreign-born:
100.0% (31)
Asian - Speak only English Native:
28.6% (291)Foreign-born:
10.0% (109)
Asian - Speak another language Native:
78.2% (795)Foreign-born:
89.5% (979)
Other race - Speak only English Native:
26.0% (195)Foreign-born:
2.3% (21)
Other race - Speak another language Native:
72.6% (543)Foreign-born:
97.9% (888)
Two or more races - Speak only English Native:
80.0% (1,032)Foreign-born:
7.5% (158)
Two or more races - Speak another language Native:
18.8% (243)Foreign-born:
89.8% (1,884)
White alone - Speak only English Native:
98.0% (16,570)Foreign-born:
49.0% (253)
White alone - Speak another language Native:
2.0% (340)Foreign-born:
52.6% (272)
Hispanic or Latino - Speak only English Native:
53.2% (1,122)Foreign-born:
3.8% (88)
Hispanic or Latino - Speak another language Native:
46.8% (988)Foreign-born:
96.2% (2,228)
Foreign-born residents in Kennesaw 5,450 residents are foreign born (8.4% Latin America , 4.3% Asia , 1.8% Africa ).
This city:
16.2%Georgia:
10.4%
Marital status for residents in Kennesaw Marital status - White (Caucasian) population 15 years and over
Males 33.6% Never married53.0% Now married0.5% Separated1.5% Widowed11.4% DivorcedFemales 26.3% Never married44.7% Now married1.0% Separated5.8% Widowed22.2% DivorcedWomen who gave birth in the past 12 months Now married:
90.9% (357)Unmarried:
9.1% (36)
Women who did not give birth in the past 12 months Now married:
40.7% (1,815)Unmarried:
59.3% (2,645)
Marital status - Black or African American population 15 years and over
Males 37.5% Never married53.6% Now married1.4% Separated0.9% Widowed6.7% DivorcedFemales 44.9% Never married33.6% Now married0.6% Separated2.3% Widowed18.6% DivorcedWomen who gave birth in the past 12 months Now married:
88.9% (62)Unmarried:
11.1% (8)
Women who did not give birth in the past 12 months Now married:
30.8% (582)Unmarried:
69.2% (1,310)
Marital status - American Indian / Alaska Native population 15 years and over
Males 0.0% Never married100.0% Now married0.0% Separated0.0% Widowed0.0% DivorcedFemales 0.0% Never married100.0% Now married0.0% Separated0.0% Widowed0.0% DivorcedWomen who did not give birth in the past 12 months Now married:
100.0% (27)Unmarried:
0.0% (0)
Marital status - Asian population 15 years and over
Males 13.5% Never married81.2% Now married0.8% Separated0.0% Widowed4.5% DivorcedFemales 42.1% Never married53.4% Now married0.0% Separated1.9% Widowed2.7% DivorcedWomen who gave birth in the past 12 months Now married:
100.0% (57)Unmarried:
0.0% (0)
Women who did not give birth in the past 12 months Now married:
35.8% (273)Unmarried:
64.2% (490)
Marital status - Other race population 15 years and over
Males 51.4% Never married48.6% Now married0.0% Separated0.0% Widowed0.0% DivorcedFemales 28.3% Never married63.8% Now married0.0% Separated4.5% Widowed3.3% DivorcedWomen who did not give birth in the past 12 months Now married:
65.3% (396)Unmarried:
34.7% (211)
Marital status - Two or more races population 15 years and over
Males 48.5% Never married48.7% Now married0.0% Separated0.8% Widowed2.0% DivorcedFemales 29.7% Never married56.9% Now married0.0% Separated0.0% Widowed13.4% DivorcedWomen who gave birth in the past 12 months Now married:
0.0% (0)Unmarried:
100.0% (39)
Women who did not give birth in the past 12 months Now married:
45.4% (212)Unmarried:
54.6% (255)
Marital status - White alone, not Hispanic / Latino population 15 years and over
Males 34.0% Never married52.5% Now married0.5% Separated1.6% Widowed11.3% DivorcedFemales 25.7% Never married44.8% Now married1.0% Separated6.1% Widowed22.3% DivorcedWomen who gave birth in the past 12 months Now married:
89.3% (312)Unmarried:
10.7% (38)
Women who did not give birth in the past 12 months Now married:
41.5% (1,854)Unmarried:
58.5% (2,614)
Marital status - Hispanic or Latino population 15 years and over
Males 42.3% Never married54.4% Now married0.0% Separated0.0% Widowed3.3% DivorcedFemales 31.6% Never married60.3% Now married0.0% Separated0.0% Widowed8.1% DivorcedWomen who gave birth in the past 12 months Now married:
70.3% (66)Unmarried:
29.7% (28)
Women who did not give birth in the past 12 months Now married:
53.4% (574)Unmarried:
46.6% (502)
Ancestries in Kennesaw
2,564 14.4% English1,319 7.4% Irish989 5.5% American799 4.5% German554 3.1% Italian290 1.6% European232 1.3% Jamaican222 1.2% Brazilian219 1.2% Nigerian203 1.1% Iranian189 1.1% African184 1.0% French173 1.0% Polish169 0.9% Scottish116 0.7% Haitian115 0.6% Ethiopian108 0.6% Scotch-Irish90 0.5% British88 0.5% Ghanaian67 0.4% French Canadian59 0.3% Finnish43 0.2% Swedish33 0.2% Northern European32 0.2% Ukrainian31 0.2% Portuguese27 0.2% Lebanese26 0.1% Greek25 0.1% Albanian24 0.1% Dutch23 0.1% Belgian23 0.1% Norwegian21 0.1% Hungarian20 0.1% Welsh19 0.1% Sudanese18 0.1% Slavic17 0.10% Romanian17 0.10% Eastern European17 0.10% Zimbabwean15 0.08% Slovene12 0.07% Croatian10 0.06% Bermudan9 0.05% Canadian8 0.04% West Indian
Geographical mobility in Kennesaw Same house 1 year ago 15,098 82.7% White (Caucasian)6,106 88.3% Black or African American75 99.5% American Indian / Alaska Native1,686 80.1% Asian1,570 89.2% Other race3,242 89.6% Two or more races14,894 82.7% White alone, not Hispanic / Latino4,136 89.8% Hispanic or LatinoMoved within same county 1,315 7.2% White / Caucasian278 4.0% Black or African American48 2.3% Asian34 56.6% Native Hawaiian / Pacific Islander30 1.7% Other race288 8.0% Two or more races1,329 7.4% White alone, not Hispanic / Latino255 5.5% Hispanic or LatinoMoved within same state 1,089 6.0% White / Caucasian221 3.2% Black or African American168 8.0% Asian26 43.5% Native Hawaiian / Pacific Islander60 3.4% Other race47 1.3% Two or more races1,055 5.9% White alone, not Hispanic / Latino93 2.0% Hispanic or LatinoMoved from different state 511 2.8% White / Caucasian338 4.9% Black or African American135 6.4% Asian15 0.8% Other race19 0.5% Two or more races448 2.5% White alone, not Hispanic / Latino107 2.3% Hispanic or LatinoMoved from abroad 28 0.2% White45 2.6% Other race14 0.4% Two or more races34 0.2% White alone, not Hispanic / Latino23 0.5% Hispanic or Latino
Children Nativity (place of birth) in Kennesaw
Children under 6 years - Living with two parents Both parents native 1,329 100.0% NativeBoth parents foreign-born 149 91.3% Native14 8.7% Foreign-bornOne native, one foreign-born parent 200 100.0% NativeChildren under 6 years - Living with one parent Native parent 223 100.0% NativeForeign-born parent 315 100.0% NativeChildren 6 to 17 years - Living with two parents Both parents native 1,597 100.0% NativeBoth parents foreign-born 585 56.1% Native457 43.9% Foreign-bornOne native, one foreign-born parent 424 78.2% Native118 21.8% Foreign-bornChildren 6 to 17 years - Living with one parent Native parent 1,286 100.0% NativeForeign-born parent 348 51.8% Native323 48.2% Foreign-born
Grandparents responsible for own grandchildren in Kennesaw
Grandparents (30 to 59 years) White / Caucasian 28 42.7% Responsible for grandchildren38 57.3% Not responsible for grandchildrenBlack or African American 85 100.0% Responsible for grandchildrenTwo or more races 86 100.0% Responsible for grandchildrenWhite alone, not Hispanic / Latino 19 29.8% Responsible for grandchildren45 70.2% Not responsible for grandchildrenHispanic or Latino 46 100.0% Responsible for grandchildrenGrandparents (60 years and over) White / Caucasian 101 47.0% Responsible for grandchildren114 53.0% Not responsible for grandchildrenBlack or African American 11 13.4% Responsible for grandchildren69 86.6% Not responsible for grandchildrenTwo or more races 20 100.0% Not responsible for grandchildrenWhite alone, not Hispanic / Latino 102 45.0% Responsible for grandchildren125 55.0% Not responsible for grandchildrenHispanic or Latino 13 100.0% Not responsible for grandchildren