Races in Kenilworth, New Jersey (NJ) Detailed Stats
Data:
Races - White alone (%)
Races - White alone (% change since 2000)
Races - Black alone (%)
Races - Black alone (% change since 2000)
Races - American Indian alone (%)
Races - American Indian alone (% change since 2000)
Races - Asian alone (%)
Races - Asian alone (% change since 2000)
Races - Hispanic (%)
Races - Hispanic (% change since 2000)
Races - Native Hawaiian and Other Pacific Islander alone (%)
Races - Native Hawaiian and Other Pacific Islander alone (% change since 2000)
Races - Two or more races(%)
Races - Two or more races(% change since 2000)
Races - Other race alone (%)
Races - Other race alone (% change since 2000)
Racial diversity
Place of birth - Born in state of residence (%)
Place of birth - Born in state of residence (%) - White
Place of birth - Born in state of residence (%) - Black or African American
Place of birth - Born in state of residence (%) - Asian
Place of birth - Born in state of residence (%) - Hispanic or Latino
Place of birth - Born in state of residence (%) - American Indian and Alaska Native
Place of birth - Born in state of residence (%) - Multirace
Place of birth - Born in state of residence (%) - Other Race
Place of birth - Born in other state (%)
Place of birth - Born in other state (%) - White
Place of birth - Born in other state (%) - Black or African American
Place of birth - Born in other state (%) - Asian
Place of birth - Born in other state (%) - Hispanic or Latino
Place of birth - Born in other state (%) - American Indian and Alaska Native
Place of birth - Born in other state (%) - Multirace
Place of birth - Born in other state (%) - Other Race
Place of birth - Native, outside of US (%)
Place of birth - Native, outside of US (%) - White
Place of birth - Native, outside of US (%) - Black or African American
Place of birth - Native, outside of US (%) - Asian
Place of birth - Native, outside of US (%) - Hispanic or Latino
Place of birth - Native, outside of US (%) - American Indian and Alaska Native
Place of birth - Native, outside of US (%) - Multirace
Place of birth - Native, outside of US (%) - Other Race
Place of birth - Foreign born (%)
Place of birth - Foreign born (%) - White
Place of birth - Foreign born (%) - Black or African American
Place of birth - Foreign born (%) - Asian
Place of birth - Foreign born (%) - Hispanic or Latino
Place of birth - Foreign born (%) - American Indian and Alaska Native
Place of birth - Foreign born (%) - Multirace
Place of birth - Foreign born (%) - Other Race
Residents speaking English at home (%)
Residents speaking English at home - Born in the United States (%)
Residents speaking English at home - Native, born elsewhere (%)
Residents speaking English at home - Foreign born (%)
Residents speaking Spanish at home (%)
Residents speaking Spanish at home - Born in the United States (%)
Residents speaking Spanish at home - Native, born elsewhere (%)
Residents speaking Spanish at home - Foreign born (%)
Residents speaking other language at home (%)
Residents speaking other language at home - Born in the United States (%)
Residents speaking other language at home - Native, born elsewhere (%)
Residents speaking other language at home - Foreign born (%)
Marital status - Never married (%)
Marital status - Now married (%)
Marital status - Separated (%)
Marital status - Widowed (%)
Marital status - Divorced (%)
Ancestries Reported - Arab (%)
Ancestries Reported - Czech (%)
Ancestries Reported - Danish (%)
Ancestries Reported - Dutch (%)
Ancestries Reported - English (%)
Ancestries Reported - French (%)
Ancestries Reported - French Canadian (%)
Ancestries Reported - German (%)
Ancestries Reported - Greek (%)
Ancestries Reported - Hungarian (%)
Ancestries Reported - Irish (%)
Ancestries Reported - Italian (%)
Ancestries Reported - Lithuanian (%)
Ancestries Reported - Norwegian (%)
Ancestries Reported - Polish (%)
Ancestries Reported - Portuguese (%)
Ancestries Reported - Russian (%)
Ancestries Reported - Scotch-Irish (%)
Ancestries Reported - Scottish (%)
Ancestries Reported - Slovak (%)
Ancestries Reported - Subsaharan African (%)
Ancestries Reported - Swedish (%)
Ancestries Reported - Swiss (%)
Ancestries Reported - Ukrainian (%)
Ancestries Reported - United States (%)
Ancestries Reported - Welsh (%)
Ancestries Reported - West Indian (%)
Ancestries Reported - Other (%)
Geographical mobility - Same house 1 year ago (%)
Geographical mobility - Same house 1 year ago (%) - White
Geographical mobility - Same house 1 year ago (%) - Black or African American
Geographical mobility - Same house 1 year ago (%) - Asian
Geographical mobility - Same house 1 year ago (%) - Hispanic or Latino
Geographical mobility - Same house 1 year ago (%) - American Indian and Alaska Native
Geographical mobility - Same house 1 year ago (%) - Multirace
Geographical mobility - Same house 1 year ago (%) - Other Race
Geographical mobility - Moved within same county (%)
Geographical mobility - Moved within same county (%) - White
Geographical mobility - Moved within same county (%) - Black or African American
Geographical mobility - Moved within same county (%) - Asian
Geographical mobility - Moved within same county (%) - Hispanic or Latino
Geographical mobility - Moved within same county (%) - American Indian and Alaska Native
Geographical mobility - Moved within same county (%) - Multirace
Geographical mobility - Moved within same county (%) - Other Race
Geographical mobility - Moved from different county within same state (%)
Geographical mobility - Moved from different county within same state (%) - White
Geographical mobility - Moved from different county within same state (%) - Black or African American
Geographical mobility - Moved from different county within same state (%) - Asian
Geographical mobility - Moved from different county within same state (%) - Hispanic or Latino
Geographical mobility - Moved from different county within same state (%) - American Indian and Alaska Native
Geographical mobility - Moved from different county within same state (%) - Multirace
Geographical mobility - Moved from different county within same state (%) - Other Race
Geographical mobility - Moved from different state (%)
Geographical mobility - Moved from different state (%) - White
Geographical mobility - Moved from different state (%) - Black or African American
Geographical mobility - Moved from different state (%) - Asian
Geographical mobility - Moved from different state (%) - Hispanic or Latino
Geographical mobility - Moved from different state (%) - American Indian and Alaska Native
Geographical mobility - Moved from different state (%) - Multirace
Geographical mobility - Moved from different state (%) - Other Race
Geographical mobility - Moved from abroad (%)
Geographical mobility - Moved from abroad (%) - White
Geographical mobility - Moved from abroad (%) - Black or African American
Geographical mobility - Moved from abroad (%) - Asian
Geographical mobility - Moved from abroad (%) - Hispanic or Latino
Geographical mobility - Moved from abroad (%) - American Indian and Alaska Native
Geographical mobility - Moved from abroad (%) - Multirace
Geographical mobility - Moved from abroad (%) - Other Race
Place of birth for the foreign-born population - Ireland (%)
Place of birth for the foreign-born population - Denmark (%)
Place of birth for the foreign-born population - Norway (%)
Place of birth for the foreign-born population - Sweden (%)
Place of birth for the foreign-born population - United Kingdom (%)
Place of birth for the foreign-born population - England (%)
Place of birth for the foreign-born population - Scotland (%)
Place of birth for the foreign-born population - Other Northern Europe (%)
Place of birth for the foreign-born population - Austria (%)
Place of birth for the foreign-born population - Belgium (%)
Place of birth for the foreign-born population - France (%)
Place of birth for the foreign-born population - Germany (%)
Place of birth for the foreign-born population - Netherlands (%)
Place of birth for the foreign-born population - Switzerland (%)
Place of birth for the foreign-born population - Other Western Europe (%)
Place of birth for the foreign-born population - Greece (%)
Place of birth for the foreign-born population - Italy (%)
Place of birth for the foreign-born population - Portugal (%)
Place of birth for the foreign-born population - Spain (%)
Place of birth for the foreign-born population - Other Southern Europe (%)
Place of birth for the foreign-born population - Albania (%)
Place of birth for the foreign-born population - Belarus (%)
Place of birth for the foreign-born population - Bosnia and Herzegovina (%)
Place of birth for the foreign-born population - Bulgaria (%)
Place of birth for the foreign-born population - Croatia (%)
Place of birth for the foreign-born population - Czechoslovakia (%)
Place of birth for the foreign-born population - Hungary (%)
Place of birth for the foreign-born population - Latvia (%)
Place of birth for the foreign-born population - Lithuania (%)
Place of birth for the foreign-born population - North Macedonia (Macedonia) (%)
Place of birth for the foreign-born population - Moldova (%)
Place of birth for the foreign-born population - Poland (%)
Place of birth for the foreign-born population - Romania (%)
Place of birth for the foreign-born population - Russia (%)
Place of birth for the foreign-born population - Serbia (%)
Place of birth for the foreign-born population - Ukraine (%)
Place of birth for the foreign-born population - Other Eastern Europe (%)
Place of birth for the foreign-born population - China (%)
Place of birth for the foreign-born population - Hong Kong (%)
Place of birth for the foreign-born population - Taiwan (%)
Place of birth for the foreign-born population - Japan (%)
Place of birth for the foreign-born population - Korea (%)
Place of birth for the foreign-born population - Other Eastern Asia (%)
Place of birth for the foreign-born population - Afghanistan (%)
Place of birth for the foreign-born population - Bangladesh (%)
Place of birth for the foreign-born population - India (%)
Place of birth for the foreign-born population - Iran (%)
Place of birth for the foreign-born population - Kazakhstan (%)
Place of birth for the foreign-born population - Nepal (%)
Place of birth for the foreign-born population - Pakistan (%)
Place of birth for the foreign-born population - Sri Lanka (%)
Place of birth for the foreign-born population - Uzbekistan (%)
Place of birth for the foreign-born population - Other South Central Asia (%)
Place of birth for the foreign-born population - Burma (%)
Place of birth for the foreign-born population - Cambodia (%)
Place of birth for the foreign-born population - Indonesia (%)
Place of birth for the foreign-born population - Laos (%)
Place of birth for the foreign-born population - Malaysia (%)
Place of birth for the foreign-born population - Philippines (%)
Place of birth for the foreign-born population - Singapore (%)
Place of birth for the foreign-born population - Thailand (%)
Place of birth for the foreign-born population - Vietnam (%)
Place of birth for the foreign-born population - Other South Eastern Asia (%)
Place of birth for the foreign-born population - Armenia (%)
Place of birth for the foreign-born population - Iraq (%)
Place of birth for the foreign-born population - Israel (%)
Place of birth for the foreign-born population - Jordan (%)
Place of birth for the foreign-born population - Kuwait (%)
Place of birth for the foreign-born population - Lebanon (%)
Place of birth for the foreign-born population - Saudi Arabia (%)
Place of birth for the foreign-born population - Syria (%)
Place of birth for the foreign-born population - Turkey (%)
Place of birth for the foreign-born population - Yemen (%)
Place of birth for the foreign-born population - Other Western Asia (%)
Place of birth for the foreign-born population - Eritrea (%)
Place of birth for the foreign-born population - Ethiopia (%)
Place of birth for the foreign-born population - Kenya (%)
Place of birth for the foreign-born population - Somalia (%)
Place of birth for the foreign-born population - Uganda (%)
Place of birth for the foreign-born population - Zimbabwe (%)
Place of birth for the foreign-born population - Other Eastern Africa (%)
Place of birth for the foreign-born population - Cameroon (%)
Place of birth for the foreign-born population - Congo (%)
Place of birth for the foreign-born population - Democratic Republic of Congo (Zaire) (%)
Place of birth for the foreign-born population - Other Middle Africa (%)
Place of birth for the foreign-born population - Egypt (%)
Place of birth for the foreign-born population - Morocco (%)
Place of birth for the foreign-born population - Sudan (%)
Place of birth for the foreign-born population - Other Northern Africa (%)
Place of birth for the foreign-born population - South Africa (%)
Place of birth for the foreign-born population - Other Southern Africa (%)
Place of birth for the foreign-born population - Cabo Verde (%)
Place of birth for the foreign-born population - Ghana (%)
Place of birth for the foreign-born population - Liberia (%)
Place of birth for the foreign-born population - Nigeria (%)
Place of birth for the foreign-born population - Senegal (%)
Place of birth for the foreign-born population - Sierra Leone (%)
Place of birth for the foreign-born population - Other Western Africa (%)
Place of birth for the foreign-born population - Australia (%)
Place of birth for the foreign-born population - New Zealand (%)
Place of birth for the foreign-born population - Fiji (%)
Place of birth for the foreign-born population - Micronesia (%)
Place of birth for the foreign-born population - Bahamas (%)
Place of birth for the foreign-born population - Barbados (%)
Place of birth for the foreign-born population - Cuba (%)
Place of birth for the foreign-born population - Dominica (%)
Place of birth for the foreign-born population - Dominican Republic (%)
Place of birth for the foreign-born population - Grenada (%)
Place of birth for the foreign-born population - Haiti (%)
Place of birth for the foreign-born population - Jamaica (%)
Place of birth for the foreign-born population - St. Vincent and the Grenadines (%)
Place of birth for the foreign-born population - Trinidad and Tobago (%)
Place of birth for the foreign-born population - West Indies (%)
Place of birth for the foreign-born population - Other Caribbean (%)
Place of birth for the foreign-born population - Belize (%)
Place of birth for the foreign-born population - Costa Rica (%)
Place of birth for the foreign-born population - El Salvador (%)
Place of birth for the foreign-born population - Guatemala (%)
Place of birth for the foreign-born population - Honduras (%)
Place of birth for the foreign-born population - Mexico (%)
Place of birth for the foreign-born population - Nicaragua (%)
Place of birth for the foreign-born population - Panama (%)
Place of birth for the foreign-born population - Other Central America (%)
Place of birth for the foreign-born population - Argentina (%)
Place of birth for the foreign-born population - Bolivia (%)
Place of birth for the foreign-born population - Brazil (%)
Place of birth for the foreign-born population - Chile (%)
Place of birth for the foreign-born population - Colombia (%)
Place of birth for the foreign-born population - Ecuador (%)
Place of birth for the foreign-born population - Guyana (%)
Place of birth for the foreign-born population - Peru (%)
Place of birth for the foreign-born population - Uruguay (%)
Place of birth for the foreign-born population - Venezuela (%)
Place of birth for the foreign-born population - Other South America (%)
Place of birth for the foreign-born population - Canada (%)
Place of birth for the foreign-born population - Other Northern America (%)
Place of birth for the foreign-born population - Other (%)
Latest news about races in Kenilworth, NJ collected exclusively by city-data.com from local newspapers, TV, and radio stations
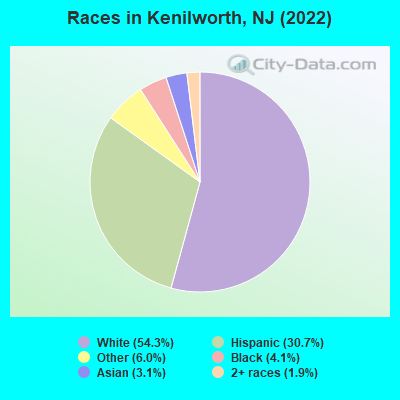
According to 2022 data, the most numerous races in Kenilworth, NJ are White alone (4,510 residents), Hispanic (2,548 residents), and Black alone (337 residents). 63.2% of Kenilworth residents speak English at home. 17.5% of Kenilworth, NJ residents are foreign-born (7.5% born in Europe, 7.1% born in Latin America, 2.2% born in Asia), which is 31.7% less than the foreign-born rate of 23.0% across the entire state of New Jersey.
Race distribution in Kenilworth
2000 2022
5,557,209 66.0% White alone 1,117,191 13.3% Hispanic 1,096,171 13.0% Black alone 477,012 5.7% Asian alone 133,689 1.6% Two or more races 19,565 0.2% Other race alone 11,338 0.1% American Indian alone 2,175 0.03% Native Hawaiian and Other
4,766,476 51.5% White alone 2,028,470 21.9% Hispanic 1,111,632 12.0% Black alone 923,546 10.0% Asian alone 332,237 3.6% Two or more races 89,847 1.0% Other race alone 8,557 0.09% American Indian alone 934 0.01% Native Hawaiian and Other
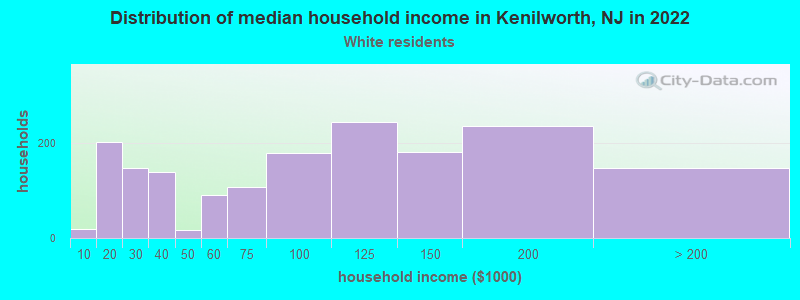
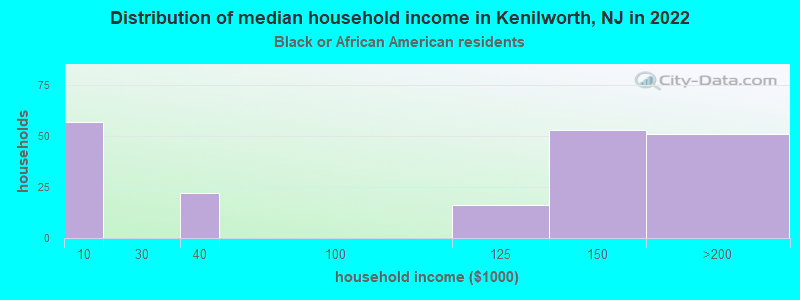
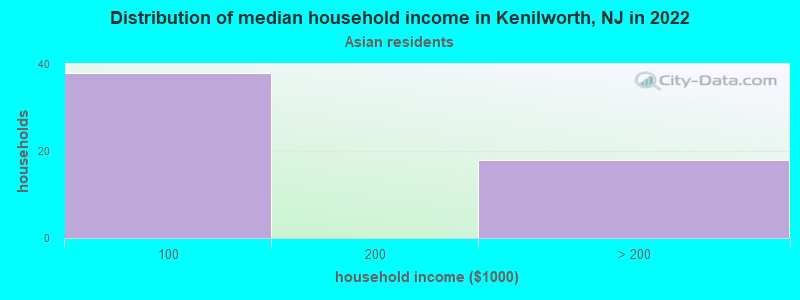
Income and house value in Kenilworth Median household income in 2022 $89,145 White non-Hispanic householders$147,018 Black householdersover $200,000 Two or more races householders$169,890 Hispanic or Latino race householdersMedian 2022 house value $497,906 White Non-Hispanic householders$320,449 Black or African American householders $640,898 Asian householders$462,870 Some other race householders$542,342 Hispanic or Latino householders
Median age by race in Kenilworth
45.6 Median age for White residents41.5 48.4 46.8 Median age for Black or African American residents46.5 39.4 -656,626,505.4 Median age for American Indian / Alaska Native residents-749,529,189.5 -612,668,742.9 41.0 Median age for Asian residents21.0 41.8 -1,010,045,661.1 Median age for Native Hawaiian / Pacific Islander residents-860,335,194.7 -713,070,378.3 20.0 Median age for Other race residents30.0 15.4 37.8 Median age for Two or more races residents39.2 28.1 45.1 Median age for White alone residents42.1 48.4 32.5 Median age for Hispanic or Latino residents38.4 32.2
Owner/renter occupied households by race in Kenilworth
House owners and renters - White residents 1,289 74.2% Owner occupied449 25.8% Renter occupiedHouse owners and renters - Black or African American residents 184 91.1% Owner occupied18 8.9% Renter occupiedHouse owners and renters - Asian residents 52 100.0% Owner occupiedHouse owners and renters - Other race residents 393 100.0% Renter occupiedHouse owners and renters - Two or more races residents 254 72.8% Owner occupied95 27.2% Renter occupiedHouse owners and renters - White alone residents 1,294 77.0% Owner occupied386 23.0% Renter occupiedHouse owners and renters - Hispanic or Latino residents 334 45.4% Owner occupied402 54.6% Renter occupied
Language usage in Kenilworth
English speakers - Total 63.2% of residents of Kenilworth speak English at home.
19.7% of residents speak Spanish at home 1,247 79.1% Speak English very well330 20.9% Speak English less than very well15.9% of residents speak other language at home 846 66.6% Speak English very well425 33.4% Speak English less than very well
English speakers - Born in the United States 72.6% of residents of Kenilworth speak English at home.
12.2% of residents speak Spanish at home 101 100.0% Speak English very well16.6% of residents speak other language at home 137 100.0% Speak English very well
English speakers - Native, born elsewhere 55.6% of residents of Kenilworth speak English at home.
38.9% of residents speak Spanish at home 116 95.9% Speak English very well5 4.1% Speak English less than very well1.6% of residents speak other language at home 5 100.0% Speak English very well
English speakers - Foreign-born 13.6% of residents of Kenilworth speak English at home.
37.2% of residents speak Spanish at home 268 48.6% Speak English very well284 51.4% Speak English less than very well47.7% of residents speak other language at home 278 39.3% Speak English very well430 60.7% Speak English less than very well
White (Caucasian) - Speak only English Native:
87.2% (3,423)Foreign-born:
14.3% (83)
White (Caucasian) - Speak another language Native:
12.4% (485)Foreign-born:
85.8% (500)
Black or African American - Speak only English Native:
99.1% (332)Foreign-born:
86.5% (42)
Asian - Speak only English Native:
31.0% (23)Foreign-born:
24.5% (46)
Asian - Speak another language Native:
56.3% (42)Foreign-born:
76.3% (143)
Other race - Speak another language Native:
53.4% (526)Foreign-born:
98.5% (159)
Two or more races - Speak another language Native:
43.4% (547)Foreign-born:
99.3% (325)
White alone - Speak only English Native:
89.5% (3,359)Foreign-born:
8.6% (46)
White alone - Speak another language Native:
10.5% (394)Foreign-born:
92.6% (491)
Hispanic or Latino - Speak only English Native:
56.7% (1,061)Foreign-born:
12.2% (74)
Hispanic or Latino - Speak another language Native:
43.7% (818)Foreign-born:
89.3% (540)
Foreign-born residents in Kenilworth 1,452 residents are foreign born (7.5% Europe , 7.1% Latin America , 2.2% Asia ).
This city:
17.5%New Jersey:
23.2%
Marital status for residents in Kenilworth Marital status - White (Caucasian) population 15 years and over
Males 38.2% Never married46.5% Now married2.6% Separated5.9% Widowed6.8% DivorcedFemales 28.0% Never married44.5% Now married0.0% Separated11.4% Widowed16.2% DivorcedWomen who gave birth in the past 12 months Now married:
100.0% (18)Unmarried:
0.0% (0)
Women who did not give birth in the past 12 months Now married:
35.9% (339)Unmarried:
64.1% (605)
Marital status - Black or African American population 15 years and over
Males 3.3% Never married96.7% Now married0.0% Separated0.0% Widowed0.0% DivorcedFemales 11.6% Never married44.5% Now married0.0% Separated0.0% Widowed43.9% DivorcedWomen who did not give birth in the past 12 months Now married:
45.0% (56)Unmarried:
55.0% (68)
Marital status - Asian population 15 years and over
Males 44.6% Never married55.4% Now married0.0% Separated0.0% Widowed0.0% DivorcedFemales 18.5% Never married46.3% Now married0.0% Separated0.0% Widowed35.2% DivorcedWomen who did not give birth in the past 12 months Now married:
55.6% (24)Unmarried:
44.4% (20)
Marital status - Other race population 15 years and over
Males 39.6% Never married60.4% Now married0.0% Separated0.0% Widowed0.0% DivorcedFemales 68.0% Never married32.0% Now married0.0% Separated0.0% Widowed0.0% DivorcedWomen who gave birth in the past 12 months Now married:
21.0% (14)Unmarried:
79.0% (51)
Women who did not give birth in the past 12 months Now married:
34.6% (93)Unmarried:
65.4% (175)
Marital status - Two or more races population 15 years and over
Males 2.4% Never married80.1% Now married0.0% Separated6.6% Widowed10.8% DivorcedFemales 5.0% Never married72.4% Now married0.0% Separated1.6% Widowed21.0% DivorcedWomen who did not give birth in the past 12 months Now married:
65.3% (205)Unmarried:
34.7% (109)
Marital status - White alone, not Hispanic / Latino population 15 years and over
Males 38.2% Never married46.0% Now married2.8% Separated6.3% Widowed6.6% DivorcedFemales 27.3% Never married44.8% Now married0.0% Separated12.8% Widowed15.0% DivorcedWomen who gave birth in the past 12 months Now married:
100.0% (19)Unmarried:
0.0% (0)
Women who did not give birth in the past 12 months Now married:
42.6% (353)Unmarried:
57.4% (476)
Marital status - Hispanic or Latino population 15 years and over
Males 15.5% Never married79.1% Now married0.0% Separated3.7% Widowed1.7% DivorcedFemales 30.0% Never married55.0% Now married0.0% Separated2.8% Widowed12.2% DivorcedWomen who gave birth in the past 12 months Now married:
100.0% (13)Unmarried:
0.0% (0)
Women who did not give birth in the past 12 months Now married:
35.4% (173)Unmarried:
64.6% (316)
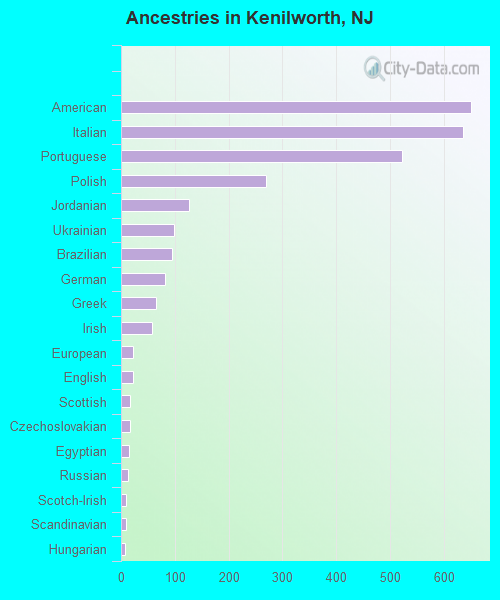
Ancestries in Kenilworth
652 13.3% American637 13.0% Italian523 10.7% Portuguese269 5.5% Polish127 2.6% Jordanian98 2.0% Ukrainian94 1.9% Brazilian82 1.7% German65 1.3% Greek57 1.2% Irish23 0.5% European22 0.4% English17 0.3% Scottish16 0.3% Czechoslovakian14 0.3% Egyptian13 0.3% Russian10 0.2% Scotch-Irish9 0.2% Scandinavian8 0.2% Hungarian
Children Nativity (place of birth) in Kenilworth
Children under 6 years - Living with two parents Both parents native 55 100.0% NativeBoth parents foreign-born 75 100.0% NativeOne native, one foreign-born parent 39 100.0% NativeChildren under 6 years - Living with one parent Native parent 124 100.0% NativeForeign-born parent 51 100.0% NativeChildren 6 to 17 years - Living with two parents Both parents native 825 100.0% NativeBoth parents foreign-born 82 100.0% NativeOne native, one foreign-born parent 328 100.0% NativeChildren 6 to 17 years - Living with one parent Native parent 359 100.0% NativeForeign-born parent 212 50.2% Native210 49.8% Foreign-born
Grandparents responsible for own grandchildren in Kenilworth
Grandparents (30 to 59 years) White / Caucasian 7 100.0% Not responsible for grandchildrenWhite alone, not Hispanic / Latino 9 100.0% Not responsible for grandchildren
Grandparents (60 years and over) White / Caucasian 93 100.0% Not responsible for grandchildrenWhite alone, not Hispanic / Latino 40 100.0% Not responsible for grandchildren