Races in Kendall West, Florida (FL) Detailed Stats
Data:
Races - White alone (%)
Races - White alone (% change since 2000)
Races - Black alone (%)
Races - Black alone (% change since 2000)
Races - American Indian alone (%)
Races - American Indian alone (% change since 2000)
Races - Asian alone (%)
Races - Asian alone (% change since 2000)
Races - Hispanic (%)
Races - Hispanic (% change since 2000)
Races - Native Hawaiian and Other Pacific Islander alone (%)
Races - Native Hawaiian and Other Pacific Islander alone (% change since 2000)
Races - Two or more races(%)
Races - Two or more races(% change since 2000)
Races - Other race alone (%)
Races - Other race alone (% change since 2000)
Racial diversity
Place of birth - Born in state of residence (%)
Place of birth - Born in state of residence (%) - White
Place of birth - Born in state of residence (%) - Black or African American
Place of birth - Born in state of residence (%) - Asian
Place of birth - Born in state of residence (%) - Hispanic or Latino
Place of birth - Born in state of residence (%) - American Indian and Alaska Native
Place of birth - Born in state of residence (%) - Multirace
Place of birth - Born in state of residence (%) - Other Race
Place of birth - Born in other state (%)
Place of birth - Born in other state (%) - White
Place of birth - Born in other state (%) - Black or African American
Place of birth - Born in other state (%) - Asian
Place of birth - Born in other state (%) - Hispanic or Latino
Place of birth - Born in other state (%) - American Indian and Alaska Native
Place of birth - Born in other state (%) - Multirace
Place of birth - Born in other state (%) - Other Race
Place of birth - Native, outside of US (%)
Place of birth - Native, outside of US (%) - White
Place of birth - Native, outside of US (%) - Black or African American
Place of birth - Native, outside of US (%) - Asian
Place of birth - Native, outside of US (%) - Hispanic or Latino
Place of birth - Native, outside of US (%) - American Indian and Alaska Native
Place of birth - Native, outside of US (%) - Multirace
Place of birth - Native, outside of US (%) - Other Race
Place of birth - Foreign born (%)
Place of birth - Foreign born (%) - White
Place of birth - Foreign born (%) - Black or African American
Place of birth - Foreign born (%) - Asian
Place of birth - Foreign born (%) - Hispanic or Latino
Place of birth - Foreign born (%) - American Indian and Alaska Native
Place of birth - Foreign born (%) - Multirace
Place of birth - Foreign born (%) - Other Race
Residents speaking English at home (%)
Residents speaking English at home - Born in the United States (%)
Residents speaking English at home - Native, born elsewhere (%)
Residents speaking English at home - Foreign born (%)
Residents speaking Spanish at home (%)
Residents speaking Spanish at home - Born in the United States (%)
Residents speaking Spanish at home - Native, born elsewhere (%)
Residents speaking Spanish at home - Foreign born (%)
Residents speaking other language at home (%)
Residents speaking other language at home - Born in the United States (%)
Residents speaking other language at home - Native, born elsewhere (%)
Residents speaking other language at home - Foreign born (%)
Marital status - Never married (%)
Marital status - Now married (%)
Marital status - Separated (%)
Marital status - Widowed (%)
Marital status - Divorced (%)
Ancestries Reported - Arab (%)
Ancestries Reported - Czech (%)
Ancestries Reported - Danish (%)
Ancestries Reported - Dutch (%)
Ancestries Reported - English (%)
Ancestries Reported - French (%)
Ancestries Reported - French Canadian (%)
Ancestries Reported - German (%)
Ancestries Reported - Greek (%)
Ancestries Reported - Hungarian (%)
Ancestries Reported - Irish (%)
Ancestries Reported - Italian (%)
Ancestries Reported - Lithuanian (%)
Ancestries Reported - Norwegian (%)
Ancestries Reported - Polish (%)
Ancestries Reported - Portuguese (%)
Ancestries Reported - Russian (%)
Ancestries Reported - Scotch-Irish (%)
Ancestries Reported - Scottish (%)
Ancestries Reported - Slovak (%)
Ancestries Reported - Subsaharan African (%)
Ancestries Reported - Swedish (%)
Ancestries Reported - Swiss (%)
Ancestries Reported - Ukrainian (%)
Ancestries Reported - United States (%)
Ancestries Reported - Welsh (%)
Ancestries Reported - West Indian (%)
Ancestries Reported - Other (%)
Geographical mobility - Same house 1 year ago (%)
Geographical mobility - Same house 1 year ago (%) - White
Geographical mobility - Same house 1 year ago (%) - Black or African American
Geographical mobility - Same house 1 year ago (%) - Asian
Geographical mobility - Same house 1 year ago (%) - Hispanic or Latino
Geographical mobility - Same house 1 year ago (%) - American Indian and Alaska Native
Geographical mobility - Same house 1 year ago (%) - Multirace
Geographical mobility - Same house 1 year ago (%) - Other Race
Geographical mobility - Moved within same county (%)
Geographical mobility - Moved within same county (%) - White
Geographical mobility - Moved within same county (%) - Black or African American
Geographical mobility - Moved within same county (%) - Asian
Geographical mobility - Moved within same county (%) - Hispanic or Latino
Geographical mobility - Moved within same county (%) - American Indian and Alaska Native
Geographical mobility - Moved within same county (%) - Multirace
Geographical mobility - Moved within same county (%) - Other Race
Geographical mobility - Moved from different county within same state (%)
Geographical mobility - Moved from different county within same state (%) - White
Geographical mobility - Moved from different county within same state (%) - Black or African American
Geographical mobility - Moved from different county within same state (%) - Asian
Geographical mobility - Moved from different county within same state (%) - Hispanic or Latino
Geographical mobility - Moved from different county within same state (%) - American Indian and Alaska Native
Geographical mobility - Moved from different county within same state (%) - Multirace
Geographical mobility - Moved from different county within same state (%) - Other Race
Geographical mobility - Moved from different state (%)
Geographical mobility - Moved from different state (%) - White
Geographical mobility - Moved from different state (%) - Black or African American
Geographical mobility - Moved from different state (%) - Asian
Geographical mobility - Moved from different state (%) - Hispanic or Latino
Geographical mobility - Moved from different state (%) - American Indian and Alaska Native
Geographical mobility - Moved from different state (%) - Multirace
Geographical mobility - Moved from different state (%) - Other Race
Geographical mobility - Moved from abroad (%)
Geographical mobility - Moved from abroad (%) - White
Geographical mobility - Moved from abroad (%) - Black or African American
Geographical mobility - Moved from abroad (%) - Asian
Geographical mobility - Moved from abroad (%) - Hispanic or Latino
Geographical mobility - Moved from abroad (%) - American Indian and Alaska Native
Geographical mobility - Moved from abroad (%) - Multirace
Geographical mobility - Moved from abroad (%) - Other Race
Place of birth for the foreign-born population - Ireland (%)
Place of birth for the foreign-born population - Denmark (%)
Place of birth for the foreign-born population - Norway (%)
Place of birth for the foreign-born population - Sweden (%)
Place of birth for the foreign-born population - United Kingdom (%)
Place of birth for the foreign-born population - England (%)
Place of birth for the foreign-born population - Scotland (%)
Place of birth for the foreign-born population - Other Northern Europe (%)
Place of birth for the foreign-born population - Austria (%)
Place of birth for the foreign-born population - Belgium (%)
Place of birth for the foreign-born population - France (%)
Place of birth for the foreign-born population - Germany (%)
Place of birth for the foreign-born population - Netherlands (%)
Place of birth for the foreign-born population - Switzerland (%)
Place of birth for the foreign-born population - Other Western Europe (%)
Place of birth for the foreign-born population - Greece (%)
Place of birth for the foreign-born population - Italy (%)
Place of birth for the foreign-born population - Portugal (%)
Place of birth for the foreign-born population - Spain (%)
Place of birth for the foreign-born population - Other Southern Europe (%)
Place of birth for the foreign-born population - Albania (%)
Place of birth for the foreign-born population - Belarus (%)
Place of birth for the foreign-born population - Bosnia and Herzegovina (%)
Place of birth for the foreign-born population - Bulgaria (%)
Place of birth for the foreign-born population - Croatia (%)
Place of birth for the foreign-born population - Czechoslovakia (%)
Place of birth for the foreign-born population - Hungary (%)
Place of birth for the foreign-born population - Latvia (%)
Place of birth for the foreign-born population - Lithuania (%)
Place of birth for the foreign-born population - North Macedonia (Macedonia) (%)
Place of birth for the foreign-born population - Moldova (%)
Place of birth for the foreign-born population - Poland (%)
Place of birth for the foreign-born population - Romania (%)
Place of birth for the foreign-born population - Russia (%)
Place of birth for the foreign-born population - Serbia (%)
Place of birth for the foreign-born population - Ukraine (%)
Place of birth for the foreign-born population - Other Eastern Europe (%)
Place of birth for the foreign-born population - China (%)
Place of birth for the foreign-born population - Hong Kong (%)
Place of birth for the foreign-born population - Taiwan (%)
Place of birth for the foreign-born population - Japan (%)
Place of birth for the foreign-born population - Korea (%)
Place of birth for the foreign-born population - Other Eastern Asia (%)
Place of birth for the foreign-born population - Afghanistan (%)
Place of birth for the foreign-born population - Bangladesh (%)
Place of birth for the foreign-born population - India (%)
Place of birth for the foreign-born population - Iran (%)
Place of birth for the foreign-born population - Kazakhstan (%)
Place of birth for the foreign-born population - Nepal (%)
Place of birth for the foreign-born population - Pakistan (%)
Place of birth for the foreign-born population - Sri Lanka (%)
Place of birth for the foreign-born population - Uzbekistan (%)
Place of birth for the foreign-born population - Other South Central Asia (%)
Place of birth for the foreign-born population - Burma (%)
Place of birth for the foreign-born population - Cambodia (%)
Place of birth for the foreign-born population - Indonesia (%)
Place of birth for the foreign-born population - Laos (%)
Place of birth for the foreign-born population - Malaysia (%)
Place of birth for the foreign-born population - Philippines (%)
Place of birth for the foreign-born population - Singapore (%)
Place of birth for the foreign-born population - Thailand (%)
Place of birth for the foreign-born population - Vietnam (%)
Place of birth for the foreign-born population - Other South Eastern Asia (%)
Place of birth for the foreign-born population - Armenia (%)
Place of birth for the foreign-born population - Iraq (%)
Place of birth for the foreign-born population - Israel (%)
Place of birth for the foreign-born population - Jordan (%)
Place of birth for the foreign-born population - Kuwait (%)
Place of birth for the foreign-born population - Lebanon (%)
Place of birth for the foreign-born population - Saudi Arabia (%)
Place of birth for the foreign-born population - Syria (%)
Place of birth for the foreign-born population - Turkey (%)
Place of birth for the foreign-born population - Yemen (%)
Place of birth for the foreign-born population - Other Western Asia (%)
Place of birth for the foreign-born population - Eritrea (%)
Place of birth for the foreign-born population - Ethiopia (%)
Place of birth for the foreign-born population - Kenya (%)
Place of birth for the foreign-born population - Somalia (%)
Place of birth for the foreign-born population - Uganda (%)
Place of birth for the foreign-born population - Zimbabwe (%)
Place of birth for the foreign-born population - Other Eastern Africa (%)
Place of birth for the foreign-born population - Cameroon (%)
Place of birth for the foreign-born population - Congo (%)
Place of birth for the foreign-born population - Democratic Republic of Congo (Zaire) (%)
Place of birth for the foreign-born population - Other Middle Africa (%)
Place of birth for the foreign-born population - Egypt (%)
Place of birth for the foreign-born population - Morocco (%)
Place of birth for the foreign-born population - Sudan (%)
Place of birth for the foreign-born population - Other Northern Africa (%)
Place of birth for the foreign-born population - South Africa (%)
Place of birth for the foreign-born population - Other Southern Africa (%)
Place of birth for the foreign-born population - Cabo Verde (%)
Place of birth for the foreign-born population - Ghana (%)
Place of birth for the foreign-born population - Liberia (%)
Place of birth for the foreign-born population - Nigeria (%)
Place of birth for the foreign-born population - Senegal (%)
Place of birth for the foreign-born population - Sierra Leone (%)
Place of birth for the foreign-born population - Other Western Africa (%)
Place of birth for the foreign-born population - Australia (%)
Place of birth for the foreign-born population - New Zealand (%)
Place of birth for the foreign-born population - Fiji (%)
Place of birth for the foreign-born population - Micronesia (%)
Place of birth for the foreign-born population - Bahamas (%)
Place of birth for the foreign-born population - Barbados (%)
Place of birth for the foreign-born population - Cuba (%)
Place of birth for the foreign-born population - Dominica (%)
Place of birth for the foreign-born population - Dominican Republic (%)
Place of birth for the foreign-born population - Grenada (%)
Place of birth for the foreign-born population - Haiti (%)
Place of birth for the foreign-born population - Jamaica (%)
Place of birth for the foreign-born population - St. Vincent and the Grenadines (%)
Place of birth for the foreign-born population - Trinidad and Tobago (%)
Place of birth for the foreign-born population - West Indies (%)
Place of birth for the foreign-born population - Other Caribbean (%)
Place of birth for the foreign-born population - Belize (%)
Place of birth for the foreign-born population - Costa Rica (%)
Place of birth for the foreign-born population - El Salvador (%)
Place of birth for the foreign-born population - Guatemala (%)
Place of birth for the foreign-born population - Honduras (%)
Place of birth for the foreign-born population - Mexico (%)
Place of birth for the foreign-born population - Nicaragua (%)
Place of birth for the foreign-born population - Panama (%)
Place of birth for the foreign-born population - Other Central America (%)
Place of birth for the foreign-born population - Argentina (%)
Place of birth for the foreign-born population - Bolivia (%)
Place of birth for the foreign-born population - Brazil (%)
Place of birth for the foreign-born population - Chile (%)
Place of birth for the foreign-born population - Colombia (%)
Place of birth for the foreign-born population - Ecuador (%)
Place of birth for the foreign-born population - Guyana (%)
Place of birth for the foreign-born population - Peru (%)
Place of birth for the foreign-born population - Uruguay (%)
Place of birth for the foreign-born population - Venezuela (%)
Place of birth for the foreign-born population - Other South America (%)
Place of birth for the foreign-born population - Canada (%)
Place of birth for the foreign-born population - Other Northern America (%)
Place of birth for the foreign-born population - Other (%)
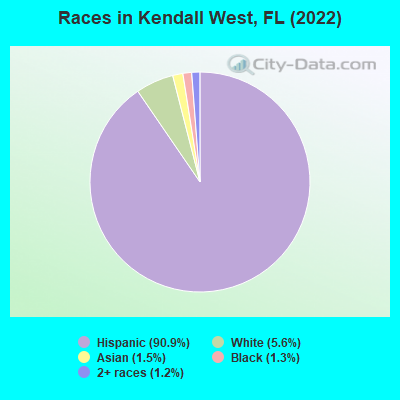
According to 2022 data, the most numerous races in Kendall West, FL are White alone (1,983 residents), Hispanic (32,192 residents), and Black alone (454 residents). 8.4% of Kendall West residents speak English at home. 69.5% of Kendall West, FL residents are foreign-born (66.3% born in Latin America), which is 69.8% greater than the foreign-born rate of 21.0% across the entire state of Florida.
Race distribution in Kendall West
2000 2022
10,458,509 65.4% White alone 2,682,715 16.8% Hispanic 2,264,268 14.2% Black alone 261,693 1.6% Asian alone 236,954 1.5% Two or more races 42,358 0.3% American Indian alone 28,994 0.2% Other race alone 6,887 0.04% Native Hawaiian and Other
11,309,403 50.8% White alone 6,025,039 27.1% Hispanic 3,241,015 14.6% Black alone 861,630 3.9% Two or more races 623,692 2.8% Asian alone 152,054 0.7% Other race alone 22,504 0.1% American Indian alone 9,486 0.04% Native Hawaiian and Other
Income and house value in Kendall West Median household income in 2022 $84,190 White non-Hispanic householders$74,929 Black householders$15,743 Asian householders$59,425 Some other race householders$62,221 Two or more races householders$64,600 Hispanic or Latino race householdersMedian 2022 house value $460,203 White Non-Hispanic householders$340,020 Black or African American householders $562,471 Asian householders$553,886 Native Hawaiian and other Pacific Islander householders$363,534 Some other race householders$447,513 Two or more races householders$488,570 Hispanic or Latino householders
Median age by race in Kendall West
38.1 Median age for White residents35.1 39.7 50.0 Median age for Black or African American residents34.8 59.2 -653,446,647.1 Median age for American Indian / Alaska Native residents-543,352,600.6 -762,696,213.5 37.3 Median age for Asian residents34.0 61.6 -679,849,340.2 Median age for Native Hawaiian / Pacific Islander residents-858,307,848.3 -443,298,968.6 50.5 Median age for Other race residents49.2 50.7 48.3 Median age for Two or more races residents46.0 50.1 28.9 Median age for White alone residents26.9 40.1 45.3 Median age for Hispanic or Latino residents42.8 47.1
Owner/renter occupied households by race in Kendall West
House owners and renters - White residents 2,132 59.4% Owner occupied1,460 40.6% Renter occupiedHouse owners and renters - Black or African American residents 123 63.1% Owner occupied72 36.9% Renter occupiedHouse owners and renters - Asian residents 42 17.9% Owner occupied192 82.1% Renter occupiedHouse owners and renters - Other race residents 526 75.2% Owner occupied173 24.8% Renter occupiedHouse owners and renters - Two or more races residents 4,932 50.4% Owner occupied4,847 49.6% Renter occupiedHouse owners and renters - White alone residents 324 48.6% Owner occupied343 51.4% Renter occupiedHouse owners and renters - Hispanic or Latino residents 6,593 54.7% Owner occupied5,470 45.3% Renter occupied
Language usage in Kendall West
English speakers - Total 8.4% of residents of Kendall West speak English at home.
87.8% of residents speak Spanish at home 16,159 53.7% Speak English very well13,941 46.3% Speak English less than very well3.5% of residents speak other language at home 795 66.4% Speak English very well402 33.6% Speak English less than very well
English speakers - Born in the United States 37.0% of residents of Kendall West speak English at home.
58.0% of residents speak Spanish at home 859 92.9% Speak English very well66 7.1% Speak English less than very well6.5% of residents speak other language at home 6 5.8% Speak English very well97 94.2% Speak English less than very well
English speakers - Native, born elsewhere 8.2% of residents of Kendall West speak English at home.
87.7% of residents speak Spanish at home 511 71.4% Speak English very well205 28.6% Speak English less than very well
English speakers - Foreign-born 2.9% of residents of Kendall West speak English at home.
92.3% of residents speak Spanish at home 9,397 41.5% Speak English very well13,230 58.5% Speak English less than very well4.3% of residents speak other language at home 727 69.2% Speak English very well323 30.8% Speak English less than very well
White (Caucasian) - Speak only English Native:
29.6% (1,295)Foreign-born:
2.6% (123)
White (Caucasian) - Speak another language Native:
61.5% (2,685)Foreign-born:
94.8% (4,482)
Black or African American - Speak only English Native:
67.8% (182)Foreign-born:
14.3% (42)
Black or African American - Speak another language Native:
32.1% (86)Foreign-born:
84.2% (246)
Asian - Speak only English Native:
61.9% (59)Foreign-born:
9.8% (46)
Asian - Speak another language Native:
38.4% (36)Foreign-born:
92.0% (433)
Other race - Speak only English Native:
5.6% (22)Foreign-born:
7.2% (140)
Other race - Speak another language Native:
94.3% (364)Foreign-born:
92.8% (1,806)
Two or more races - Speak only English Native:
15.4% (800)Foreign-born:
3.1% (568)
Two or more races - Speak another language Native:
84.7% (4,394)Foreign-born:
96.7% (17,695)
White alone - Speak only English Native:
52.0% (747)Foreign-born:
5.8% (21)
White alone - Speak another language Native:
46.5% (668)Foreign-born:
89.2% (330)
Hispanic or Latino - Speak only English Native:
14.3% (1,138)Foreign-born:
2.7% (624)
Hispanic or Latino - Speak another language Native:
85.6% (6,817)Foreign-born:
97.2% (22,572)
Foreign-born residents in Kendall West 24,599 residents are foreign born (66.3% Latin America ).
This city:
69.5%Florida:
21.1%
Marital status for residents in Kendall West Marital status - White (Caucasian) population 15 years and over
Males 39.4% Never married47.0% Now married4.4% Separated2.3% Widowed6.9% DivorcedFemales 35.0% Never married37.4% Now married4.1% Separated8.9% Widowed14.5% DivorcedWomen who gave birth in the past 12 months Now married:
32.3% (22)Unmarried:
67.7% (46)
Women who did not give birth in the past 12 months Now married:
34.3% (804)Unmarried:
65.7% (1,540)
Marital status - Black or African American population 15 years and over
Males 37.0% Never married62.6% Now married0.4% Separated0.0% Widowed0.0% DivorcedFemales 27.2% Never married30.8% Now married8.3% Separated7.6% Widowed26.1% DivorcedWomen who gave birth in the past 12 months Now married:
0.0% (0)Unmarried:
100.0% (3)
Women who did not give birth in the past 12 months Now married:
64.0% (66)Unmarried:
36.0% (37)
Marital status - Asian population 15 years and over
Males 20.6% Never married13.4% Now married0.0% Separated1.8% Widowed64.2% DivorcedFemales 29.8% Never married64.9% Now married0.0% Separated0.0% Widowed5.3% DivorcedWomen who did not give birth in the past 12 months Now married:
0.0% (0)Unmarried:
100.0% (18)
Marital status - Other race population 15 years and over
Males 27.3% Never married49.2% Now married10.1% Separated2.4% Widowed11.0% DivorcedFemales 18.3% Never married48.0% Now married2.9% Separated19.2% Widowed11.5% DivorcedWomen who did not give birth in the past 12 months Now married:
41.1% (219)Unmarried:
58.9% (314)
Marital status - Two or more races population 15 years and over
Males 32.1% Never married60.6% Now married0.8% Separated0.8% Widowed5.7% DivorcedFemales 27.9% Never married43.3% Now married2.4% Separated13.3% Widowed13.1% DivorcedWomen who gave birth in the past 12 months Now married:
59.1% (62)Unmarried:
40.9% (43)
Women who did not give birth in the past 12 months Now married:
41.3% (2,514)Unmarried:
58.7% (3,579)
Marital status - White alone, not Hispanic / Latino population 15 years and over
Males 64.4% Never married29.9% Now married0.0% Separated0.0% Widowed5.7% DivorcedFemales 32.1% Never married38.2% Now married2.8% Separated18.2% Widowed8.7% DivorcedWomen who gave birth in the past 12 months Now married:
0.0% (0)Unmarried:
100.0% (36)
Women who did not give birth in the past 12 months Now married:
30.3% (76)Unmarried:
69.7% (175)
Marital status - Hispanic or Latino population 15 years and over
Males 33.8% Never married54.4% Now married3.4% Separated1.8% Widowed6.7% DivorcedFemales 31.1% Never married40.4% Now married3.5% Separated11.2% Widowed13.9% DivorcedWomen who gave birth in the past 12 months Now married:
50.6% (77)Unmarried:
49.4% (75)
Women who did not give birth in the past 12 months Now married:
37.9% (3,042)Unmarried:
62.1% (4,987)
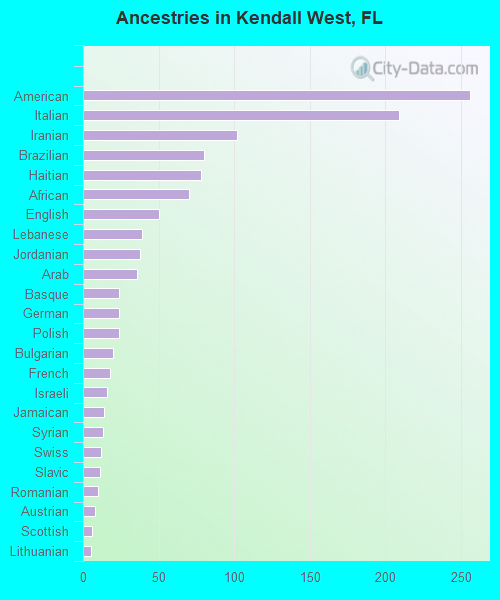
Ancestries in Kendall West
256 1.0% American209 0.8% Italian102 0.4% Iranian80 0.3% Brazilian78 0.3% Haitian70 0.3% African50 0.2% English39 0.1% Lebanese38 0.1% Jordanian36 0.1% Arab24 0.09% Basque24 0.09% German24 0.09% Polish20 0.07% Bulgarian18 0.07% French16 0.06% Israeli14 0.05% Jamaican13 0.05% Syrian12 0.04% Swiss11 0.04% Slavic10 0.04% Romanian8 0.03% Austrian6 0.02% Scottish5 0.02% Lithuanian2 0.01% French Canadian
Geographical mobility in Kendall West Same house 1 year ago 9,069 89.8% White (Caucasian)527 93.6% Black or African American13 100.0% American Indian / Alaska Native593 100.0% Asian1,970 82.8% Other race22,662 93.6% Two or more races1,643 83.4% White alone, not Hispanic / Latino29,728 92.5% Hispanic or LatinoMoved within same county 702 7.0% White / Caucasian26 4.6% Black or African American288 12.1% Other race1,134 4.7% Two or more races288 14.6% White alone, not Hispanic / Latino1,701 5.3% Hispanic or LatinoMoved within same state 15 0.2% White / Caucasian2 0.3% Black or African American4 0.0% Two or more races9 0.5% White alone, not Hispanic / Latino13 0.0% Hispanic or LatinoMoved from different state 16 0.2% White / Caucasian1 0.2% Black or African American14 0.1% Two or more races7 0.4% White alone, not Hispanic / Latino23 0.1% Hispanic or LatinoMoved from abroad 107 1.1% White89 3.8% Other race275 1.1% Two or more races9 0.5% White alone, not Hispanic / Latino522 1.6% Hispanic or Latino
Children Nativity (place of birth) in Kendall West
Children under 6 years - Living with two parents Both parents native 163 100.0% NativeBoth parents foreign-born 391 89.9% Native44 10.1% Foreign-bornOne native, one foreign-born parent 108 100.0% NativeChildren under 6 years - Living with one parent Native parent 186 98.8% Native2 1.2% Foreign-bornForeign-born parent 405 89.2% Native49 10.8% Foreign-bornChildren 6 to 17 years - Living with two parents Both parents native 382 97.6% Native9 2.4% Foreign-bornBoth parents foreign-born 965 52.6% Native870 47.4% Foreign-bornOne native, one foreign-born parent 123 80.0% Native31 20.0% Foreign-bornChildren 6 to 17 years - Living with one parent Native parent 96 100.0% NativeForeign-born parent 1,197 56.6% Native918 43.4% Foreign-born
Place of birth for residents in Kendall West 23,686 Americas23,584 Latin America14,737 Caribbean6,100 South America2,745 Central America727 Asia310 Eastern Asia310 China176 Europe166 South Central Asia144 Western Asia107 Southern Europe104 South Eastern Asia101 Northern America37 Eastern Europe20 Western Europe9 Northern Europe8 Africa8 Northern Africa14,178 Cuba2,337 Colombia1,630 Nicaragua1,512 Venezuela1,142 Peru448 Mexico372 Dominican Republic346 El Salvador310 China257 Uruguay227 Argentina214 Chile179 Bolivia164 Honduras121 Brazil105 Ecuador102 Haiti101 Canada95 Philippines82 Spain81 Panama76 Iran63 Pakistan57 Jordan51 Saudi Arabia46 Dominica46 Costa Rica29 Jamaica25 Guatemala25 India24 Italy18 Bulgaria12 Syria12 Lebanon9 England9 Romania8 Egypt8 Israel8 Vietnam7 Austria6 Switzerland6 Trinidad and Tobago5 Belgium5 Lithuania2 Poland
Grandparents responsible for own grandchildren in Kendall West
Grandparents (30 to 59 years) White / Caucasian 19 29.0% Responsible for grandchildren47 71.0% Not responsible for grandchildrenTwo or more races 12 9.0% Responsible for grandchildren119 91.0% Not responsible for grandchildrenHispanic or Latino 39 22.3% Responsible for grandchildren136 77.7% Not responsible for grandchildrenGrandparents (60 years and over) White / Caucasian 11 3.7% Responsible for grandchildren294 96.3% Not responsible for grandchildrenTwo or more races 32 8.7% Responsible for grandchildren332 91.3% Not responsible for grandchildrenHispanic or Latino 47 6.4% Responsible for grandchildren676 93.6% Not responsible for grandchildren