Races in Kemp Mill, Maryland (MD) Detailed Stats
Data:
Races - White alone (%)
Races - White alone (% change since 2000)
Races - Black alone (%)
Races - Black alone (% change since 2000)
Races - American Indian alone (%)
Races - American Indian alone (% change since 2000)
Races - Asian alone (%)
Races - Asian alone (% change since 2000)
Races - Hispanic (%)
Races - Hispanic (% change since 2000)
Races - Native Hawaiian and Other Pacific Islander alone (%)
Races - Native Hawaiian and Other Pacific Islander alone (% change since 2000)
Races - Two or more races(%)
Races - Two or more races(% change since 2000)
Races - Other race alone (%)
Races - Other race alone (% change since 2000)
Racial diversity
Place of birth - Born in state of residence (%)
Place of birth - Born in state of residence (%) - White
Place of birth - Born in state of residence (%) - Black or African American
Place of birth - Born in state of residence (%) - Asian
Place of birth - Born in state of residence (%) - Hispanic or Latino
Place of birth - Born in state of residence (%) - American Indian and Alaska Native
Place of birth - Born in state of residence (%) - Multirace
Place of birth - Born in state of residence (%) - Other Race
Place of birth - Born in other state (%)
Place of birth - Born in other state (%) - White
Place of birth - Born in other state (%) - Black or African American
Place of birth - Born in other state (%) - Asian
Place of birth - Born in other state (%) - Hispanic or Latino
Place of birth - Born in other state (%) - American Indian and Alaska Native
Place of birth - Born in other state (%) - Multirace
Place of birth - Born in other state (%) - Other Race
Place of birth - Native, outside of US (%)
Place of birth - Native, outside of US (%) - White
Place of birth - Native, outside of US (%) - Black or African American
Place of birth - Native, outside of US (%) - Asian
Place of birth - Native, outside of US (%) - Hispanic or Latino
Place of birth - Native, outside of US (%) - American Indian and Alaska Native
Place of birth - Native, outside of US (%) - Multirace
Place of birth - Native, outside of US (%) - Other Race
Place of birth - Foreign born (%)
Place of birth - Foreign born (%) - White
Place of birth - Foreign born (%) - Black or African American
Place of birth - Foreign born (%) - Asian
Place of birth - Foreign born (%) - Hispanic or Latino
Place of birth - Foreign born (%) - American Indian and Alaska Native
Place of birth - Foreign born (%) - Multirace
Place of birth - Foreign born (%) - Other Race
Residents speaking English at home (%)
Residents speaking English at home - Born in the United States (%)
Residents speaking English at home - Native, born elsewhere (%)
Residents speaking English at home - Foreign born (%)
Residents speaking Spanish at home (%)
Residents speaking Spanish at home - Born in the United States (%)
Residents speaking Spanish at home - Native, born elsewhere (%)
Residents speaking Spanish at home - Foreign born (%)
Residents speaking other language at home (%)
Residents speaking other language at home - Born in the United States (%)
Residents speaking other language at home - Native, born elsewhere (%)
Residents speaking other language at home - Foreign born (%)
Marital status - Never married (%)
Marital status - Now married (%)
Marital status - Separated (%)
Marital status - Widowed (%)
Marital status - Divorced (%)
Ancestries Reported - Arab (%)
Ancestries Reported - Czech (%)
Ancestries Reported - Danish (%)
Ancestries Reported - Dutch (%)
Ancestries Reported - English (%)
Ancestries Reported - French (%)
Ancestries Reported - French Canadian (%)
Ancestries Reported - German (%)
Ancestries Reported - Greek (%)
Ancestries Reported - Hungarian (%)
Ancestries Reported - Irish (%)
Ancestries Reported - Italian (%)
Ancestries Reported - Lithuanian (%)
Ancestries Reported - Norwegian (%)
Ancestries Reported - Polish (%)
Ancestries Reported - Portuguese (%)
Ancestries Reported - Russian (%)
Ancestries Reported - Scotch-Irish (%)
Ancestries Reported - Scottish (%)
Ancestries Reported - Slovak (%)
Ancestries Reported - Subsaharan African (%)
Ancestries Reported - Swedish (%)
Ancestries Reported - Swiss (%)
Ancestries Reported - Ukrainian (%)
Ancestries Reported - United States (%)
Ancestries Reported - Welsh (%)
Ancestries Reported - West Indian (%)
Ancestries Reported - Other (%)
Geographical mobility - Same house 1 year ago (%)
Geographical mobility - Same house 1 year ago (%) - White
Geographical mobility - Same house 1 year ago (%) - Black or African American
Geographical mobility - Same house 1 year ago (%) - Asian
Geographical mobility - Same house 1 year ago (%) - Hispanic or Latino
Geographical mobility - Same house 1 year ago (%) - American Indian and Alaska Native
Geographical mobility - Same house 1 year ago (%) - Multirace
Geographical mobility - Same house 1 year ago (%) - Other Race
Geographical mobility - Moved within same county (%)
Geographical mobility - Moved within same county (%) - White
Geographical mobility - Moved within same county (%) - Black or African American
Geographical mobility - Moved within same county (%) - Asian
Geographical mobility - Moved within same county (%) - Hispanic or Latino
Geographical mobility - Moved within same county (%) - American Indian and Alaska Native
Geographical mobility - Moved within same county (%) - Multirace
Geographical mobility - Moved within same county (%) - Other Race
Geographical mobility - Moved from different county within same state (%)
Geographical mobility - Moved from different county within same state (%) - White
Geographical mobility - Moved from different county within same state (%) - Black or African American
Geographical mobility - Moved from different county within same state (%) - Asian
Geographical mobility - Moved from different county within same state (%) - Hispanic or Latino
Geographical mobility - Moved from different county within same state (%) - American Indian and Alaska Native
Geographical mobility - Moved from different county within same state (%) - Multirace
Geographical mobility - Moved from different county within same state (%) - Other Race
Geographical mobility - Moved from different state (%)
Geographical mobility - Moved from different state (%) - White
Geographical mobility - Moved from different state (%) - Black or African American
Geographical mobility - Moved from different state (%) - Asian
Geographical mobility - Moved from different state (%) - Hispanic or Latino
Geographical mobility - Moved from different state (%) - American Indian and Alaska Native
Geographical mobility - Moved from different state (%) - Multirace
Geographical mobility - Moved from different state (%) - Other Race
Geographical mobility - Moved from abroad (%)
Geographical mobility - Moved from abroad (%) - White
Geographical mobility - Moved from abroad (%) - Black or African American
Geographical mobility - Moved from abroad (%) - Asian
Geographical mobility - Moved from abroad (%) - Hispanic or Latino
Geographical mobility - Moved from abroad (%) - American Indian and Alaska Native
Geographical mobility - Moved from abroad (%) - Multirace
Geographical mobility - Moved from abroad (%) - Other Race
Place of birth for the foreign-born population - Ireland (%)
Place of birth for the foreign-born population - Denmark (%)
Place of birth for the foreign-born population - Norway (%)
Place of birth for the foreign-born population - Sweden (%)
Place of birth for the foreign-born population - United Kingdom (%)
Place of birth for the foreign-born population - England (%)
Place of birth for the foreign-born population - Scotland (%)
Place of birth for the foreign-born population - Other Northern Europe (%)
Place of birth for the foreign-born population - Austria (%)
Place of birth for the foreign-born population - Belgium (%)
Place of birth for the foreign-born population - France (%)
Place of birth for the foreign-born population - Germany (%)
Place of birth for the foreign-born population - Netherlands (%)
Place of birth for the foreign-born population - Switzerland (%)
Place of birth for the foreign-born population - Other Western Europe (%)
Place of birth for the foreign-born population - Greece (%)
Place of birth for the foreign-born population - Italy (%)
Place of birth for the foreign-born population - Portugal (%)
Place of birth for the foreign-born population - Spain (%)
Place of birth for the foreign-born population - Other Southern Europe (%)
Place of birth for the foreign-born population - Albania (%)
Place of birth for the foreign-born population - Belarus (%)
Place of birth for the foreign-born population - Bosnia and Herzegovina (%)
Place of birth for the foreign-born population - Bulgaria (%)
Place of birth for the foreign-born population - Croatia (%)
Place of birth for the foreign-born population - Czechoslovakia (%)
Place of birth for the foreign-born population - Hungary (%)
Place of birth for the foreign-born population - Latvia (%)
Place of birth for the foreign-born population - Lithuania (%)
Place of birth for the foreign-born population - North Macedonia (Macedonia) (%)
Place of birth for the foreign-born population - Moldova (%)
Place of birth for the foreign-born population - Poland (%)
Place of birth for the foreign-born population - Romania (%)
Place of birth for the foreign-born population - Russia (%)
Place of birth for the foreign-born population - Serbia (%)
Place of birth for the foreign-born population - Ukraine (%)
Place of birth for the foreign-born population - Other Eastern Europe (%)
Place of birth for the foreign-born population - China (%)
Place of birth for the foreign-born population - Hong Kong (%)
Place of birth for the foreign-born population - Taiwan (%)
Place of birth for the foreign-born population - Japan (%)
Place of birth for the foreign-born population - Korea (%)
Place of birth for the foreign-born population - Other Eastern Asia (%)
Place of birth for the foreign-born population - Afghanistan (%)
Place of birth for the foreign-born population - Bangladesh (%)
Place of birth for the foreign-born population - India (%)
Place of birth for the foreign-born population - Iran (%)
Place of birth for the foreign-born population - Kazakhstan (%)
Place of birth for the foreign-born population - Nepal (%)
Place of birth for the foreign-born population - Pakistan (%)
Place of birth for the foreign-born population - Sri Lanka (%)
Place of birth for the foreign-born population - Uzbekistan (%)
Place of birth for the foreign-born population - Other South Central Asia (%)
Place of birth for the foreign-born population - Burma (%)
Place of birth for the foreign-born population - Cambodia (%)
Place of birth for the foreign-born population - Indonesia (%)
Place of birth for the foreign-born population - Laos (%)
Place of birth for the foreign-born population - Malaysia (%)
Place of birth for the foreign-born population - Philippines (%)
Place of birth for the foreign-born population - Singapore (%)
Place of birth for the foreign-born population - Thailand (%)
Place of birth for the foreign-born population - Vietnam (%)
Place of birth for the foreign-born population - Other South Eastern Asia (%)
Place of birth for the foreign-born population - Armenia (%)
Place of birth for the foreign-born population - Iraq (%)
Place of birth for the foreign-born population - Israel (%)
Place of birth for the foreign-born population - Jordan (%)
Place of birth for the foreign-born population - Kuwait (%)
Place of birth for the foreign-born population - Lebanon (%)
Place of birth for the foreign-born population - Saudi Arabia (%)
Place of birth for the foreign-born population - Syria (%)
Place of birth for the foreign-born population - Turkey (%)
Place of birth for the foreign-born population - Yemen (%)
Place of birth for the foreign-born population - Other Western Asia (%)
Place of birth for the foreign-born population - Eritrea (%)
Place of birth for the foreign-born population - Ethiopia (%)
Place of birth for the foreign-born population - Kenya (%)
Place of birth for the foreign-born population - Somalia (%)
Place of birth for the foreign-born population - Uganda (%)
Place of birth for the foreign-born population - Zimbabwe (%)
Place of birth for the foreign-born population - Other Eastern Africa (%)
Place of birth for the foreign-born population - Cameroon (%)
Place of birth for the foreign-born population - Congo (%)
Place of birth for the foreign-born population - Democratic Republic of Congo (Zaire) (%)
Place of birth for the foreign-born population - Other Middle Africa (%)
Place of birth for the foreign-born population - Egypt (%)
Place of birth for the foreign-born population - Morocco (%)
Place of birth for the foreign-born population - Sudan (%)
Place of birth for the foreign-born population - Other Northern Africa (%)
Place of birth for the foreign-born population - South Africa (%)
Place of birth for the foreign-born population - Other Southern Africa (%)
Place of birth for the foreign-born population - Cabo Verde (%)
Place of birth for the foreign-born population - Ghana (%)
Place of birth for the foreign-born population - Liberia (%)
Place of birth for the foreign-born population - Nigeria (%)
Place of birth for the foreign-born population - Senegal (%)
Place of birth for the foreign-born population - Sierra Leone (%)
Place of birth for the foreign-born population - Other Western Africa (%)
Place of birth for the foreign-born population - Australia (%)
Place of birth for the foreign-born population - New Zealand (%)
Place of birth for the foreign-born population - Fiji (%)
Place of birth for the foreign-born population - Micronesia (%)
Place of birth for the foreign-born population - Bahamas (%)
Place of birth for the foreign-born population - Barbados (%)
Place of birth for the foreign-born population - Cuba (%)
Place of birth for the foreign-born population - Dominica (%)
Place of birth for the foreign-born population - Dominican Republic (%)
Place of birth for the foreign-born population - Grenada (%)
Place of birth for the foreign-born population - Haiti (%)
Place of birth for the foreign-born population - Jamaica (%)
Place of birth for the foreign-born population - St. Vincent and the Grenadines (%)
Place of birth for the foreign-born population - Trinidad and Tobago (%)
Place of birth for the foreign-born population - West Indies (%)
Place of birth for the foreign-born population - Other Caribbean (%)
Place of birth for the foreign-born population - Belize (%)
Place of birth for the foreign-born population - Costa Rica (%)
Place of birth for the foreign-born population - El Salvador (%)
Place of birth for the foreign-born population - Guatemala (%)
Place of birth for the foreign-born population - Honduras (%)
Place of birth for the foreign-born population - Mexico (%)
Place of birth for the foreign-born population - Nicaragua (%)
Place of birth for the foreign-born population - Panama (%)
Place of birth for the foreign-born population - Other Central America (%)
Place of birth for the foreign-born population - Argentina (%)
Place of birth for the foreign-born population - Bolivia (%)
Place of birth for the foreign-born population - Brazil (%)
Place of birth for the foreign-born population - Chile (%)
Place of birth for the foreign-born population - Colombia (%)
Place of birth for the foreign-born population - Ecuador (%)
Place of birth for the foreign-born population - Guyana (%)
Place of birth for the foreign-born population - Peru (%)
Place of birth for the foreign-born population - Uruguay (%)
Place of birth for the foreign-born population - Venezuela (%)
Place of birth for the foreign-born population - Other South America (%)
Place of birth for the foreign-born population - Canada (%)
Place of birth for the foreign-born population - Other Northern America (%)
Place of birth for the foreign-born population - Other (%)
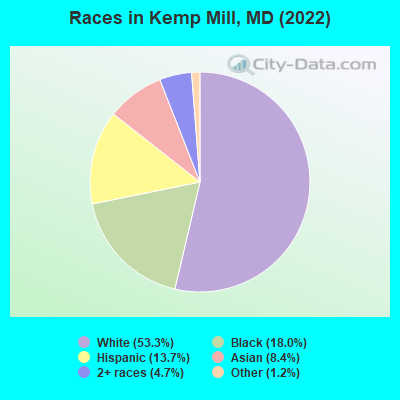
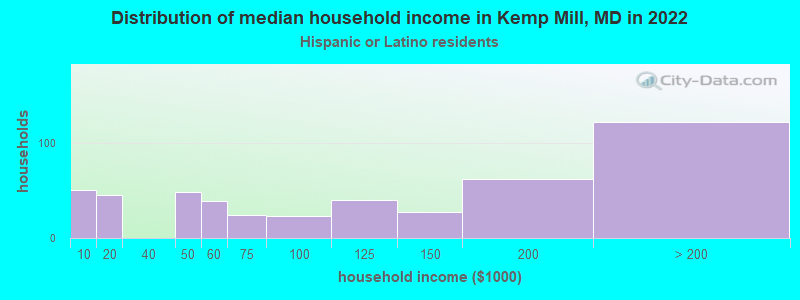
According to 2022 data, the most numerous races in Kemp Mill, MD are White alone (7,488 residents), Black alone (2,527 residents), and Hispanic (1,924 residents). 63.7% of Kemp Mill residents speak English at home. 28.3% of Kemp Mill, MD residents are foreign-born (9.3% born in Africa, 7.9% born in Latin America, 6.6% born in Asia), which is 43.5% greater than the foreign-born rate of 16.0% across the entire state of Maryland.
Race distribution in Kemp Mill
2000 2022
3,286,547 62.1% White alone 1,464,735 27.7% Black alone 227,916 4.3% Hispanic 209,738 4.0% Asian alone 82,946 1.6% Two or more races 13,312 0.3% American Indian alone 9,379 0.2% Other race alone 1,913 0.04% Native Hawaiian and Other
2,906,492 47.1% White alone 1,800,914 29.2% Black alone 705,842 11.4% Hispanic 401,818 6.5% Asian alone 291,317 4.7% Two or more races 46,930 0.8% Other race alone 8,930 0.1% American Indian alone 2,417 0.04% Native Hawaiian and Other
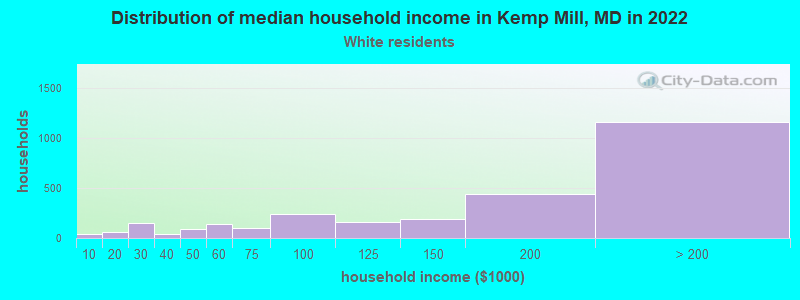
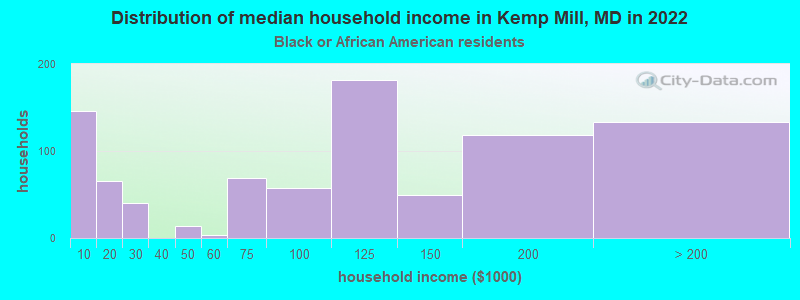
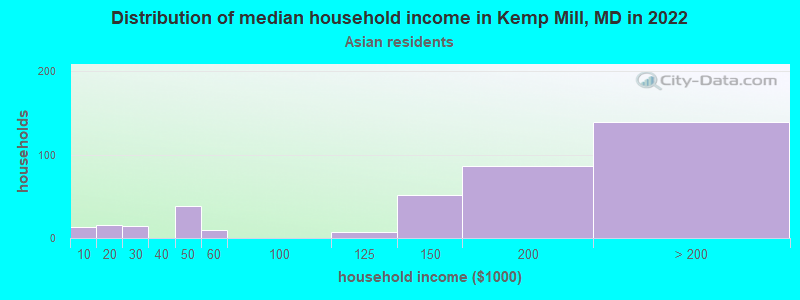
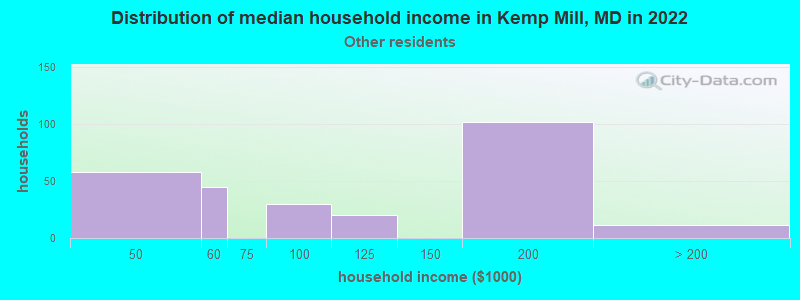
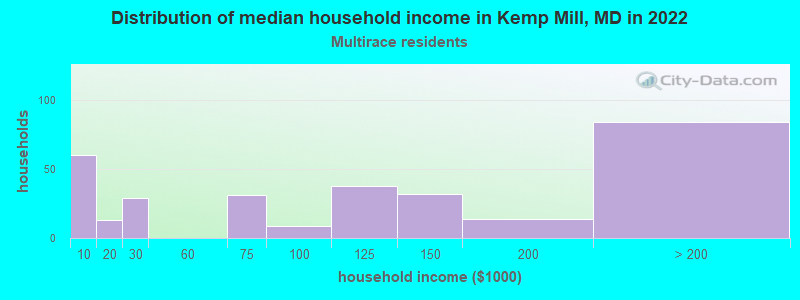
Income and house value in Kemp Mill Median household income in 2022 $163,644 White non-Hispanic householders$99,750 Black householders$176,123 Asian householders$96,868 Two or more races householders$100,097 Hispanic or Latino race householdersMedian 2022 house value $546,568 White Non-Hispanic householders$539,892 Black or African American householders $489,966 Asian householders$456,586 Some other race householders$504,479 Two or more races householders$493,159 Hispanic or Latino householders
Median age by race in Kemp Mill
41.3 Median age for White residents39.1 42.9 42.5 Median age for Black or African American residents41.1 45.7 62.2 Median age for American Indian / Alaska Native residents43.8 75.0 42.3 Median age for Asian residents40.3 46.2 -763,333,332.6 Median age for Native Hawaiian / Pacific Islander residents-720,061,021.4 -760,942,760.2 39.8 Median age for Other race residents41.1 30.8 30.2 Median age for Two or more races residents29.8 31.9 41.3 Median age for White alone residents39.3 42.4 38.3 Median age for Hispanic or Latino residents40.4 36.4
Owner/renter occupied households by race in Kemp Mill
House owners and renters - White residents 2,569 90.1% Owner occupied281 9.9% Renter occupiedHouse owners and renters - Black or African American residents 529 59.8% Owner occupied355 40.2% Renter occupiedHouse owners and renters - American Indian / Alaska Native residents 65 100.0% Owner occupiedHouse owners and renters - Asian residents 368 93.5% Owner occupied26 6.5% Renter occupiedHouse owners and renters - Other race residents 214 82.1% Owner occupied47 17.9% Renter occupiedHouse owners and renters - Two or more races residents 248 79.9% Owner occupied62 20.1% Renter occupiedHouse owners and renters - White alone residents 2,599 90.4% Owner occupied276 9.6% Renter occupiedHouse owners and renters - Hispanic or Latino residents 400 86.4% Owner occupied63 13.6% Renter occupied
Language usage in Kemp Mill
English speakers - Total 63.7% of residents of Kemp Mill speak English at home.
12.2% of residents speak Spanish at home 1,077 67.0% Speak English very well531 33.0% Speak English less than very well23.7% of residents speak other language at home 2,335 74.6% Speak English very well794 25.4% Speak English less than very well
English speakers - Born in the United States 90.7% of residents of Kemp Mill speak English at home.
4.9% of residents speak Spanish at home 284 100.0% Speak English very well4.7% of residents speak other language at home 264 98.9% Speak English very well3 1.1% Speak English less than very well
English speakers - Native, born elsewhere 70.6% of residents of Kemp Mill speak English at home.
21.2% of residents speak Spanish at home 87 100.0% Speak English very well2.9% of residents speak other language at home 12 100.0% Speak English very well
English speakers - Foreign-born 16.1% of residents of Kemp Mill speak English at home.
27.2% of residents speak Spanish at home 520 48.7% Speak English very well548 51.3% Speak English less than very well56.0% of residents speak other language at home 1,444 65.7% Speak English very well753 34.3% Speak English less than very well
White (Caucasian) - Speak only English Native:
94.1% (5,942)Foreign-born:
30.4% (257)
White (Caucasian) - Speak another language Native:
6.3% (397)Foreign-born:
71.6% (605)
Black or African American - Speak only English Native:
72.1% (822)Foreign-born:
14.5% (193)
Black or African American - Speak another language Native:
29.4% (336)Foreign-born:
87.2% (1,163)
American Indian / Alaska Native - Speak another language Native:
100.0% (48)Foreign-born:
100.0% (192)
Asian - Speak only English Native:
37.7% (137)Foreign-born:
15.7% (108)
Asian - Speak another language Native:
64.1% (232)Foreign-born:
84.5% (583)
Other race - Speak only English Native:
57.2% (153)Foreign-born:
10.3% (50)
Other race - Speak another language Native:
51.4% (137)Foreign-born:
88.6% (434)
Two or more races - Speak another language Native:
26.0% (263)Foreign-born:
99.0% (275)
White alone - Speak only English Native:
93.9% (5,933)Foreign-born:
35.8% (260)
White alone - Speak another language Native:
6.1% (386)Foreign-born:
62.9% (456)
Hispanic or Latino - Speak only English Native:
31.5% (199)Foreign-born:
0.9% (10)
Hispanic or Latino - Speak another language Native:
68.5% (432)Foreign-born:
99.4% (1,091)
Foreign-born residents in Kemp Mill 3,974 residents are foreign born (9.3% Africa , 7.9% Latin America , 6.6% Asia ).
This city:
28.3%Maryland:
15.7%
Marital status for residents in Kemp Mill Marital status - White (Caucasian) population 15 years and over
Males 25.0% Never married65.8% Now married0.0% Separated4.2% Widowed4.9% DivorcedFemales 22.7% Never married58.0% Now married0.2% Separated6.7% Widowed12.3% DivorcedWomen who gave birth in the past 12 months Now married:
100.0% (102)Unmarried:
0.0% (0)
Women who did not give birth in the past 12 months Now married:
55.1% (811)Unmarried:
44.9% (661)
Marital status - Black or African American population 15 years and over
Males 44.8% Never married35.6% Now married0.0% Separated1.6% Widowed18.0% DivorcedFemales 28.9% Never married38.0% Now married3.9% Separated14.3% Widowed14.9% DivorcedWomen who did not give birth in the past 12 months Now married:
46.8% (199)Unmarried:
53.2% (226)
Marital status - American Indian / Alaska Native population 15 years and over
Males 16.5% Never married41.7% Now married0.0% Separated0.0% Widowed41.7% DivorcedFemales 0.0% Never married86.7% Now married0.0% Separated2.2% Widowed11.1% DivorcedMarital status - Asian population 15 years and over
Males 13.2% Never married73.4% Now married5.7% Separated2.2% Widowed5.5% DivorcedFemales 15.9% Never married74.0% Now married2.2% Separated0.0% Widowed7.8% DivorcedWomen who did not give birth in the past 12 months Now married:
66.1% (158)Unmarried:
33.9% (81)
Marital status - Other race population 15 years and over
Males 42.2% Never married46.9% Now married10.9% Separated0.0% Widowed0.0% DivorcedFemales 22.7% Never married68.6% Now married0.0% Separated8.7% Widowed0.0% DivorcedWomen who did not give birth in the past 12 months Now married:
42.4% (31)Unmarried:
57.6% (42)
Marital status - Two or more races population 15 years and over
Males 44.0% Never married40.6% Now married0.0% Separated2.5% Widowed12.9% DivorcedFemales 49.3% Never married35.1% Now married0.0% Separated0.0% Widowed15.6% DivorcedWomen who gave birth in the past 12 months Now married:
0.0% (0)Unmarried:
100.0% (44)
Women who did not give birth in the past 12 months Now married:
42.0% (138)Unmarried:
58.0% (190)
Marital status - White alone, not Hispanic / Latino population 15 years and over
Males 23.9% Never married66.1% Now married0.0% Separated4.6% Widowed5.4% DivorcedFemales 22.0% Never married58.6% Now married0.3% Separated7.1% Widowed12.1% DivorcedWomen who gave birth in the past 12 months Now married:
100.0% (112)Unmarried:
0.0% (0)
Women who did not give birth in the past 12 months Now married:
55.2% (796)Unmarried:
44.8% (647)
Marital status - Hispanic or Latino population 15 years and over
Males 40.9% Never married50.2% Now married0.0% Separated1.0% Widowed7.9% DivorcedFemales 28.5% Never married59.4% Now married0.0% Separated2.9% Widowed9.2% DivorcedWomen who gave birth in the past 12 months Now married:
0.0% (0)Unmarried:
100.0% (38)
Women who did not give birth in the past 12 months Now married:
57.9% (208)Unmarried:
42.1% (152)
Ancestries in Kemp Mill
1,350 16.7% Ethiopian412 5.1% American396 4.9% Eastern European289 3.6% European273 3.4% Irish202 2.5% German146 1.8% African143 1.8% Polish105 1.3% English102 1.3% Ghanaian76 0.9% Russian47 0.6% Italian47 0.6% Scottish42 0.5% British41 0.5% Jamaican38 0.5% Portuguese36 0.4% Romanian36 0.4% Austrian32 0.4% Latvian29 0.4% Czechoslovakian27 0.3% Ukrainian23 0.3% Iranian22 0.3% Dutch21 0.3% Greek20 0.2% Kenyan19 0.2% Syrian16 0.2% Haitian13 0.2% Scotch-Irish12 0.1% Arab12 0.1% Swiss10 0.1% French9 0.1% Scandinavian8 0.10% Iraqi8 0.10% Lithuanian7 0.09% Hungarian7 0.09% Turkish5 0.06% French Canadian4 0.05% Moroccan3 0.04% Norwegian3 0.04% Israeli3 0.04% West Indian2 0.02% Belgian2 0.02% Croatian
Geographical mobility in Kemp Mill Same house 1 year ago 7,125 95.1% White (Caucasian)2,076 81.7% Black or African American254 98.9% American Indian / Alaska Native1,076 91.8% Asian765 100.0% Other race1,218 87.6% Two or more races7,072 95.2% White alone, not Hispanic / Latino1,709 93.1% Hispanic or LatinoMoved within same county 200 2.7% White / Caucasian127 5.0% Black or African American68 5.8% Asian60 4.3% Two or more races219 2.9% White alone, not Hispanic / Latino12 0.7% Hispanic or LatinoMoved within same state 41 0.6% White / Caucasian97 3.8% Black or African American14 0.2% White alone, not Hispanic / Latino42 2.3% Hispanic or LatinoMoved from different state 154 2.1% White / Caucasian29 1.1% Black or African American14 1.2% Asian162 2.2% White alone, not Hispanic / LatinoMoved from abroad 29 0.4% White407 16.0% Black or African American193 13.9% Two or more races25 0.3% White alone, not Hispanic / Latino92 5.0% Hispanic or Latino
Children Nativity (place of birth) in Kemp Mill
Children under 6 years - Living with two parents Both parents native 437 100.0% NativeBoth parents foreign-born 208 81.2% Native48 18.8% Foreign-bornOne native, one foreign-born parent 124 100.0% NativeChildren under 6 years - Living with one parent Native parent 21 86.1% Native3 13.9% Foreign-bornForeign-born parent 122 100.0% NativeChildren 6 to 17 years - Living with two parents Both parents native 1,396 100.0% Native0 0.0% Foreign-bornBoth parents foreign-born 359 78.8% Native97 21.2% Foreign-bornOne native, one foreign-born parent 135 100.0% NativeChildren 6 to 17 years - Living with one parent Native parent 125 100.0% NativeForeign-born parent 233 54.2% Native197 45.8% Foreign-born
Grandparents responsible for own grandchildren in Kemp Mill
Grandparents (30 to 59 years) White / Caucasian 9 100.0% Responsible for grandchildrenAsian 6 100.0% Not responsible for grandchildrenOther race 23 100.0% Not responsible for grandchildrenTwo or more races 11 100.0% Responsible for grandchildrenWhite alone, not Hispanic / Latino 6 100.0% Responsible for grandchildrenHispanic or Latino 31 60.5% Responsible for grandchildren20 39.5% Not responsible for grandchildrenGrandparents (60 years and over) White / Caucasian 8 13.5% Responsible for grandchildren50 86.5% Not responsible for grandchildrenAsian 10 100.0% Not responsible for grandchildrenOther race 5 5.6% Responsible for grandchildren78 94.4% Not responsible for grandchildrenWhite alone, not Hispanic / Latino 13 100.0% Not responsible for grandchildrenHispanic or Latino 20 18.1% Responsible for grandchildren93 81.9% Not responsible for grandchildren