Races in Kalispell, Montana (MT) Detailed Stats
Ancestries, Foreign-born residents, place of birth
Settings
X


Recent posts about races in Kalispell, Montana on our local forum with over 2,400,000 registered users:
 | Advice Please - Moving to Kalispell-Evergreen-Whitefish Area (18 replies) |
| Montana has a high violent crime rate, why is that? (77 replies) |
| Interesting read for those who want to move to Montana (47 replies) |
| Kalispell and surrounding areas (20 replies) |
| Why are so many people moving to Montana? (77 replies) |
| Kalispell, Helena, and Marion (48 replies) |
Latest news about races in Kalispell, MT collected exclusively by city-data.com from local newspapers, TV, and radio stations
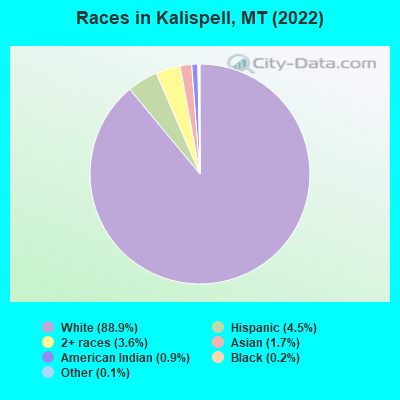
According to 2022 data, the most numerous races in Kalispell, MT are White alone (23,889 residents), American Indian alone (244 residents), and Two or more races (980 residents). 95.1% of Kalispell residents speak English at home. 3.1% of Kalispell, MT residents are foreign-born (1.2% born in Asia, 0.6% born in Latin America, 0.6% born in Africa, 0.5% born in Europe), which is 36.2% greater than the foreign-born rate of 2.0% across the entire state of Montana.
Race distribution in Kalispell
2000
2022

- 13,50494.9%White alone
- 2201.5%Hispanic
- 2001.4%Two or more races
- 1661.2%American Indian alone
- 790.6%Asian alone
- 390.3%Black alone
- 90.06%Other race alone
- 60.04%Native Hawaiian and Other
Pacific Islander alone

-
- 23,88988.9%White alone
- 1,2224.5%Hispanic
- 9803.6%Two or more races
- 4691.7%Asian alone
- 2440.9%American Indian alone
- 550.2%Black alone
- 310.1%Other race alone
2000
2022
-
- 807,82389.5%White alone
- 54,4266.0%American Indian alone
- 18,0812.0%Hispanic
- 13,7681.5%Two or more races
- 4,5690.5%Asian alone
- 2,5340.3%Black alone
- 5690.06%Other race alone
- 4250.05%Native Hawaiian and Other
Pacific Islander alone

-
- 937,36583.5%White alone
- 58,7485.2%American Indian alone
- 55,1724.9%Two or more races
- 49,8304.4%Hispanic
- 9,0120.8%Other race alone
- 7,7000.7%Asian alone
- 3,4280.3%Black alone
- 1,6120.1%Native Hawaiian and Other
Pacific Islander alone

Income and house value in Kalispell
- Median household income in 2022
- $56,527White non-Hispanic householders
- $53,148Two or more races householders
- $23,188Hispanic or Latino race householders
- Median 2022 house value
- $452,422White Non-Hispanic householders
- $437,772American Indian or Alaska Native householders
- $368,400Asian householders
- $409,334Some other race householders
- $366,246Two or more races householders
- $452,853Hispanic or Latino householders
Household income for White non-Hispanic householders

Household income for Black householders

Household income for American Indian and Alaska Native householders

Household income for Asian householders

Household income for Some other race householders

Household income for Two or more races householders

Household income for Hispanic or Latino race householders

Median age by race in Kalispell
- 35.6Median age for White residents
- 35.0Males
- 37.4Females
- 38.6Median age for Black or African American residents
- 41.8Males
- -728,923,475.3Females
- 29.8Median age for American Indian / Alaska Native residents
- 44.5Males
- 29.4Females
- 39.0Median age for Asian residents
- 36.9Males
- 39.0Females
- -666,666,666.0Median age for Native Hawaiian / Pacific Islander residents
- -666,666,666.0Males
- -666,666,666.0Females
- 21.1Median age for Other race residents
- 34.5Males
- 20.5Females
- 20.8Median age for Two or more races residents
- 27.4Males
- 21.1Females
- 35.8Median age for White alone residents
- 35.2Males
- 37.8Females
- 24.5Median age for Hispanic or Latino residents
- 19.7Males
- 22.5Females
Owner/renter occupied households by race in Kalispell
- House owners and renters - White residents
- 6,10356.4%Owner occupied
- 4,71443.6%Renter occupied
- House owners and renters - Black or African American residents
- 34100.0%Renter occupied
- House owners and renters - American Indian / Alaska Native residents
- 2738.7%Owner occupied
- 4261.3%Renter occupied
- House owners and renters - Asian residents
- 1016.8%Owner occupied
- 4983.2%Renter occupied
- House owners and renters - Other race residents
- 8453.1%Owner occupied
- 7446.9%Renter occupied
- House owners and renters - Two or more races residents
- 16834.5%Owner occupied
- 31865.5%Renter occupied
- House owners and renters - White alone residents
- 6,05856.4%Owner occupied
- 4,68943.6%Renter occupied
- House owners and renters - Hispanic or Latino residents
- 9019.1%Owner occupied
- 38080.9%Renter occupied
Language usage in Kalispell
- English speakers - Total
- 95.1% of residents of Kalispell speak English at home.
- 2.3% of residents speak Spanish at home
- 43174.1%Speak English very well
- 15125.9%Speak English less than very well
- 2.3% of residents speak other language at home
- 45480.1%Speak English very well
- 11319.9%Speak English less than very well
- English speakers - Born in the United States
- 95.8% of residents of Kalispell speak English at home.
- 1.5% of residents speak Spanish at home
- 18295.8%Speak English very well
- 84.2%Speak English less than very well
- 1.8% of residents speak other language at home
- 16674.1%Speak English very well
- 5825.9%Speak English less than very well
- English speakers - Native, born elsewhere
- 90.4% of residents of Kalispell speak English at home.
- 4.1% of residents speak other language at home
- 9100.0%Speak English very well
- English speakers - Foreign-born
- 53.1% of residents of Kalispell speak English at home.
- 19.5% of residents speak Spanish at home
- 12179.1%Speak English very well
- 3220.9%Speak English less than very well
- 27.1% of residents speak other language at home
- 15472.6%Speak English very well
- 5827.4%Speak English less than very well
White (Caucasian) - Speak only English
| Native: | 97.5% (21,518) |
| Foreign-born: | 100.0% (279) |
White (Caucasian) - Speak another language
| Native: | 2.5% (557) |
| Foreign-born: | 10.7% (30) |
Black or African American - Speak only English
| Native: | 100.0% (91) |
| Foreign-born: | 97.4% (1) |
Asian - Speak only English
| Native: | 66.1% (58) |
| Foreign-born: | 6.0% (15) |
Asian - Speak another language
| Native: | 23.1% (20) |
| Foreign-born: | 97.8% (241) |
Other race - Speak only English
| Native: | 99.4% (108) |
| Foreign-born: | 52.8% (86) |
Two or more races - Speak another language
| Native: | 13.1% (208) |
| Foreign-born: | 100.0% (52) |
White alone - Speak only English
| Native: | 97.6% (21,348) |
| Foreign-born: | 100.0% (285) |
White alone - Speak another language
| Native: | 2.4% (535) |
| Foreign-born: | 11.6% (33) |
Hispanic or Latino - Speak only English
| Native: | 82.3% (706) |
| Foreign-born: | 37.6% (91) |
Hispanic or Latino - Speak another language
| Native: | 17.8% (153) |
| Foreign-born: | 61.0% (147) |
Foreign-born residents in Kalispell
843 residents are foreign born (1.2% Asia, 0.6% Latin America, 0.6% Africa, 0.5% Europe).
| This city: | 3.1% |
| Montana: | 2.3% |


Marital status for residents in Kalispell
Marital status - White (Caucasian) population 15 years and over
- Males
- 36.8%Never married
- 44.5%Now married
- 2.9%Separated
- 2.6%Widowed
- 13.2%Divorced
- Females
- 24.7%Never married
- 40.3%Now married
- 4.0%Separated
- 10.3%Widowed
- 20.6%Divorced
Women who gave birth in the past 12 months
| Now married: | 72.6% (252) |
| Unmarried: | 27.4% (95) |
Women who did not give birth in the past 12 months
| Now married: | 44.4% (2,495) |
| Unmarried: | 55.6% (3,126) |
Marital status - Black or African American population 15 years and over
- Males
- 56.9%Never married
- 43.1%Now married
- 0.0%Separated
- 0.0%Widowed
- 0.0%Divorced
- Females
- 0.0%Never married
- 0.0%Now married
- 0.0%Separated
- 0.0%Widowed
- 100.0%Divorced
Women who did not give birth in the past 12 months
| Now married: | 0.0% (0) |
| Unmarried: | 100.0% (13) |
Marital status - American Indian / Alaska Native population 15 years and over
- Males
- 74.0%Never married
- 5.5%Now married
- 0.0%Separated
- 11.0%Widowed
- 9.4%Divorced
- Females
- 46.7%Never married
- 0.0%Now married
- 22.5%Separated
- 11.7%Widowed
- 19.2%Divorced
Women who did not give birth in the past 12 months
| Now married: | 0.0% (0) |
| Unmarried: | 100.0% (67) |
Marital status - Asian population 15 years and over
- Males
- 0.0%Never married
- 100.0%Now married
- 0.0%Separated
- 0.0%Widowed
- 0.0%Divorced
- Females
- 22.1%Never married
- 73.8%Now married
- 0.0%Separated
- 4.2%Widowed
- 0.0%Divorced
Women who did not give birth in the past 12 months
| Now married: | 71.2% (134) |
| Unmarried: | 28.8% (54) |
Marital status - Other race population 15 years and over
- Males
- 51.4%Never married
- 17.6%Now married
- 0.0%Separated
- 12.2%Widowed
- 18.9%Divorced
- Females
- 68.2%Never married
- 9.4%Now married
- 0.0%Separated
- 0.0%Widowed
- 22.4%Divorced
Women who did not give birth in the past 12 months
| Now married: | 9.4% (11) |
| Unmarried: | 90.6% (110) |
Marital status - Two or more races population 15 years and over
- Males
- 28.2%Never married
- 57.7%Now married
- 3.8%Separated
- 1.2%Widowed
- 9.2%Divorced
- Females
- 35.7%Never married
- 44.2%Now married
- 0.0%Separated
- 11.7%Widowed
- 8.5%Divorced
Women who gave birth in the past 12 months
| Now married: | 100.0% (22) |
| Unmarried: | 0.0% (0) |
Women who did not give birth in the past 12 months
| Now married: | 38.4% (105) |
| Unmarried: | 61.6% (169) |
Marital status - White alone, not Hispanic / Latino population 15 years and over
- Males
- 36.6%Never married
- 44.9%Now married
- 2.9%Separated
- 2.5%Widowed
- 13.1%Divorced
- Females
- 24.7%Never married
- 39.9%Now married
- 4.1%Separated
- 10.4%Widowed
- 20.9%Divorced
Women who gave birth in the past 12 months
| Now married: | 72.6% (252) |
| Unmarried: | 27.4% (95) |
Women who did not give birth in the past 12 months
| Now married: | 44.2% (2,448) |
| Unmarried: | 55.8% (3,090) |
Marital status - Hispanic or Latino population 15 years and over
- Males
- 44.1%Never married
- 37.2%Now married
- 4.1%Separated
- 5.6%Widowed
- 9.0%Divorced
- Females
- 33.3%Never married
- 47.7%Now married
- 0.0%Separated
- 8.3%Widowed
- 10.7%Divorced
Women who did not give birth in the past 12 months
| Now married: | 38.3% (87) |
| Unmarried: | 61.7% (140) |
Ancestries in Kalispell

- 2,54823.4%German
- 1,89217.4%English
- 9869.1%American
- 8617.9%Norwegian
- 8407.7%Irish
- 2532.3%Scottish
- 2442.2%Scandinavian
- 2001.8%European
- 1931.8%Italian
- 1531.4%Egyptian
- 1471.4%Swedish
- 1241.1%British
- 970.9%Hungarian
- 830.8%French
- 690.6%Ukrainian
- 580.5%Danish
- 560.5%Czech
- 490.5%Slavic
- 470.4%Polish
- 460.4%Finnish
- 450.4%Scotch-Irish
- 440.4%Canadian
- 330.3%Dutch
- 270.2%Serbian
- 230.2%Belgian
- 200.2%Australian
- 190.2%Croatian
- 110.1%Lebanese
- 110.1%Maltese
- 100.09%Portuguese
- 100.09%Russian
- 70.06%Northern European
- 10.01%Jamaican

Geographical mobility in Kalispell

- Same house 1 year ago
- 20,24684.7%White (Caucasian)
- 7985.1%Black or African American
- 19967.2%American Indian / Alaska Native
- 38992.3%Asian
- 28798.2%Other race
- 1,31772.4%Two or more races
- 20,09384.8%White alone, not Hispanic / Latino
- 80072.3%Hispanic or Latino

-
- Moved within same county
- 2,3399.8%White / Caucasian
- 1313.6%Black or African American
- 4214.2%American Indian / Alaska Native
- 307.0%Asian
- 113.7%Other race
- 28515.7%Two or more races
- 2,3089.7%White alone, not Hispanic / Latino
- 1029.2%Hispanic or Latino

-
- Moved within same state
- 2571.1%White / Caucasian
- 5418.3%American Indian / Alaska Native
- 915.0%Two or more races
- 2351.0%White alone, not Hispanic / Latino
- 15313.9%Hispanic or Latino

-
- Moved from different state
- 5552.3%White / Caucasian
- 794.4%Two or more races
- 5642.4%White alone, not Hispanic / Latino
- 413.7%Hispanic or Latino

-
- Moved from abroad
- 90.0%White
- 90.0%White alone, not Hispanic / Latino

Children Nativity (place of birth) in Kalispell
Place of birth for residents in Kalispell
![Place of birth for the foreign-born population - Regions]()
- 308Asia
- 233Americas
- 159Eastern Asia
- 156Latin America
- 156Central America
- 144Africa
- 143Northern Africa
- 124Europe
- 122China
- 103South Eastern Asia
- 77Northern America
- 62Eastern Europe
- 45South Central Asia
- 39Western Europe
- 32Oceania
- 32Australia and New Zealand Subregion
- 22Northern Europe
- 1Eastern Africa

![Place of birth for the foreign-born population - Countries]()
- 143Egypt
- 92China
- 77Canada
- 76Philippines
- 74Mexico
- 53Guatemala
- 45India
- 39Germany
- 32Australia
- 29Taiwan
- 28Panama
- 26Vietnam
- 24Ukraine
- 21Japan
- 20Hungary
- 15Korea
- 12England
- 12Russia
- 10Scotland
- 5Poland

Grandparents responsible for own grandchildren in Kalispell
Zip codes: 59901.