Races in Kabletown district, West Virginia (WV) Detailed Stats
Ancestries, Foreign-born residents, place of birth
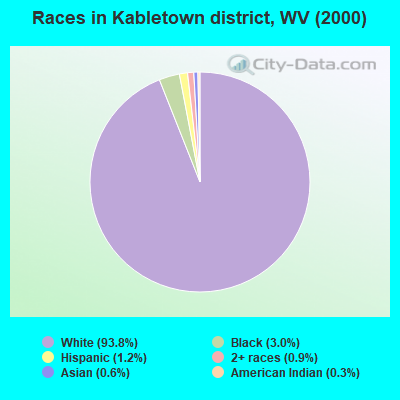
Race distribution in Kabletown district

- 9,45093.8%White alone
- 3073.0%Black alone
- 1251.2%Hispanic
- 930.9%Two or more races
- 630.6%Asian alone
- 270.3%American Indian alone
- 60.06%Other race alone
- 20.02%Native Hawaiian and Other
Pacific Islander alone
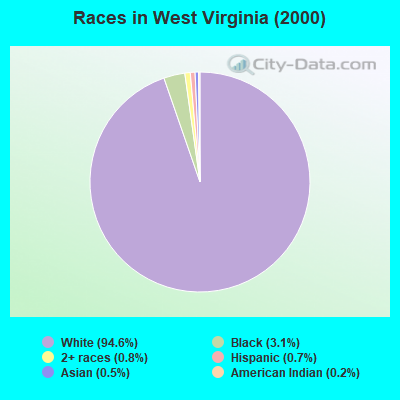
2000
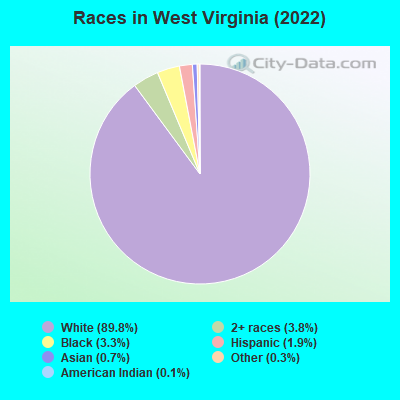
2022
-
- 1,709,96694.6%White alone
- 56,8253.1%Black alone
- 14,9830.8%Two or more races
- 12,2790.7%Hispanic
- 9,3560.5%Asian alone
- 3,4560.2%American Indian alone
- 1,1440.06%Other race alone
- 3350.02%Native Hawaiian and Other
Pacific Islander alone
-
- 1,594,12889.8%White alone
- 66,9323.8%Two or more races
- 59,3903.3%Black alone
- 34,3431.9%Hispanic
- 13,1340.7%Asian alone
- 5,2380.3%Other race alone
- 1,8800.1%American Indian alone
- 1110.01%Native Hawaiian and Other
Pacific Islander alone
Income and house value in Kabletown district
- Median household income in 2022
- $101,913White non-Hispanic householders
- $55,078Black householders
- $43,829American Indian and Alaska Native householders
- over $200,000Asian householders
- $80,170Some other race householders
- $96,732Two or more races householders
- $74,169Hispanic or Latino race householders
- Median 2022 house value
- $375,911White Non-Hispanic householders
- $298,217Black or African American householders
- $131,437American Indian or Alaska Native householders
- $277,479Asian householders
Household income for White non-Hispanic householders

Household income for Black householders

Household income for American Indian and Alaska Native householders

Household income for Asian householders

Household income for Two or more races householders

Household income for Hispanic or Latino race householders

Zip code: 25414