Races in Justice, Illinois (IL) Detailed Stats
Data:
Races - White alone (%)
Races - White alone (% change since 2000)
Races - Black alone (%)
Races - Black alone (% change since 2000)
Races - American Indian alone (%)
Races - American Indian alone (% change since 2000)
Races - Asian alone (%)
Races - Asian alone (% change since 2000)
Races - Hispanic (%)
Races - Hispanic (% change since 2000)
Races - Native Hawaiian and Other Pacific Islander alone (%)
Races - Native Hawaiian and Other Pacific Islander alone (% change since 2000)
Races - Two or more races(%)
Races - Two or more races(% change since 2000)
Races - Other race alone (%)
Races - Other race alone (% change since 2000)
Racial diversity
Place of birth - Born in state of residence (%)
Place of birth - Born in state of residence (%) - White
Place of birth - Born in state of residence (%) - Black or African American
Place of birth - Born in state of residence (%) - Asian
Place of birth - Born in state of residence (%) - Hispanic or Latino
Place of birth - Born in state of residence (%) - American Indian and Alaska Native
Place of birth - Born in state of residence (%) - Multirace
Place of birth - Born in state of residence (%) - Other Race
Place of birth - Born in other state (%)
Place of birth - Born in other state (%) - White
Place of birth - Born in other state (%) - Black or African American
Place of birth - Born in other state (%) - Asian
Place of birth - Born in other state (%) - Hispanic or Latino
Place of birth - Born in other state (%) - American Indian and Alaska Native
Place of birth - Born in other state (%) - Multirace
Place of birth - Born in other state (%) - Other Race
Place of birth - Native, outside of US (%)
Place of birth - Native, outside of US (%) - White
Place of birth - Native, outside of US (%) - Black or African American
Place of birth - Native, outside of US (%) - Asian
Place of birth - Native, outside of US (%) - Hispanic or Latino
Place of birth - Native, outside of US (%) - American Indian and Alaska Native
Place of birth - Native, outside of US (%) - Multirace
Place of birth - Native, outside of US (%) - Other Race
Place of birth - Foreign born (%)
Place of birth - Foreign born (%) - White
Place of birth - Foreign born (%) - Black or African American
Place of birth - Foreign born (%) - Asian
Place of birth - Foreign born (%) - Hispanic or Latino
Place of birth - Foreign born (%) - American Indian and Alaska Native
Place of birth - Foreign born (%) - Multirace
Place of birth - Foreign born (%) - Other Race
Residents speaking English at home (%)
Residents speaking English at home - Born in the United States (%)
Residents speaking English at home - Native, born elsewhere (%)
Residents speaking English at home - Foreign born (%)
Residents speaking Spanish at home (%)
Residents speaking Spanish at home - Born in the United States (%)
Residents speaking Spanish at home - Native, born elsewhere (%)
Residents speaking Spanish at home - Foreign born (%)
Residents speaking other language at home (%)
Residents speaking other language at home - Born in the United States (%)
Residents speaking other language at home - Native, born elsewhere (%)
Residents speaking other language at home - Foreign born (%)
Marital status - Never married (%)
Marital status - Now married (%)
Marital status - Separated (%)
Marital status - Widowed (%)
Marital status - Divorced (%)
Ancestries Reported - Arab (%)
Ancestries Reported - Czech (%)
Ancestries Reported - Danish (%)
Ancestries Reported - Dutch (%)
Ancestries Reported - English (%)
Ancestries Reported - French (%)
Ancestries Reported - French Canadian (%)
Ancestries Reported - German (%)
Ancestries Reported - Greek (%)
Ancestries Reported - Hungarian (%)
Ancestries Reported - Irish (%)
Ancestries Reported - Italian (%)
Ancestries Reported - Lithuanian (%)
Ancestries Reported - Norwegian (%)
Ancestries Reported - Polish (%)
Ancestries Reported - Portuguese (%)
Ancestries Reported - Russian (%)
Ancestries Reported - Scotch-Irish (%)
Ancestries Reported - Scottish (%)
Ancestries Reported - Slovak (%)
Ancestries Reported - Subsaharan African (%)
Ancestries Reported - Swedish (%)
Ancestries Reported - Swiss (%)
Ancestries Reported - Ukrainian (%)
Ancestries Reported - United States (%)
Ancestries Reported - Welsh (%)
Ancestries Reported - West Indian (%)
Ancestries Reported - Other (%)
Geographical mobility - Same house 1 year ago (%)
Geographical mobility - Same house 1 year ago (%) - White
Geographical mobility - Same house 1 year ago (%) - Black or African American
Geographical mobility - Same house 1 year ago (%) - Asian
Geographical mobility - Same house 1 year ago (%) - Hispanic or Latino
Geographical mobility - Same house 1 year ago (%) - American Indian and Alaska Native
Geographical mobility - Same house 1 year ago (%) - Multirace
Geographical mobility - Same house 1 year ago (%) - Other Race
Geographical mobility - Moved within same county (%)
Geographical mobility - Moved within same county (%) - White
Geographical mobility - Moved within same county (%) - Black or African American
Geographical mobility - Moved within same county (%) - Asian
Geographical mobility - Moved within same county (%) - Hispanic or Latino
Geographical mobility - Moved within same county (%) - American Indian and Alaska Native
Geographical mobility - Moved within same county (%) - Multirace
Geographical mobility - Moved within same county (%) - Other Race
Geographical mobility - Moved from different county within same state (%)
Geographical mobility - Moved from different county within same state (%) - White
Geographical mobility - Moved from different county within same state (%) - Black or African American
Geographical mobility - Moved from different county within same state (%) - Asian
Geographical mobility - Moved from different county within same state (%) - Hispanic or Latino
Geographical mobility - Moved from different county within same state (%) - American Indian and Alaska Native
Geographical mobility - Moved from different county within same state (%) - Multirace
Geographical mobility - Moved from different county within same state (%) - Other Race
Geographical mobility - Moved from different state (%)
Geographical mobility - Moved from different state (%) - White
Geographical mobility - Moved from different state (%) - Black or African American
Geographical mobility - Moved from different state (%) - Asian
Geographical mobility - Moved from different state (%) - Hispanic or Latino
Geographical mobility - Moved from different state (%) - American Indian and Alaska Native
Geographical mobility - Moved from different state (%) - Multirace
Geographical mobility - Moved from different state (%) - Other Race
Geographical mobility - Moved from abroad (%)
Geographical mobility - Moved from abroad (%) - White
Geographical mobility - Moved from abroad (%) - Black or African American
Geographical mobility - Moved from abroad (%) - Asian
Geographical mobility - Moved from abroad (%) - Hispanic or Latino
Geographical mobility - Moved from abroad (%) - American Indian and Alaska Native
Geographical mobility - Moved from abroad (%) - Multirace
Geographical mobility - Moved from abroad (%) - Other Race
Place of birth for the foreign-born population - Ireland (%)
Place of birth for the foreign-born population - Denmark (%)
Place of birth for the foreign-born population - Norway (%)
Place of birth for the foreign-born population - Sweden (%)
Place of birth for the foreign-born population - United Kingdom (%)
Place of birth for the foreign-born population - England (%)
Place of birth for the foreign-born population - Scotland (%)
Place of birth for the foreign-born population - Other Northern Europe (%)
Place of birth for the foreign-born population - Austria (%)
Place of birth for the foreign-born population - Belgium (%)
Place of birth for the foreign-born population - France (%)
Place of birth for the foreign-born population - Germany (%)
Place of birth for the foreign-born population - Netherlands (%)
Place of birth for the foreign-born population - Switzerland (%)
Place of birth for the foreign-born population - Other Western Europe (%)
Place of birth for the foreign-born population - Greece (%)
Place of birth for the foreign-born population - Italy (%)
Place of birth for the foreign-born population - Portugal (%)
Place of birth for the foreign-born population - Spain (%)
Place of birth for the foreign-born population - Other Southern Europe (%)
Place of birth for the foreign-born population - Albania (%)
Place of birth for the foreign-born population - Belarus (%)
Place of birth for the foreign-born population - Bosnia and Herzegovina (%)
Place of birth for the foreign-born population - Bulgaria (%)
Place of birth for the foreign-born population - Croatia (%)
Place of birth for the foreign-born population - Czechoslovakia (%)
Place of birth for the foreign-born population - Hungary (%)
Place of birth for the foreign-born population - Latvia (%)
Place of birth for the foreign-born population - Lithuania (%)
Place of birth for the foreign-born population - North Macedonia (Macedonia) (%)
Place of birth for the foreign-born population - Moldova (%)
Place of birth for the foreign-born population - Poland (%)
Place of birth for the foreign-born population - Romania (%)
Place of birth for the foreign-born population - Russia (%)
Place of birth for the foreign-born population - Serbia (%)
Place of birth for the foreign-born population - Ukraine (%)
Place of birth for the foreign-born population - Other Eastern Europe (%)
Place of birth for the foreign-born population - China (%)
Place of birth for the foreign-born population - Hong Kong (%)
Place of birth for the foreign-born population - Taiwan (%)
Place of birth for the foreign-born population - Japan (%)
Place of birth for the foreign-born population - Korea (%)
Place of birth for the foreign-born population - Other Eastern Asia (%)
Place of birth for the foreign-born population - Afghanistan (%)
Place of birth for the foreign-born population - Bangladesh (%)
Place of birth for the foreign-born population - India (%)
Place of birth for the foreign-born population - Iran (%)
Place of birth for the foreign-born population - Kazakhstan (%)
Place of birth for the foreign-born population - Nepal (%)
Place of birth for the foreign-born population - Pakistan (%)
Place of birth for the foreign-born population - Sri Lanka (%)
Place of birth for the foreign-born population - Uzbekistan (%)
Place of birth for the foreign-born population - Other South Central Asia (%)
Place of birth for the foreign-born population - Burma (%)
Place of birth for the foreign-born population - Cambodia (%)
Place of birth for the foreign-born population - Indonesia (%)
Place of birth for the foreign-born population - Laos (%)
Place of birth for the foreign-born population - Malaysia (%)
Place of birth for the foreign-born population - Philippines (%)
Place of birth for the foreign-born population - Singapore (%)
Place of birth for the foreign-born population - Thailand (%)
Place of birth for the foreign-born population - Vietnam (%)
Place of birth for the foreign-born population - Other South Eastern Asia (%)
Place of birth for the foreign-born population - Armenia (%)
Place of birth for the foreign-born population - Iraq (%)
Place of birth for the foreign-born population - Israel (%)
Place of birth for the foreign-born population - Jordan (%)
Place of birth for the foreign-born population - Kuwait (%)
Place of birth for the foreign-born population - Lebanon (%)
Place of birth for the foreign-born population - Saudi Arabia (%)
Place of birth for the foreign-born population - Syria (%)
Place of birth for the foreign-born population - Turkey (%)
Place of birth for the foreign-born population - Yemen (%)
Place of birth for the foreign-born population - Other Western Asia (%)
Place of birth for the foreign-born population - Eritrea (%)
Place of birth for the foreign-born population - Ethiopia (%)
Place of birth for the foreign-born population - Kenya (%)
Place of birth for the foreign-born population - Somalia (%)
Place of birth for the foreign-born population - Uganda (%)
Place of birth for the foreign-born population - Zimbabwe (%)
Place of birth for the foreign-born population - Other Eastern Africa (%)
Place of birth for the foreign-born population - Cameroon (%)
Place of birth for the foreign-born population - Congo (%)
Place of birth for the foreign-born population - Democratic Republic of Congo (Zaire) (%)
Place of birth for the foreign-born population - Other Middle Africa (%)
Place of birth for the foreign-born population - Egypt (%)
Place of birth for the foreign-born population - Morocco (%)
Place of birth for the foreign-born population - Sudan (%)
Place of birth for the foreign-born population - Other Northern Africa (%)
Place of birth for the foreign-born population - South Africa (%)
Place of birth for the foreign-born population - Other Southern Africa (%)
Place of birth for the foreign-born population - Cabo Verde (%)
Place of birth for the foreign-born population - Ghana (%)
Place of birth for the foreign-born population - Liberia (%)
Place of birth for the foreign-born population - Nigeria (%)
Place of birth for the foreign-born population - Senegal (%)
Place of birth for the foreign-born population - Sierra Leone (%)
Place of birth for the foreign-born population - Other Western Africa (%)
Place of birth for the foreign-born population - Australia (%)
Place of birth for the foreign-born population - New Zealand (%)
Place of birth for the foreign-born population - Fiji (%)
Place of birth for the foreign-born population - Micronesia (%)
Place of birth for the foreign-born population - Bahamas (%)
Place of birth for the foreign-born population - Barbados (%)
Place of birth for the foreign-born population - Cuba (%)
Place of birth for the foreign-born population - Dominica (%)
Place of birth for the foreign-born population - Dominican Republic (%)
Place of birth for the foreign-born population - Grenada (%)
Place of birth for the foreign-born population - Haiti (%)
Place of birth for the foreign-born population - Jamaica (%)
Place of birth for the foreign-born population - St. Vincent and the Grenadines (%)
Place of birth for the foreign-born population - Trinidad and Tobago (%)
Place of birth for the foreign-born population - West Indies (%)
Place of birth for the foreign-born population - Other Caribbean (%)
Place of birth for the foreign-born population - Belize (%)
Place of birth for the foreign-born population - Costa Rica (%)
Place of birth for the foreign-born population - El Salvador (%)
Place of birth for the foreign-born population - Guatemala (%)
Place of birth for the foreign-born population - Honduras (%)
Place of birth for the foreign-born population - Mexico (%)
Place of birth for the foreign-born population - Nicaragua (%)
Place of birth for the foreign-born population - Panama (%)
Place of birth for the foreign-born population - Other Central America (%)
Place of birth for the foreign-born population - Argentina (%)
Place of birth for the foreign-born population - Bolivia (%)
Place of birth for the foreign-born population - Brazil (%)
Place of birth for the foreign-born population - Chile (%)
Place of birth for the foreign-born population - Colombia (%)
Place of birth for the foreign-born population - Ecuador (%)
Place of birth for the foreign-born population - Guyana (%)
Place of birth for the foreign-born population - Peru (%)
Place of birth for the foreign-born population - Uruguay (%)
Place of birth for the foreign-born population - Venezuela (%)
Place of birth for the foreign-born population - Other South America (%)
Place of birth for the foreign-born population - Canada (%)
Place of birth for the foreign-born population - Other Northern America (%)
Place of birth for the foreign-born population - Other (%)
Latest news about races in Justice, IL collected exclusively by city-data.com from local newspapers, TV, and radio stations
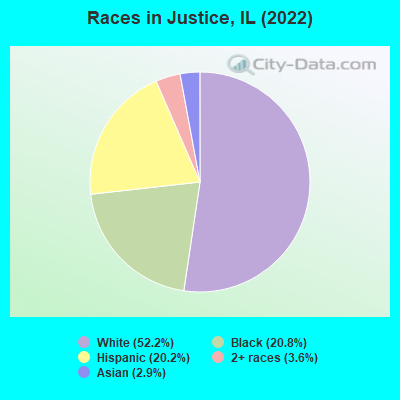
According to 2022 data, the most numerous races in Justice, IL are White alone (6,389 residents), Hispanic (2,472 residents), and Black alone (2,547 residents). 53.3% of Justice residents speak English at home. 26.0% of Justice, IL residents are foreign-born (14.3% born in Europe, 7.7% born in Asia, 3.1% born in Latin America), which is 46.2% greater than the foreign-born rate of 14.0% across the entire state of Illinois.
Race distribution in Justice
2000 2022
8,424,140 67.8% White alone 1,856,152 14.9% Black alone 1,530,262 12.3% Hispanic 419,916 3.4% Asian alone 153,996 1.2% Two or more races 13,479 0.1% Other race alone 18,232 0.1% American Indian alone 3,116 0.03% Native Hawaiian and Other
7,356,301 58.5% White alone 2,299,726 18.3% Hispanic 1,660,423 13.2% Black alone 747,296 5.9% Asian alone 458,599 3.6% Two or more races 45,386 0.4% Other race alone 10,405 0.08% American Indian alone 3,896 0.03% Native Hawaiian and Other
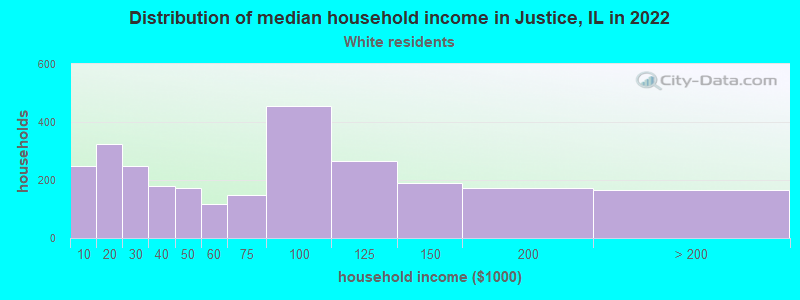
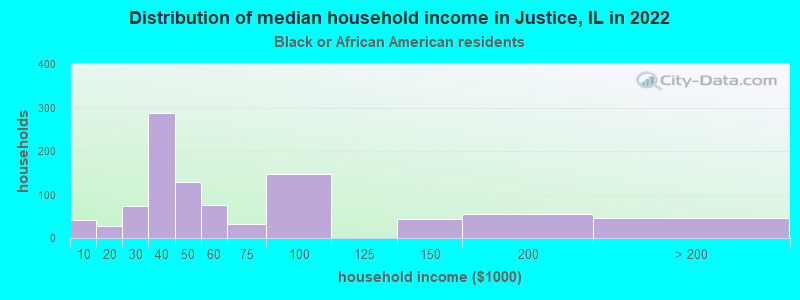
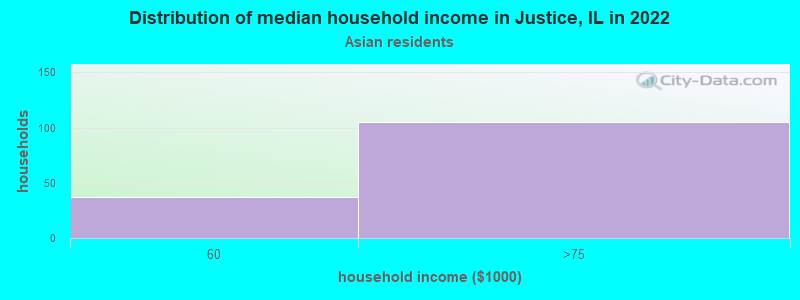
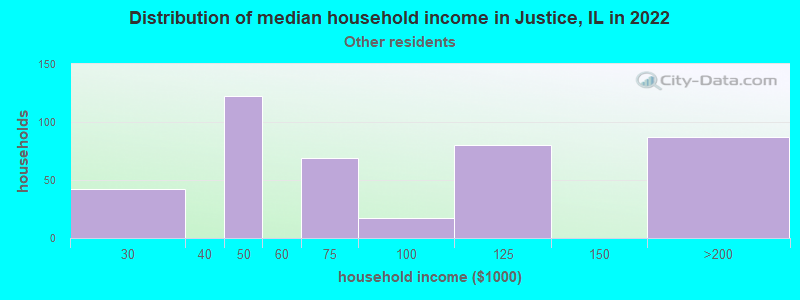
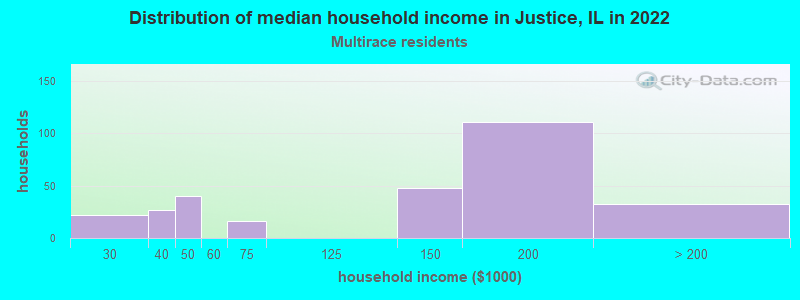
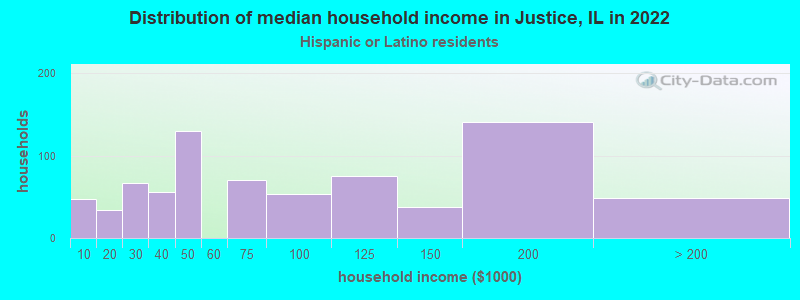
Income and house value in Justice Median household income in 2022 $63,466 White non-Hispanic householders$41,885 Black householders$59,781 Asian householders$67,467 Some other race householders$153,543 Two or more races householders$66,665 Hispanic or Latino race householdersMedian 2022 house value $236,934 White Non-Hispanic householders$212,020 Black or African American householders $255,494 Asian householders$276,060 Some other race householders$293,952 Two or more races householders$269,038 Hispanic or Latino householders
Median age by race in Justice
37.7 Median age for White residents36.4 39.4 28.3 Median age for Black or African American residents24.0 30.1 11.0 Median age for American Indian / Alaska Native residents-736,736,736.0 6.4 25.6 Median age for Asian residents25.3 49.4 -687,999,999.3 Median age for Native Hawaiian / Pacific Islander residents-918,721,460.3 -610,229,276.3 32.7 Median age for Other race residents37.6 31.2 24.6 Median age for Two or more races residents24.9 23.7 37.3 Median age for White alone residents37.0 38.7 24.5 Median age for Hispanic or Latino residents24.5 31.1
Owner/renter occupied households by race in Justice
House owners and renters - White residents 1,807 67.3% Owner occupied877 32.7% Renter occupiedHouse owners and renters - Black or African American residents 45 4.7% Owner occupied928 95.3% Renter occupiedHouse owners and renters - American Indian / Alaska Native residents 15 100.0% Renter occupiedHouse owners and renters - Asian residents 45 34.5% Owner occupied85 65.5% Renter occupiedHouse owners and renters - Other race residents 308 76.9% Owner occupied93 23.1% Renter occupiedHouse owners and renters - Two or more races residents 161 53.3% Owner occupied141 46.7% Renter occupiedHouse owners and renters - White alone residents 1,812 67.8% Owner occupied859 32.2% Renter occupiedHouse owners and renters - Hispanic or Latino residents 493 64.2% Owner occupied275 35.8% Renter occupied
Language usage in Justice
English speakers - Total 53.3% of residents of Justice speak English at home.
12.4% of residents speak Spanish at home 1,030 74.8% Speak English very well347 25.2% Speak English less than very well34.7% of residents speak other language at home 2,100 54.5% Speak English very well1,754 45.5% Speak English less than very well
English speakers - Born in the United States 84.1% of residents of Justice speak English at home.
8.6% of residents speak Spanish at home 68 87.2% Speak English very well10 12.8% Speak English less than very well7.4% of residents speak other language at home 67 100.0% Speak English very well
English speakers - Native, born elsewhere 47.6% of residents of Justice speak English at home.
3.6% of residents speak Spanish at home 9 100.0% Speak English very well50.0% of residents speak other language at home 57 46.0% Speak English very well67 54.0% Speak English less than very well
English speakers - Foreign-born 5.2% of residents of Justice speak English at home.
12.5% of residents speak Spanish at home 176 44.3% Speak English very well221 55.7% Speak English less than very well82.1% of residents speak other language at home 1,077 41.3% Speak English very well1,528 58.7% Speak English less than very well
White (Caucasian) - Speak only English Native:
66.3% (2,428)Foreign-born:
6.2% (113)
White (Caucasian) - Speak another language Native:
27.2% (995)Foreign-born:
93.2% (1,718)
Black or African American - Speak another language Native:
2.3% (53)Foreign-born:
91.2% (58)
Other race - Speak another language Native:
66.2% (537)Foreign-born:
100.0% (195)
Two or more races - Speak another language Native:
21.3% (276)Foreign-born:
100.0% (223)
White alone - Speak only English Native:
66.5% (2,219)Foreign-born:
5.0% (115)
White alone - Speak another language Native:
36.1% (1,204)Foreign-born:
96.2% (2,215)
Hispanic or Latino - Speak only English Native:
52.9% (1,079)Foreign-born:
2.8% (11)
Hispanic or Latino - Speak another language Native:
48.4% (985)Foreign-born:
97.4% (380)
Foreign-born residents in Justice 3,186 residents are foreign born (14.3% Europe , 7.7% Asia , 3.1% Latin America ).
This city:
26.0%Illinois:
14.1%
Marital status for residents in Justice Marital status - White (Caucasian) population 15 years and over
Males 29.9% Never married55.1% Now married2.4% Separated1.0% Widowed11.6% DivorcedFemales 19.8% Never married54.9% Now married3.5% Separated7.6% Widowed14.3% DivorcedWomen who gave birth in the past 12 months Now married:
87.7% (139)Unmarried:
12.3% (19)
Women who did not give birth in the past 12 months Now married:
53.3% (725)Unmarried:
46.7% (636)
Marital status - Black or African American population 15 years and over
Males 55.3% Never married37.6% Now married0.0% Separated0.0% Widowed7.2% DivorcedFemales 67.7% Never married18.8% Now married1.8% Separated6.1% Widowed5.5% DivorcedWomen who gave birth in the past 12 months Now married:
60.0% (28)Unmarried:
40.0% (19)
Women who did not give birth in the past 12 months Now married:
11.7% (99)Unmarried:
88.3% (751)
Marital status - American Indian / Alaska Native population 15 years and over
Males 52.9% Never married0.0% Now married0.0% Separated0.0% Widowed47.1% DivorcedFemales 100.0% Never married0.0% Now married0.0% Separated0.0% Widowed0.0% DivorcedWomen who did not give birth in the past 12 months Now married:
0.0% (0)Unmarried:
100.0% (7)
Marital status - Asian population 15 years and over
Males 100.0% Never married0.0% Now married0.0% Separated0.0% Widowed0.0% DivorcedFemales 23.8% Never married15.2% Now married0.0% Separated3.7% Widowed57.3% DivorcedWomen who did not give birth in the past 12 months Now married:
7.6% (11)Unmarried:
92.4% (134)
Marital status - Other race population 15 years and over
Males 39.3% Never married38.5% Now married16.5% Separated0.0% Widowed5.7% DivorcedFemales 42.4% Never married38.6% Now married2.4% Separated12.7% Widowed3.8% DivorcedWomen who did not give birth in the past 12 months Now married:
46.2% (152)Unmarried:
53.8% (177)
Marital status - Two or more races population 15 years and over
Males 60.4% Never married35.7% Now married0.0% Separated0.0% Widowed3.9% DivorcedFemales 63.2% Never married36.8% Now married0.0% Separated0.0% Widowed0.0% DivorcedWomen who gave birth in the past 12 months Now married:
0.0% (0)Unmarried:
100.0% (12)
Women who did not give birth in the past 12 months Now married:
25.4% (96)Unmarried:
74.6% (282)
Marital status - White alone, not Hispanic / Latino population 15 years and over
Males 25.5% Never married58.3% Now married2.7% Separated1.1% Widowed12.4% DivorcedFemales 17.6% Never married58.6% Now married3.8% Separated8.5% Widowed11.5% DivorcedWomen who gave birth in the past 12 months Now married:
87.7% (156)Unmarried:
12.3% (22)
Women who did not give birth in the past 12 months Now married:
60.5% (756)Unmarried:
39.5% (493)
Marital status - Hispanic or Latino population 15 years and over
Males 57.0% Never married31.7% Now married5.5% Separated0.0% Widowed5.7% DivorcedFemales 43.3% Never married35.4% Now married1.0% Separated5.4% Widowed14.8% DivorcedWomen who gave birth in the past 12 months Now married:
0.0% (0)Unmarried:
100.0% (9)
Women who did not give birth in the past 12 months Now married:
33.7% (239)Unmarried:
66.3% (470)
Ancestries in Justice
2,174 26.8% Polish634 7.8% Palestinian293 3.6% Irish213 2.6% Lithuanian173 2.1% English169 2.1% African165 2.0% American142 1.8% Arab87 1.1% Italian45 0.6% Serbian37 0.5% Jordanian25 0.3% German19 0.2% Croatian17 0.2% Slovak12 0.1% Czech8 0.10% Ukrainian7 0.09% European6 0.07% Greek4 0.05% Slovene
Children Nativity (place of birth) in Justice
Children under 6 years - Living with two parents Both parents native 199 100.0% NativeBoth parents foreign-born 378 96.9% Native12 3.1% Foreign-bornOne native, one foreign-born parent 322 100.0% NativeChildren under 6 years - Living with one parent Native parent 358 100.0% NativeChildren 6 to 17 years - Living with two parents Both parents native 261 96.3% Native10 3.7% Foreign-bornBoth parents foreign-born 335 96.5% Native12 3.5% Foreign-bornOne native, one foreign-born parent 257 100.0% NativeChildren 6 to 17 years - Living with one parent Native parent 470 100.0% NativeForeign-born parent 117 57.4% Native87 42.6% Foreign-born
Grandparents responsible for own grandchildren in Justice
Grandparents (30 to 59 years) Black or African American 12 48.5% Responsible for grandchildren13 51.5% Not responsible for grandchildrenTwo or more races 64 100.0% Not responsible for grandchildrenHispanic or Latino 46 100.0% Not responsible for grandchildren
Grandparents (60 years and over) Black or African American 46 100.0% Not responsible for grandchildrenTwo or more races 84 100.0% Not responsible for grandchildrenHispanic or Latino 54 100.0% Not responsible for grandchildren