Races in Inglewood-Finn Hill, Washington (WA) Detailed Stats
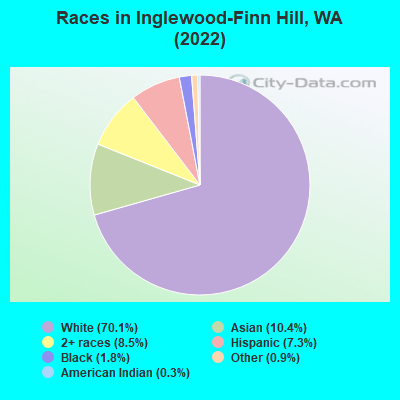
According to 2022 data, the most numerous races in Inglewood-Finn Hill, WA are White alone (20,518 residents), Hispanic (2,140 residents), and Asian alone (3,051 residents). 79.5% of Inglewood-Finn Hill residents speak English at home. 14.5% of Inglewood-Finn Hill, WA residents are foreign-born (5.6% born in Europe, 5.4% born in Asia, 2.5% born in Latin America), which is 3.2% less than the foreign-born rate of 15.0% across the entire state of Washington.
Race distribution in Inglewood-Finn Hill
2000 2022
4,652,490 78.9% White alone 441,509 7.5% Hispanic 319,401 5.4% Asian alone 184,631 3.1% Black alone 175,926 3.0% Two or more races 85,396 1.4% American Indian alone 22,779 0.4% Native Hawaiian and Other 11,989 0.2% Other race alone
4,941,456 63.5% White alone 1,093,313 14.0% Hispanic 755,832 9.7% Asian alone 523,448 6.7% Two or more races 299,537 3.8% Black alone 69,024 0.9% American Indian alone 52,231 0.7% Native Hawaiian and Other 50,945 0.7% Other race alone
Income and house value in Inglewood-Finn Hill Median household income in 2022 $126,800 White non-Hispanic householders$82,743 Black householders$95,572 American Indian and Alaska Native householders$171,979 Asian householders$109,179 Native Hawaiian and other Pacific Islander householders$96,169 Some other race householders$83,734 Two or more races householders$76,225 Hispanic or Latino race householdersMedian 2022 house value $917,420 White Non-Hispanic householders$999,679 Black or African American householders$795,554 American Indian or Alaska Native householders $917,420 Asian householders$856,868 Native Hawaiian and other Pacific Islander householders$799,743 Some other race householders$980,257 Two or more races householders$766,611 Hispanic or Latino householders
Median age by race in Inglewood-Finn Hill
39.4 Median age for White residents40.0 39.1 43.0 Median age for Black or African American residents42.8 42.0 44.4 Median age for American Indian / Alaska Native residents55.9 22.9 39.6 Median age for Asian residents38.1 42.4 65.0 Median age for Other race residents63.9 64.0 19.5 Median age for Two or more races residents22.9 19.5 39.5 Median age for White alone residents39.6 39.7 31.5 Median age for Hispanic or Latino residents53.8 26.2
Owner/renter occupied households by race in Inglewood-Finn Hill
House owners and renters - White residents 6,082 74.7% Owner occupied2,055 25.3% Renter occupiedHouse owners and renters - Black or African American residents 74 32.6% Owner occupied152 67.4% Renter occupiedHouse owners and renters - American Indian / Alaska Native residents 22 41.6% Owner occupied30 58.4% Renter occupiedHouse owners and renters - Asian residents 915 90.7% Owner occupied94 9.3% Renter occupiedHouse owners and renters - Other race residents 97 56.5% Owner occupied74 43.5% Renter occupiedHouse owners and renters - Two or more races residents 330 76.0% Owner occupied104 24.0% Renter occupiedHouse owners and renters - White alone residents 6,040 75.7% Owner occupied1,934 24.3% Renter occupiedHouse owners and renters - Hispanic or Latino residents 163 43.7% Owner occupied210 56.3% Renter occupied
Language usage in Inglewood-Finn Hill
English speakers - Total 79.5% of residents of Inglewood-Finn Hill speak English at home.
4.5% of residents speak Spanish at home 979 82.8% Speak English very well204 17.2% Speak English less than very well16.7% of residents speak other language at home 3,305 74.4% Speak English very well1,135 25.6% Speak English less than very well
English speakers - Born in the United States 93.3% of residents of Inglewood-Finn Hill speak English at home.
3.6% of residents speak Spanish at home 331 100.0% Speak English very well3.3% of residents speak other language at home 304 97.7% Speak English very well7 2.3% Speak English less than very well
English speakers - Native, born elsewhere 95.9% of residents of Inglewood-Finn Hill speak English at home.
2.7% of residents speak Spanish at home 6 100.0% Speak English less than very well5.0% of residents speak other language at home 11 100.0% Speak English less than very well
English speakers - Foreign-born 21.3% of residents of Inglewood-Finn Hill speak English at home.
8.8% of residents speak Spanish at home 229 53.4% Speak English very well200 46.6% Speak English less than very well77.5% of residents speak other language at home 2,706 71.9% Speak English very well1,060 28.1% Speak English less than very well
White (Caucasian) - Speak only English Native:
95.9% (16,731)Foreign-born:
29.6% (644)
White (Caucasian) - Speak another language Native:
4.1% (708)Foreign-born:
70.0% (1,522)
Black or African American - Speak only English Native:
86.8% (362)Foreign-born:
75.7% (70)
Black or African American - Speak another language Native:
14.7% (61)Foreign-born:
43.1% (40)
American Indian / Alaska Native - Speak only English Native:
94.3% (157)Foreign-born:
61.2% (18)
Asian - Speak only English Native:
77.5% (567)Foreign-born:
10.9% (195)
Asian - Speak another language Native:
25.9% (189)Foreign-born:
88.6% (1,583)
Other race - Speak another language Native:
77.1% (281)Foreign-born:
99.2% (253)
Two or more races - Speak only English Native:
76.3% (2,316)Foreign-born:
14.0% (90)
Two or more races - Speak another language Native:
31.3% (949)Foreign-born:
84.7% (544)
White alone - Speak only English Native:
96.4% (16,438)Foreign-born:
28.4% (672)
White alone - Speak another language Native:
3.5% (604)Foreign-born:
73.3% (1,736)
Hispanic or Latino - Speak another language Native:
31.1% (381)Foreign-born:
100.0% (398)
Foreign-born residents in Inglewood-Finn Hill 4,255 residents are foreign born (5.6% Europe , 5.4% Asia , 2.5% Latin America ).
This city:
14.5%Washington:
100.0%
Marital status for residents in Inglewood-Finn Hill Marital status - White (Caucasian) population 15 years and over
Males 28.9% Never married60.6% Now married0.2% Separated0.2% Widowed10.1% DivorcedFemales 22.5% Never married56.5% Now married2.1% Separated8.1% Widowed10.7% DivorcedWomen who gave birth in the past 12 months Now married:
100.0% (215)Unmarried:
0.0% (0)
Women who did not give birth in the past 12 months Now married:
54.7% (2,425)Unmarried:
45.3% (2,007)
Marital status - Black or African American population 15 years and over
Males 53.8% Never married24.9% Now married0.0% Separated11.2% Widowed10.2% DivorcedFemales 32.7% Never married30.2% Now married0.0% Separated6.9% Widowed30.2% DivorcedWomen who did not give birth in the past 12 months Now married:
24.5% (30)Unmarried:
75.5% (92)
Marital status - American Indian / Alaska Native population 15 years and over
Males 54.8% Never married28.8% Now married0.0% Separated0.0% Widowed16.3% DivorcedFemales 74.1% Never married14.8% Now married0.0% Separated0.0% Widowed11.1% DivorcedWomen who did not give birth in the past 12 months Now married:
0.0% (0)Unmarried:
100.0% (61)
Marital status - Asian population 15 years and over
Males 29.9% Never married64.1% Now married0.0% Separated1.7% Widowed4.3% DivorcedFemales 22.9% Never married68.1% Now married0.0% Separated1.2% Widowed7.8% DivorcedWomen who gave birth in the past 12 months Now married:
0.0% (0)Unmarried:
100.0% (19)
Women who did not give birth in the past 12 months Now married:
66.9% (688)Unmarried:
33.1% (341)
Marital status - Other race population 15 years and over
Males 23.2% Never married76.8% Now married0.0% Separated0.0% Widowed0.0% DivorcedFemales 0.0% Never married100.0% Now married0.0% Separated0.0% Widowed0.0% DivorcedWomen who did not give birth in the past 12 months Now married:
100.0% (156)Unmarried:
0.0% (0)
Marital status - Two or more races population 15 years and over
Males 43.8% Never married48.0% Now married0.0% Separated0.0% Widowed8.1% DivorcedFemales 52.7% Never married28.9% Now married0.0% Separated2.4% Widowed16.0% DivorcedWomen who gave birth in the past 12 months Now married:
50.0% (48)Unmarried:
50.0% (48)
Women who did not give birth in the past 12 months Now married:
19.8% (148)Unmarried:
80.2% (602)
Marital status - White alone, not Hispanic / Latino population 15 years and over
Males 29.3% Never married60.2% Now married0.2% Separated0.2% Widowed10.0% DivorcedFemales 21.7% Never married56.6% Now married2.2% Separated8.4% Widowed11.1% DivorcedWomen who gave birth in the past 12 months Now married:
100.0% (195)Unmarried:
0.0% (0)
Women who did not give birth in the past 12 months Now married:
55.2% (2,338)Unmarried:
44.8% (1,901)
Marital status - Hispanic or Latino population 15 years and over
Males 20.0% Never married76.6% Now married0.0% Separated0.0% Widowed3.4% DivorcedFemales 36.1% Never married63.9% Now married0.0% Separated0.0% Widowed0.0% DivorcedWomen who gave birth in the past 12 months Now married:
100.0% (37)Unmarried:
0.0% (0)
Women who did not give birth in the past 12 months Now married:
54.9% (340)Unmarried:
45.1% (279)
Ancestries in Inglewood-Finn Hill
940 7.3% European838 6.5% English798 6.2% German672 5.2% American501 3.9% Irish415 3.2% Romanian380 3.0% Italian310 2.4% Russian292 2.3% Scottish266 2.1% Norwegian248 1.9% British226 1.8% Brazilian213 1.7% Scandinavian211 1.6% Afghan206 1.6% Swedish157 1.2% French156 1.2% Bulgarian148 1.2% Iranian141 1.1% Polish132 1.0% Ukrainian110 0.9% Dutch94 0.7% Northern European84 0.7% Scotch-Irish67 0.5% Finnish61 0.5% Sudanese57 0.4% French Canadian48 0.4% Australian46 0.4% Turkish43 0.3% Assyrian36 0.3% African31 0.2% Icelander31 0.2% Lithuanian29 0.2% Egyptian28 0.2% Lebanese25 0.2% Eastern European24 0.2% Portuguese23 0.2% Canadian22 0.2% Czech22 0.2% Nigerian21 0.2% Basque20 0.2% Greek19 0.1% Czechoslovakian14 0.1% Welsh12 0.09% Hungarian11 0.09% Serbian11 0.09% Armenian8 0.06% Belgian8 0.06% Swiss6 0.05% Danish5 0.04% Austrian
Geographical mobility in Inglewood-Finn Hill Same house 1 year ago 17,171 83.0% White (Caucasian)471 87.1% Black or African American129 71.3% American Indian / Alaska Native2,697 87.2% Asian649 100.0% Other race3,329 82.5% Two or more races16,753 82.6% White alone, not Hispanic / Latino1,886 88.9% Hispanic or LatinoMoved within same county 1,728 8.3% White / Caucasian58 10.6% Black or African American47 26.1% American Indian / Alaska Native120 3.9% Asian2 0.4% Other race292 7.2% Two or more races1,752 8.6% White alone, not Hispanic / Latino190 8.9% Hispanic or LatinoMoved within same state 1,150 5.6% White / Caucasian20 3.8% Black or African American66 2.1% Asian1,161 5.7% White alone, not Hispanic / LatinoMoved from different state 708 3.4% White / Caucasian247 8.0% Asian564 14.0% Two or more races652 3.2% White alone, not Hispanic / Latino45 2.1% Hispanic or LatinoMoved from abroad 21 0.1% White21 0.7% Asian21 0.1% White alone, not Hispanic / Latino
Children Nativity (place of birth) in Inglewood-Finn Hill
Children under 6 years - Living with two parents Both parents native 1,095 100.0% NativeBoth parents foreign-born 173 100.0% NativeOne native, one foreign-born parent 73 100.0% NativeChildren under 6 years - Living with one parent Native parent 381 100.0% NativeChildren 6 to 17 years - Living with two parents Both parents native 2,559 99.9% Native3 0.1% Foreign-bornBoth parents foreign-born 416 58.8% Native292 41.2% Foreign-bornOne native, one foreign-born parent 222 100.0% NativeChildren 6 to 17 years - Living with one parent Native parent 610 100.0% NativeForeign-born parent 102 47.3% Native114 52.7% Foreign-born
Grandparents responsible for own grandchildren in Inglewood-Finn Hill
Grandparents (30 to 59 years) White / Caucasian 18 13.4% Responsible for grandchildren118 86.6% Not responsible for grandchildrenTwo or more races 60 100.0% Not responsible for grandchildrenWhite alone, not Hispanic / Latino 15 15.2% Responsible for grandchildren81 84.8% Not responsible for grandchildrenHispanic or Latino 66 100.0% Not responsible for grandchildrenGrandparents (60 years and over) White / Caucasian 14 4.3% Responsible for grandchildren319 95.7% Not responsible for grandchildrenTwo or more races 241 100.0% Not responsible for grandchildrenWhite alone, not Hispanic / Latino 16 5.4% Responsible for grandchildren278 94.6% Not responsible for grandchildrenHispanic or Latino 152 100.0% Not responsible for grandchildren