Races in Indian Trail, North Carolina (NC) Detailed Stats
Data:
Races - White alone (%)
Races - White alone (% change since 2000)
Races - Black alone (%)
Races - Black alone (% change since 2000)
Races - American Indian alone (%)
Races - American Indian alone (% change since 2000)
Races - Asian alone (%)
Races - Asian alone (% change since 2000)
Races - Hispanic (%)
Races - Hispanic (% change since 2000)
Races - Native Hawaiian and Other Pacific Islander alone (%)
Races - Native Hawaiian and Other Pacific Islander alone (% change since 2000)
Races - Two or more races(%)
Races - Two or more races(% change since 2000)
Races - Other race alone (%)
Races - Other race alone (% change since 2000)
Racial diversity
Place of birth - Born in state of residence (%)
Place of birth - Born in state of residence (%) - White
Place of birth - Born in state of residence (%) - Black or African American
Place of birth - Born in state of residence (%) - Asian
Place of birth - Born in state of residence (%) - Hispanic or Latino
Place of birth - Born in state of residence (%) - American Indian and Alaska Native
Place of birth - Born in state of residence (%) - Multirace
Place of birth - Born in state of residence (%) - Other Race
Place of birth - Born in other state (%)
Place of birth - Born in other state (%) - White
Place of birth - Born in other state (%) - Black or African American
Place of birth - Born in other state (%) - Asian
Place of birth - Born in other state (%) - Hispanic or Latino
Place of birth - Born in other state (%) - American Indian and Alaska Native
Place of birth - Born in other state (%) - Multirace
Place of birth - Born in other state (%) - Other Race
Place of birth - Native, outside of US (%)
Place of birth - Native, outside of US (%) - White
Place of birth - Native, outside of US (%) - Black or African American
Place of birth - Native, outside of US (%) - Asian
Place of birth - Native, outside of US (%) - Hispanic or Latino
Place of birth - Native, outside of US (%) - American Indian and Alaska Native
Place of birth - Native, outside of US (%) - Multirace
Place of birth - Native, outside of US (%) - Other Race
Place of birth - Foreign born (%)
Place of birth - Foreign born (%) - White
Place of birth - Foreign born (%) - Black or African American
Place of birth - Foreign born (%) - Asian
Place of birth - Foreign born (%) - Hispanic or Latino
Place of birth - Foreign born (%) - American Indian and Alaska Native
Place of birth - Foreign born (%) - Multirace
Place of birth - Foreign born (%) - Other Race
Residents speaking English at home (%)
Residents speaking English at home - Born in the United States (%)
Residents speaking English at home - Native, born elsewhere (%)
Residents speaking English at home - Foreign born (%)
Residents speaking Spanish at home (%)
Residents speaking Spanish at home - Born in the United States (%)
Residents speaking Spanish at home - Native, born elsewhere (%)
Residents speaking Spanish at home - Foreign born (%)
Residents speaking other language at home (%)
Residents speaking other language at home - Born in the United States (%)
Residents speaking other language at home - Native, born elsewhere (%)
Residents speaking other language at home - Foreign born (%)
Marital status - Never married (%)
Marital status - Now married (%)
Marital status - Separated (%)
Marital status - Widowed (%)
Marital status - Divorced (%)
Ancestries Reported - Arab (%)
Ancestries Reported - Czech (%)
Ancestries Reported - Danish (%)
Ancestries Reported - Dutch (%)
Ancestries Reported - English (%)
Ancestries Reported - French (%)
Ancestries Reported - French Canadian (%)
Ancestries Reported - German (%)
Ancestries Reported - Greek (%)
Ancestries Reported - Hungarian (%)
Ancestries Reported - Irish (%)
Ancestries Reported - Italian (%)
Ancestries Reported - Lithuanian (%)
Ancestries Reported - Norwegian (%)
Ancestries Reported - Polish (%)
Ancestries Reported - Portuguese (%)
Ancestries Reported - Russian (%)
Ancestries Reported - Scotch-Irish (%)
Ancestries Reported - Scottish (%)
Ancestries Reported - Slovak (%)
Ancestries Reported - Subsaharan African (%)
Ancestries Reported - Swedish (%)
Ancestries Reported - Swiss (%)
Ancestries Reported - Ukrainian (%)
Ancestries Reported - United States (%)
Ancestries Reported - Welsh (%)
Ancestries Reported - West Indian (%)
Ancestries Reported - Other (%)
Geographical mobility - Same house 1 year ago (%)
Geographical mobility - Same house 1 year ago (%) - White
Geographical mobility - Same house 1 year ago (%) - Black or African American
Geographical mobility - Same house 1 year ago (%) - Asian
Geographical mobility - Same house 1 year ago (%) - Hispanic or Latino
Geographical mobility - Same house 1 year ago (%) - American Indian and Alaska Native
Geographical mobility - Same house 1 year ago (%) - Multirace
Geographical mobility - Same house 1 year ago (%) - Other Race
Geographical mobility - Moved within same county (%)
Geographical mobility - Moved within same county (%) - White
Geographical mobility - Moved within same county (%) - Black or African American
Geographical mobility - Moved within same county (%) - Asian
Geographical mobility - Moved within same county (%) - Hispanic or Latino
Geographical mobility - Moved within same county (%) - American Indian and Alaska Native
Geographical mobility - Moved within same county (%) - Multirace
Geographical mobility - Moved within same county (%) - Other Race
Geographical mobility - Moved from different county within same state (%)
Geographical mobility - Moved from different county within same state (%) - White
Geographical mobility - Moved from different county within same state (%) - Black or African American
Geographical mobility - Moved from different county within same state (%) - Asian
Geographical mobility - Moved from different county within same state (%) - Hispanic or Latino
Geographical mobility - Moved from different county within same state (%) - American Indian and Alaska Native
Geographical mobility - Moved from different county within same state (%) - Multirace
Geographical mobility - Moved from different county within same state (%) - Other Race
Geographical mobility - Moved from different state (%)
Geographical mobility - Moved from different state (%) - White
Geographical mobility - Moved from different state (%) - Black or African American
Geographical mobility - Moved from different state (%) - Asian
Geographical mobility - Moved from different state (%) - Hispanic or Latino
Geographical mobility - Moved from different state (%) - American Indian and Alaska Native
Geographical mobility - Moved from different state (%) - Multirace
Geographical mobility - Moved from different state (%) - Other Race
Geographical mobility - Moved from abroad (%)
Geographical mobility - Moved from abroad (%) - White
Geographical mobility - Moved from abroad (%) - Black or African American
Geographical mobility - Moved from abroad (%) - Asian
Geographical mobility - Moved from abroad (%) - Hispanic or Latino
Geographical mobility - Moved from abroad (%) - American Indian and Alaska Native
Geographical mobility - Moved from abroad (%) - Multirace
Geographical mobility - Moved from abroad (%) - Other Race
Place of birth for the foreign-born population - Ireland (%)
Place of birth for the foreign-born population - Denmark (%)
Place of birth for the foreign-born population - Norway (%)
Place of birth for the foreign-born population - Sweden (%)
Place of birth for the foreign-born population - United Kingdom (%)
Place of birth for the foreign-born population - England (%)
Place of birth for the foreign-born population - Scotland (%)
Place of birth for the foreign-born population - Other Northern Europe (%)
Place of birth for the foreign-born population - Austria (%)
Place of birth for the foreign-born population - Belgium (%)
Place of birth for the foreign-born population - France (%)
Place of birth for the foreign-born population - Germany (%)
Place of birth for the foreign-born population - Netherlands (%)
Place of birth for the foreign-born population - Switzerland (%)
Place of birth for the foreign-born population - Other Western Europe (%)
Place of birth for the foreign-born population - Greece (%)
Place of birth for the foreign-born population - Italy (%)
Place of birth for the foreign-born population - Portugal (%)
Place of birth for the foreign-born population - Spain (%)
Place of birth for the foreign-born population - Other Southern Europe (%)
Place of birth for the foreign-born population - Albania (%)
Place of birth for the foreign-born population - Belarus (%)
Place of birth for the foreign-born population - Bosnia and Herzegovina (%)
Place of birth for the foreign-born population - Bulgaria (%)
Place of birth for the foreign-born population - Croatia (%)
Place of birth for the foreign-born population - Czechoslovakia (%)
Place of birth for the foreign-born population - Hungary (%)
Place of birth for the foreign-born population - Latvia (%)
Place of birth for the foreign-born population - Lithuania (%)
Place of birth for the foreign-born population - North Macedonia (Macedonia) (%)
Place of birth for the foreign-born population - Moldova (%)
Place of birth for the foreign-born population - Poland (%)
Place of birth for the foreign-born population - Romania (%)
Place of birth for the foreign-born population - Russia (%)
Place of birth for the foreign-born population - Serbia (%)
Place of birth for the foreign-born population - Ukraine (%)
Place of birth for the foreign-born population - Other Eastern Europe (%)
Place of birth for the foreign-born population - China (%)
Place of birth for the foreign-born population - Hong Kong (%)
Place of birth for the foreign-born population - Taiwan (%)
Place of birth for the foreign-born population - Japan (%)
Place of birth for the foreign-born population - Korea (%)
Place of birth for the foreign-born population - Other Eastern Asia (%)
Place of birth for the foreign-born population - Afghanistan (%)
Place of birth for the foreign-born population - Bangladesh (%)
Place of birth for the foreign-born population - India (%)
Place of birth for the foreign-born population - Iran (%)
Place of birth for the foreign-born population - Kazakhstan (%)
Place of birth for the foreign-born population - Nepal (%)
Place of birth for the foreign-born population - Pakistan (%)
Place of birth for the foreign-born population - Sri Lanka (%)
Place of birth for the foreign-born population - Uzbekistan (%)
Place of birth for the foreign-born population - Other South Central Asia (%)
Place of birth for the foreign-born population - Burma (%)
Place of birth for the foreign-born population - Cambodia (%)
Place of birth for the foreign-born population - Indonesia (%)
Place of birth for the foreign-born population - Laos (%)
Place of birth for the foreign-born population - Malaysia (%)
Place of birth for the foreign-born population - Philippines (%)
Place of birth for the foreign-born population - Singapore (%)
Place of birth for the foreign-born population - Thailand (%)
Place of birth for the foreign-born population - Vietnam (%)
Place of birth for the foreign-born population - Other South Eastern Asia (%)
Place of birth for the foreign-born population - Armenia (%)
Place of birth for the foreign-born population - Iraq (%)
Place of birth for the foreign-born population - Israel (%)
Place of birth for the foreign-born population - Jordan (%)
Place of birth for the foreign-born population - Kuwait (%)
Place of birth for the foreign-born population - Lebanon (%)
Place of birth for the foreign-born population - Saudi Arabia (%)
Place of birth for the foreign-born population - Syria (%)
Place of birth for the foreign-born population - Turkey (%)
Place of birth for the foreign-born population - Yemen (%)
Place of birth for the foreign-born population - Other Western Asia (%)
Place of birth for the foreign-born population - Eritrea (%)
Place of birth for the foreign-born population - Ethiopia (%)
Place of birth for the foreign-born population - Kenya (%)
Place of birth for the foreign-born population - Somalia (%)
Place of birth for the foreign-born population - Uganda (%)
Place of birth for the foreign-born population - Zimbabwe (%)
Place of birth for the foreign-born population - Other Eastern Africa (%)
Place of birth for the foreign-born population - Cameroon (%)
Place of birth for the foreign-born population - Congo (%)
Place of birth for the foreign-born population - Democratic Republic of Congo (Zaire) (%)
Place of birth for the foreign-born population - Other Middle Africa (%)
Place of birth for the foreign-born population - Egypt (%)
Place of birth for the foreign-born population - Morocco (%)
Place of birth for the foreign-born population - Sudan (%)
Place of birth for the foreign-born population - Other Northern Africa (%)
Place of birth for the foreign-born population - South Africa (%)
Place of birth for the foreign-born population - Other Southern Africa (%)
Place of birth for the foreign-born population - Cabo Verde (%)
Place of birth for the foreign-born population - Ghana (%)
Place of birth for the foreign-born population - Liberia (%)
Place of birth for the foreign-born population - Nigeria (%)
Place of birth for the foreign-born population - Senegal (%)
Place of birth for the foreign-born population - Sierra Leone (%)
Place of birth for the foreign-born population - Other Western Africa (%)
Place of birth for the foreign-born population - Australia (%)
Place of birth for the foreign-born population - New Zealand (%)
Place of birth for the foreign-born population - Fiji (%)
Place of birth for the foreign-born population - Micronesia (%)
Place of birth for the foreign-born population - Bahamas (%)
Place of birth for the foreign-born population - Barbados (%)
Place of birth for the foreign-born population - Cuba (%)
Place of birth for the foreign-born population - Dominica (%)
Place of birth for the foreign-born population - Dominican Republic (%)
Place of birth for the foreign-born population - Grenada (%)
Place of birth for the foreign-born population - Haiti (%)
Place of birth for the foreign-born population - Jamaica (%)
Place of birth for the foreign-born population - St. Vincent and the Grenadines (%)
Place of birth for the foreign-born population - Trinidad and Tobago (%)
Place of birth for the foreign-born population - West Indies (%)
Place of birth for the foreign-born population - Other Caribbean (%)
Place of birth for the foreign-born population - Belize (%)
Place of birth for the foreign-born population - Costa Rica (%)
Place of birth for the foreign-born population - El Salvador (%)
Place of birth for the foreign-born population - Guatemala (%)
Place of birth for the foreign-born population - Honduras (%)
Place of birth for the foreign-born population - Mexico (%)
Place of birth for the foreign-born population - Nicaragua (%)
Place of birth for the foreign-born population - Panama (%)
Place of birth for the foreign-born population - Other Central America (%)
Place of birth for the foreign-born population - Argentina (%)
Place of birth for the foreign-born population - Bolivia (%)
Place of birth for the foreign-born population - Brazil (%)
Place of birth for the foreign-born population - Chile (%)
Place of birth for the foreign-born population - Colombia (%)
Place of birth for the foreign-born population - Ecuador (%)
Place of birth for the foreign-born population - Guyana (%)
Place of birth for the foreign-born population - Peru (%)
Place of birth for the foreign-born population - Uruguay (%)
Place of birth for the foreign-born population - Venezuela (%)
Place of birth for the foreign-born population - Other South America (%)
Place of birth for the foreign-born population - Canada (%)
Place of birth for the foreign-born population - Other Northern America (%)
Place of birth for the foreign-born population - Other (%)
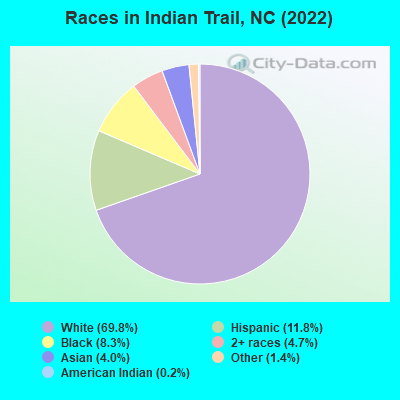
According to 2022 data, the most numerous races in Indian Trail, NC are White alone (29,205 residents), Black alone (3,451 residents), and Hispanic (4,951 residents). 80.1% of Indian Trail residents speak English at home. 12.2% of Indian Trail, NC residents are foreign-born (5.2% born in Latin America, 3.7% born in Europe, 2.4% born in Asia), which is 34.5% greater than the foreign-born rate of 8.0% across the entire state of North Carolina.
Race distribution in Indian Trail
2000 2022
5,647,155 70.2% White alone 1,723,301 21.4% Black alone 378,963 4.7% Hispanic 112,416 1.4% Asian alone 95,333 1.2% American Indian alone 79,965 1.0% Two or more races 9,015 0.1% Other race alone 3,165 0.04% Native Hawaiian and Other
6,497,519 60.7% White alone 2,155,650 20.1% Black alone 1,114,799 10.4% Hispanic 438,061 4.1% Two or more races 341,052 3.2% Asian alone 91,758 0.9% American Indian alone 50,180 0.5% Other race alone 9,954 0.09% Native Hawaiian and Other
Income and house value in Indian Trail Median household income in 2022 $84,632 White non-Hispanic householders$147,970 Black householders$178,902 American Indian and Alaska Native householders$79,708 Asian householders$86,356 Some other race householders$91,217 Two or more races householders$80,993 Hispanic or Latino race householdersMedian 2022 house value $373,513 White Non-Hispanic householders$348,437 Black or African American householders $474,481 Asian householders$385,062 Some other race householders$336,888 Two or more races householders$429,277 Hispanic or Latino householders
Median age by race in Indian Trail
37.9 Median age for White residents37.7 38.3 38.5 Median age for Black or African American residents39.4 42.0 50.9 Median age for American Indian / Alaska Native residents28.7 52.8 39.2 Median age for Asian residents41.5 37.7 -560,606,060.0 Median age for Native Hawaiian / Pacific Islander residents-666,666,666.0 -559,017,940.9 20.2 Median age for Other race residents20.1 20.9 23.9 Median age for Two or more races residents25.5 22.9 37.7 Median age for White alone residents37.9 37.6 24.9 Median age for Hispanic or Latino residents23.6 28.6
Owner/renter occupied households by race in Indian Trail
House owners and renters - White residents 8,733 82.6% Owner occupied1,837 17.4% Renter occupiedHouse owners and renters - Black or African American residents 838 75.2% Owner occupied276 24.8% Renter occupiedHouse owners and renters - American Indian / Alaska Native residents 61 100.0% Owner occupiedHouse owners and renters - Asian residents 449 97.4% Owner occupied12 2.6% Renter occupiedHouse owners and renters - Native Hawaiian / Pacific Islander residents 21 100.0% Renter occupiedHouse owners and renters - Other race residents 676 86.8% Owner occupied103 13.2% Renter occupiedHouse owners and renters - Two or more races residents 398 68.7% Owner occupied181 31.3% Renter occupiedHouse owners and renters - White alone residents 8,607 82.1% Owner occupied1,871 17.9% Renter occupiedHouse owners and renters - Hispanic or Latino residents 887 78.1% Owner occupied249 21.9% Renter occupied
Language usage in Indian Trail
English speakers - Total 80.1% of residents of Indian Trail speak English at home.
10.8% of residents speak Spanish at home 2,277 54.0% Speak English very well1,943 46.0% Speak English less than very well9.7% of residents speak other language at home 2,392 63.4% Speak English very well1,379 36.6% Speak English less than very well
English speakers - Born in the United States 92.8% of residents of Indian Trail speak English at home.
4.1% of residents speak Spanish at home 576 75.1% Speak English very well191 24.9% Speak English less than very well3.1% of residents speak other language at home 530 90.8% Speak English very well54 9.2% Speak English less than very well
English speakers - Native, born elsewhere 42.5% of residents of Indian Trail speak English at home.
63.2% of residents speak Spanish at home 266 68.7% Speak English very well121 31.3% Speak English less than very well18.6% of residents speak other language at home 114 100.0% Speak English very well
English speakers - Foreign-born 16.5% of residents of Indian Trail speak English at home.
37.8% of residents speak Spanish at home 657 29.5% Speak English very well1,573 70.5% Speak English less than very well45.4% of residents speak other language at home 1,459 54.5% Speak English very well1,219 45.5% Speak English less than very well
White (Caucasian) - Speak only English Native:
97.3% (25,134)Foreign-born:
15.1% (240)
White (Caucasian) - Speak another language Native:
2.7% (694)Foreign-born:
80.4% (1,278)
Black or African American - Speak only English Native:
99.1% (3,099)Foreign-born:
89.2% (297)
Black or African American - Speak another language Native:
1.0% (30)Foreign-born:
11.8% (39)
American Indian / Alaska Native - Speak only English Native:
97.4% (55)Foreign-born:
25.3% (13)
Asian - Speak only English Native:
37.2% (208)Foreign-born:
11.1% (110)
Asian - Speak another language Native:
64.1% (358)Foreign-born:
84.9% (844)
Other race - Speak only English Native:
40.2% (731)Foreign-born:
1.2% (24)
Other race - Speak another language Native:
61.6% (1,121)Foreign-born:
99.3% (1,941)
Two or more races - Speak only English Native:
67.4% (1,578)Foreign-born:
4.4% (27)
Two or more races - Speak another language Native:
36.2% (848)Foreign-born:
96.3% (600)
White alone - Speak only English Native:
96.7% (24,897)Foreign-born:
13.3% (255)
White alone - Speak another language Native:
3.4% (870)Foreign-born:
89.8% (1,729)
Hispanic or Latino - Speak only English Native:
32.6% (705)Foreign-born:
1.2% (27)
Hispanic or Latino - Speak another language Native:
66.7% (1,443)Foreign-born:
97.8% (2,229)
Foreign-born residents in Indian Trail 5,111 residents are foreign born (5.2% Latin America , 3.7% Europe , 2.4% Asia ).
This city:
12.2%North Carolina:
8.3%
Marital status for residents in Indian Trail Marital status - White (Caucasian) population 15 years and over
Males 26.0% Never married64.9% Now married1.6% Separated1.9% Widowed5.6% DivorcedFemales 22.7% Never married60.5% Now married1.8% Separated4.6% Widowed10.4% DivorcedWomen who gave birth in the past 12 months Now married:
79.7% (342)Unmarried:
20.3% (87)
Women who did not give birth in the past 12 months Now married:
57.8% (3,947)Unmarried:
42.2% (2,878)
Marital status - Black or African American population 15 years and over
Males 32.2% Never married57.7% Now married0.5% Separated0.9% Widowed8.7% DivorcedFemales 31.0% Never married53.3% Now married0.4% Separated3.8% Widowed11.5% DivorcedWomen who gave birth in the past 12 months Now married:
100.0% (36)Unmarried:
0.0% (0)
Women who did not give birth in the past 12 months Now married:
45.2% (367)Unmarried:
54.8% (445)
Marital status - American Indian / Alaska Native population 15 years and over
Males 9.1% Never married90.9% Now married0.0% Separated0.0% Widowed0.0% DivorcedFemales 0.0% Never married54.3% Now married0.0% Separated0.0% Widowed45.7% DivorcedWomen who did not give birth in the past 12 months Now married:
14.3% (4)Unmarried:
85.7% (25)
Marital status - Asian population 15 years and over
Males 24.4% Never married64.9% Now married0.0% Separated10.6% Widowed0.0% DivorcedFemales 27.3% Never married55.9% Now married0.0% Separated12.2% Widowed4.5% DivorcedWomen who gave birth in the past 12 months Now married:
100.0% (25)Unmarried:
0.0% (0)
Women who did not give birth in the past 12 months Now married:
48.1% (177)Unmarried:
51.9% (191)
Marital status - Other race population 15 years and over
Males 38.6% Never married50.3% Now married5.5% Separated0.0% Widowed5.5% DivorcedFemales 44.1% Never married39.1% Now married3.7% Separated4.4% Widowed8.7% DivorcedWomen who gave birth in the past 12 months Now married:
100.0% (21)Unmarried:
0.0% (0)
Women who did not give birth in the past 12 months Now married:
38.0% (322)Unmarried:
62.0% (525)
Marital status - Two or more races population 15 years and over
Males 42.0% Never married55.4% Now married0.0% Separated0.0% Widowed2.6% DivorcedFemales 37.7% Never married55.3% Now married4.2% Separated0.0% Widowed2.9% DivorcedWomen who did not give birth in the past 12 months Now married:
46.8% (328)Unmarried:
53.2% (374)
Marital status - White alone, not Hispanic / Latino population 15 years and over
Males 25.0% Never married65.7% Now married1.7% Separated2.0% Widowed5.7% DivorcedFemales 22.4% Never married60.3% Now married1.9% Separated4.7% Widowed10.7% DivorcedWomen who gave birth in the past 12 months Now married:
70.1% (218)Unmarried:
29.9% (93)
Women who did not give birth in the past 12 months Now married:
58.5% (4,135)Unmarried:
41.5% (2,932)
Marital status - Hispanic or Latino population 15 years and over
Males 39.2% Never married53.6% Now married3.1% Separated0.0% Widowed4.1% DivorcedFemales 34.9% Never married54.0% Now married3.0% Separated0.8% Widowed7.2% DivorcedWomen who gave birth in the past 12 months Now married:
100.0% (181)Unmarried:
0.0% (0)
Women who did not give birth in the past 12 months Now married:
43.3% (479)Unmarried:
56.7% (626)
Ancestries in Indian Trail
2,398 13.1% English2,322 12.7% American1,258 6.9% German1,098 6.0% Irish890 4.9% Italian503 2.8% Russian500 2.7% Ukrainian307 1.7% Scotch-Irish280 1.5% European248 1.4% Polish148 0.8% French144 0.8% Scottish136 0.7% Romanian111 0.6% African103 0.6% Bulgarian90 0.5% Moroccan78 0.4% Lebanese77 0.4% Dutch75 0.4% Yugoslavian66 0.4% Eastern European63 0.3% Albanian55 0.3% French Canadian54 0.3% Brazilian52 0.3% Norwegian51 0.3% Jamaican42 0.2% Liberian40 0.2% Syrian40 0.2% Scandinavian33 0.2% British29 0.2% Slavic25 0.1% Czech24 0.1% Palestinian24 0.1% Greek23 0.1% Portuguese22 0.1% Slovak22 0.1% Turkish21 0.1% Armenian16 0.09% Belgian16 0.09% Hungarian16 0.09% Belizean15 0.08% Jordanian11 0.06% Lithuanian11 0.06% Welsh8 0.04% Iranian7 0.04% Swedish6 0.03% Cypriot5 0.03% Northern European
Geographical mobility in Indian Trail Same house 1 year ago 25,935 89.1% White (Caucasian)2,771 82.2% Black or African American90 93.7% American Indian / Alaska Native1,054 75.4% Asian3,568 90.1% Other race2,941 86.4% Two or more races25,716 88.7% White alone, not Hispanic / Latino4,483 94.1% Hispanic or LatinoMoved within same county 812 2.8% White / Caucasian6 5.8% American Indian / Alaska Native14 1.0% Asian280 7.1% Other race169 5.0% Two or more races908 3.1% White alone, not Hispanic / Latino68 1.4% Hispanic or LatinoMoved within same state 836 2.9% White / Caucasian482 14.3% Black or African American91 6.5% Asian35 100.0% Native Hawaiian / Pacific Islander39 1.0% Other race135 4.0% Two or more races875 3.0% White alone, not Hispanic / Latino62 1.3% Hispanic or LatinoMoved from different state 1,410 4.8% White / Caucasian64 1.9% Black or African American202 14.4% Asian66 1.9% Two or more races1,464 5.0% White alone, not Hispanic / LatinoMoved from abroad 251 0.9% White94 2.8% Two or more races99 0.3% White alone, not Hispanic / Latino238 5.0% Hispanic or Latino
Children Nativity (place of birth) in Indian Trail
Children under 6 years - Living with two parents Both parents native 2,311 100.0% Native0 0.0% Foreign-bornBoth parents foreign-born 456 82.5% Native97 17.5% Foreign-bornOne native, one foreign-born parent 140 100.0% NativeChildren under 6 years - Living with one parent Native parent 296 100.0% NativeForeign-born parent 81 100.0% NativeChildren 6 to 17 years - Living with two parents Both parents native 4,705 100.0% NativeBoth parents foreign-born 837 72.9% Native311 27.1% Foreign-bornOne native, one foreign-born parent 470 100.0% NativeChildren 6 to 17 years - Living with one parent Native parent 1,051 100.0% NativeForeign-born parent 196 48.4% Native209 51.6% Foreign-born
Grandparents responsible for own grandchildren in Indian Trail
Grandparents (30 to 59 years) White / Caucasian 45 14.6% Responsible for grandchildren264 85.4% Not responsible for grandchildrenBlack or African American 12 15.7% Responsible for grandchildren66 84.3% Not responsible for grandchildrenAmerican Indian / Alaska Native 40 100.0% Not responsible for grandchildrenAsian 15 100.0% Not responsible for grandchildrenOther race 13 100.0% Not responsible for grandchildrenWhite alone, not Hispanic / Latino 48 14.8% Responsible for grandchildren275 85.2% Not responsible for grandchildrenHispanic or Latino 25 100.0% Not responsible for grandchildrenGrandparents (60 years and over) White / Caucasian 17 5.3% Responsible for grandchildren297 94.7% Not responsible for grandchildrenBlack or African American 7 100.0% Not responsible for grandchildrenAsian 44 100.0% Not responsible for grandchildrenOther race 45 100.0% Not responsible for grandchildrenWhite alone, not Hispanic / Latino 17 10.9% Responsible for grandchildren137 89.1% Not responsible for grandchildrenHispanic or Latino 108 100.0% Not responsible for grandchildren