Races in Independent Hill, Virginia (VA) Detailed Stats
Data:
Races - White alone (%)
Races - White alone (% change since 2000)
Races - Black alone (%)
Races - Black alone (% change since 2000)
Races - American Indian alone (%)
Races - American Indian alone (% change since 2000)
Races - Asian alone (%)
Races - Asian alone (% change since 2000)
Races - Hispanic (%)
Races - Hispanic (% change since 2000)
Races - Native Hawaiian and Other Pacific Islander alone (%)
Races - Native Hawaiian and Other Pacific Islander alone (% change since 2000)
Races - Two or more races(%)
Races - Two or more races(% change since 2000)
Races - Other race alone (%)
Races - Other race alone (% change since 2000)
Racial diversity
Place of birth - Born in state of residence (%)
Place of birth - Born in state of residence (%) - White
Place of birth - Born in state of residence (%) - Black or African American
Place of birth - Born in state of residence (%) - Asian
Place of birth - Born in state of residence (%) - Hispanic or Latino
Place of birth - Born in state of residence (%) - American Indian and Alaska Native
Place of birth - Born in state of residence (%) - Multirace
Place of birth - Born in state of residence (%) - Other Race
Place of birth - Born in other state (%)
Place of birth - Born in other state (%) - White
Place of birth - Born in other state (%) - Black or African American
Place of birth - Born in other state (%) - Asian
Place of birth - Born in other state (%) - Hispanic or Latino
Place of birth - Born in other state (%) - American Indian and Alaska Native
Place of birth - Born in other state (%) - Multirace
Place of birth - Born in other state (%) - Other Race
Place of birth - Native, outside of US (%)
Place of birth - Native, outside of US (%) - White
Place of birth - Native, outside of US (%) - Black or African American
Place of birth - Native, outside of US (%) - Asian
Place of birth - Native, outside of US (%) - Hispanic or Latino
Place of birth - Native, outside of US (%) - American Indian and Alaska Native
Place of birth - Native, outside of US (%) - Multirace
Place of birth - Native, outside of US (%) - Other Race
Place of birth - Foreign born (%)
Place of birth - Foreign born (%) - White
Place of birth - Foreign born (%) - Black or African American
Place of birth - Foreign born (%) - Asian
Place of birth - Foreign born (%) - Hispanic or Latino
Place of birth - Foreign born (%) - American Indian and Alaska Native
Place of birth - Foreign born (%) - Multirace
Place of birth - Foreign born (%) - Other Race
Residents speaking English at home (%)
Residents speaking English at home - Born in the United States (%)
Residents speaking English at home - Native, born elsewhere (%)
Residents speaking English at home - Foreign born (%)
Residents speaking Spanish at home (%)
Residents speaking Spanish at home - Born in the United States (%)
Residents speaking Spanish at home - Native, born elsewhere (%)
Residents speaking Spanish at home - Foreign born (%)
Residents speaking other language at home (%)
Residents speaking other language at home - Born in the United States (%)
Residents speaking other language at home - Native, born elsewhere (%)
Residents speaking other language at home - Foreign born (%)
Marital status - Never married (%)
Marital status - Now married (%)
Marital status - Separated (%)
Marital status - Widowed (%)
Marital status - Divorced (%)
Ancestries Reported - Arab (%)
Ancestries Reported - Czech (%)
Ancestries Reported - Danish (%)
Ancestries Reported - Dutch (%)
Ancestries Reported - English (%)
Ancestries Reported - French (%)
Ancestries Reported - French Canadian (%)
Ancestries Reported - German (%)
Ancestries Reported - Greek (%)
Ancestries Reported - Hungarian (%)
Ancestries Reported - Irish (%)
Ancestries Reported - Italian (%)
Ancestries Reported - Lithuanian (%)
Ancestries Reported - Norwegian (%)
Ancestries Reported - Polish (%)
Ancestries Reported - Portuguese (%)
Ancestries Reported - Russian (%)
Ancestries Reported - Scotch-Irish (%)
Ancestries Reported - Scottish (%)
Ancestries Reported - Slovak (%)
Ancestries Reported - Subsaharan African (%)
Ancestries Reported - Swedish (%)
Ancestries Reported - Swiss (%)
Ancestries Reported - Ukrainian (%)
Ancestries Reported - United States (%)
Ancestries Reported - Welsh (%)
Ancestries Reported - West Indian (%)
Ancestries Reported - Other (%)
Geographical mobility - Same house 1 year ago (%)
Geographical mobility - Same house 1 year ago (%) - White
Geographical mobility - Same house 1 year ago (%) - Black or African American
Geographical mobility - Same house 1 year ago (%) - Asian
Geographical mobility - Same house 1 year ago (%) - Hispanic or Latino
Geographical mobility - Same house 1 year ago (%) - American Indian and Alaska Native
Geographical mobility - Same house 1 year ago (%) - Multirace
Geographical mobility - Same house 1 year ago (%) - Other Race
Geographical mobility - Moved within same county (%)
Geographical mobility - Moved within same county (%) - White
Geographical mobility - Moved within same county (%) - Black or African American
Geographical mobility - Moved within same county (%) - Asian
Geographical mobility - Moved within same county (%) - Hispanic or Latino
Geographical mobility - Moved within same county (%) - American Indian and Alaska Native
Geographical mobility - Moved within same county (%) - Multirace
Geographical mobility - Moved within same county (%) - Other Race
Geographical mobility - Moved from different county within same state (%)
Geographical mobility - Moved from different county within same state (%) - White
Geographical mobility - Moved from different county within same state (%) - Black or African American
Geographical mobility - Moved from different county within same state (%) - Asian
Geographical mobility - Moved from different county within same state (%) - Hispanic or Latino
Geographical mobility - Moved from different county within same state (%) - American Indian and Alaska Native
Geographical mobility - Moved from different county within same state (%) - Multirace
Geographical mobility - Moved from different county within same state (%) - Other Race
Geographical mobility - Moved from different state (%)
Geographical mobility - Moved from different state (%) - White
Geographical mobility - Moved from different state (%) - Black or African American
Geographical mobility - Moved from different state (%) - Asian
Geographical mobility - Moved from different state (%) - Hispanic or Latino
Geographical mobility - Moved from different state (%) - American Indian and Alaska Native
Geographical mobility - Moved from different state (%) - Multirace
Geographical mobility - Moved from different state (%) - Other Race
Geographical mobility - Moved from abroad (%)
Geographical mobility - Moved from abroad (%) - White
Geographical mobility - Moved from abroad (%) - Black or African American
Geographical mobility - Moved from abroad (%) - Asian
Geographical mobility - Moved from abroad (%) - Hispanic or Latino
Geographical mobility - Moved from abroad (%) - American Indian and Alaska Native
Geographical mobility - Moved from abroad (%) - Multirace
Geographical mobility - Moved from abroad (%) - Other Race
Place of birth for the foreign-born population - Ireland (%)
Place of birth for the foreign-born population - Denmark (%)
Place of birth for the foreign-born population - Norway (%)
Place of birth for the foreign-born population - Sweden (%)
Place of birth for the foreign-born population - United Kingdom (%)
Place of birth for the foreign-born population - England (%)
Place of birth for the foreign-born population - Scotland (%)
Place of birth for the foreign-born population - Other Northern Europe (%)
Place of birth for the foreign-born population - Austria (%)
Place of birth for the foreign-born population - Belgium (%)
Place of birth for the foreign-born population - France (%)
Place of birth for the foreign-born population - Germany (%)
Place of birth for the foreign-born population - Netherlands (%)
Place of birth for the foreign-born population - Switzerland (%)
Place of birth for the foreign-born population - Other Western Europe (%)
Place of birth for the foreign-born population - Greece (%)
Place of birth for the foreign-born population - Italy (%)
Place of birth for the foreign-born population - Portugal (%)
Place of birth for the foreign-born population - Spain (%)
Place of birth for the foreign-born population - Other Southern Europe (%)
Place of birth for the foreign-born population - Albania (%)
Place of birth for the foreign-born population - Belarus (%)
Place of birth for the foreign-born population - Bosnia and Herzegovina (%)
Place of birth for the foreign-born population - Bulgaria (%)
Place of birth for the foreign-born population - Croatia (%)
Place of birth for the foreign-born population - Czechoslovakia (%)
Place of birth for the foreign-born population - Hungary (%)
Place of birth for the foreign-born population - Latvia (%)
Place of birth for the foreign-born population - Lithuania (%)
Place of birth for the foreign-born population - North Macedonia (Macedonia) (%)
Place of birth for the foreign-born population - Moldova (%)
Place of birth for the foreign-born population - Poland (%)
Place of birth for the foreign-born population - Romania (%)
Place of birth for the foreign-born population - Russia (%)
Place of birth for the foreign-born population - Serbia (%)
Place of birth for the foreign-born population - Ukraine (%)
Place of birth for the foreign-born population - Other Eastern Europe (%)
Place of birth for the foreign-born population - China (%)
Place of birth for the foreign-born population - Hong Kong (%)
Place of birth for the foreign-born population - Taiwan (%)
Place of birth for the foreign-born population - Japan (%)
Place of birth for the foreign-born population - Korea (%)
Place of birth for the foreign-born population - Other Eastern Asia (%)
Place of birth for the foreign-born population - Afghanistan (%)
Place of birth for the foreign-born population - Bangladesh (%)
Place of birth for the foreign-born population - India (%)
Place of birth for the foreign-born population - Iran (%)
Place of birth for the foreign-born population - Kazakhstan (%)
Place of birth for the foreign-born population - Nepal (%)
Place of birth for the foreign-born population - Pakistan (%)
Place of birth for the foreign-born population - Sri Lanka (%)
Place of birth for the foreign-born population - Uzbekistan (%)
Place of birth for the foreign-born population - Other South Central Asia (%)
Place of birth for the foreign-born population - Burma (%)
Place of birth for the foreign-born population - Cambodia (%)
Place of birth for the foreign-born population - Indonesia (%)
Place of birth for the foreign-born population - Laos (%)
Place of birth for the foreign-born population - Malaysia (%)
Place of birth for the foreign-born population - Philippines (%)
Place of birth for the foreign-born population - Singapore (%)
Place of birth for the foreign-born population - Thailand (%)
Place of birth for the foreign-born population - Vietnam (%)
Place of birth for the foreign-born population - Other South Eastern Asia (%)
Place of birth for the foreign-born population - Armenia (%)
Place of birth for the foreign-born population - Iraq (%)
Place of birth for the foreign-born population - Israel (%)
Place of birth for the foreign-born population - Jordan (%)
Place of birth for the foreign-born population - Kuwait (%)
Place of birth for the foreign-born population - Lebanon (%)
Place of birth for the foreign-born population - Saudi Arabia (%)
Place of birth for the foreign-born population - Syria (%)
Place of birth for the foreign-born population - Turkey (%)
Place of birth for the foreign-born population - Yemen (%)
Place of birth for the foreign-born population - Other Western Asia (%)
Place of birth for the foreign-born population - Eritrea (%)
Place of birth for the foreign-born population - Ethiopia (%)
Place of birth for the foreign-born population - Kenya (%)
Place of birth for the foreign-born population - Somalia (%)
Place of birth for the foreign-born population - Uganda (%)
Place of birth for the foreign-born population - Zimbabwe (%)
Place of birth for the foreign-born population - Other Eastern Africa (%)
Place of birth for the foreign-born population - Cameroon (%)
Place of birth for the foreign-born population - Congo (%)
Place of birth for the foreign-born population - Democratic Republic of Congo (Zaire) (%)
Place of birth for the foreign-born population - Other Middle Africa (%)
Place of birth for the foreign-born population - Egypt (%)
Place of birth for the foreign-born population - Morocco (%)
Place of birth for the foreign-born population - Sudan (%)
Place of birth for the foreign-born population - Other Northern Africa (%)
Place of birth for the foreign-born population - South Africa (%)
Place of birth for the foreign-born population - Other Southern Africa (%)
Place of birth for the foreign-born population - Cabo Verde (%)
Place of birth for the foreign-born population - Ghana (%)
Place of birth for the foreign-born population - Liberia (%)
Place of birth for the foreign-born population - Nigeria (%)
Place of birth for the foreign-born population - Senegal (%)
Place of birth for the foreign-born population - Sierra Leone (%)
Place of birth for the foreign-born population - Other Western Africa (%)
Place of birth for the foreign-born population - Australia (%)
Place of birth for the foreign-born population - New Zealand (%)
Place of birth for the foreign-born population - Fiji (%)
Place of birth for the foreign-born population - Micronesia (%)
Place of birth for the foreign-born population - Bahamas (%)
Place of birth for the foreign-born population - Barbados (%)
Place of birth for the foreign-born population - Cuba (%)
Place of birth for the foreign-born population - Dominica (%)
Place of birth for the foreign-born population - Dominican Republic (%)
Place of birth for the foreign-born population - Grenada (%)
Place of birth for the foreign-born population - Haiti (%)
Place of birth for the foreign-born population - Jamaica (%)
Place of birth for the foreign-born population - St. Vincent and the Grenadines (%)
Place of birth for the foreign-born population - Trinidad and Tobago (%)
Place of birth for the foreign-born population - West Indies (%)
Place of birth for the foreign-born population - Other Caribbean (%)
Place of birth for the foreign-born population - Belize (%)
Place of birth for the foreign-born population - Costa Rica (%)
Place of birth for the foreign-born population - El Salvador (%)
Place of birth for the foreign-born population - Guatemala (%)
Place of birth for the foreign-born population - Honduras (%)
Place of birth for the foreign-born population - Mexico (%)
Place of birth for the foreign-born population - Nicaragua (%)
Place of birth for the foreign-born population - Panama (%)
Place of birth for the foreign-born population - Other Central America (%)
Place of birth for the foreign-born population - Argentina (%)
Place of birth for the foreign-born population - Bolivia (%)
Place of birth for the foreign-born population - Brazil (%)
Place of birth for the foreign-born population - Chile (%)
Place of birth for the foreign-born population - Colombia (%)
Place of birth for the foreign-born population - Ecuador (%)
Place of birth for the foreign-born population - Guyana (%)
Place of birth for the foreign-born population - Peru (%)
Place of birth for the foreign-born population - Uruguay (%)
Place of birth for the foreign-born population - Venezuela (%)
Place of birth for the foreign-born population - Other South America (%)
Place of birth for the foreign-born population - Canada (%)
Place of birth for the foreign-born population - Other Northern America (%)
Place of birth for the foreign-born population - Other (%)
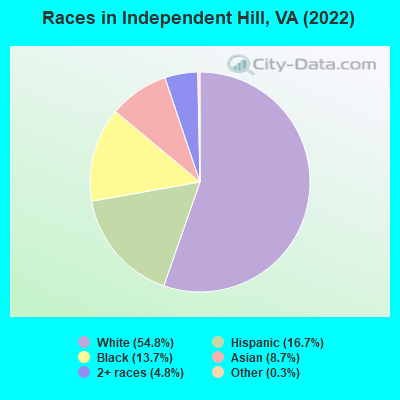
According to 2022 data, the most numerous races in Independent Hill, VA are White alone (5,468 residents), Black alone (1,366 residents), and Hispanic (1,668 residents). 82.6% of Independent Hill residents speak English at home.
Race distribution in Independent Hill 5,468 54.8% White alone 1,668 16.7% Hispanic 1,366 13.7% Black alone 867 8.7% Asian alone 479 4.8% Two or more races 25 0.3% Other race alone 7 0.07% American Indian alone
2000 2022
4,965,637 70.2% White alone 1,376,378 19.4% Black alone 329,540 4.7% Hispanic 259,277 3.7% Asian alone 114,022 1.6% Two or more races 18,596 0.3% American Indian alone 11,685 0.2% Other race alone 3,380 0.05% Native Hawaiian and Other
5,095,130 58.7% White alone 1,594,785 18.4% Black alone 905,750 10.4% Hispanic 602,881 6.9% Asian alone 406,047 4.7% Two or more races 60,419 0.7% Other race alone 11,738 0.1% American Indian alone 6,869 0.08% Native Hawaiian and Other
Income and house value in Independent Hill Median household income in 2022 $185,017 White non-Hispanic householdersover $200,000 Black householders$188,210 Asian householders$173,591 Some other race householdersover $200,000 Two or more races householdersover $200,000 Hispanic or Latino race householders
Median age by race in Independent Hill
40.1 Median age for White residents40.2 39.3 43.1 Median age for Black or African American residents42.6 42.9 52.1 Median age for American Indian / Alaska Native residents-649,621,211.5 -670,886,075.3 38.2 Median age for Asian residents40.2 36.0 -611,955,419.9 Median age for Native Hawaiian / Pacific Islander residents-541,531,822.5 -714,150,046.8 34.4 Median age for Other race residents30.1 35.8 28.6 Median age for Two or more races residents16.3 43.9 39.1 Median age for White alone residents39.3 38.2 38.3 Median age for Hispanic or Latino residents27.5 42.7
Owner/renter occupied households by race in Independent Hill
House owners and renters - White residents 1,618 95.3% Owner occupied80 4.7% Renter occupiedHouse owners and renters - Black or African American residents 463 100.0% Owner occupiedHouse owners and renters - American Indian / Alaska Native residents 28 100.0% Owner occupiedHouse owners and renters - Asian residents 246 100.0% Owner occupiedHouse owners and renters - Other race residents 67 100.0% Owner occupiedHouse owners and renters - Two or more races residents 524 95.1% Owner occupied27 4.9% Renter occupiedHouse owners and renters - White alone residents 1,585 94.4% Owner occupied95 5.6% Renter occupiedHouse owners and renters - Hispanic or Latino residents 520 100.0% Owner occupied
Language usage in Independent Hill
English speakers - Total 82.6% of residents of Independent Hill speak English at home.
8.3% of residents speak Spanish at home 515 65.0% Speak English very well277 35.0% Speak English less than very well8.8% of residents speak other language at home 517 62.1% Speak English very well316 37.9% Speak English less than very well
English speakers - Born in the United States 94.6% of residents of Independent Hill speak English at home.
3.9% of residents speak Spanish at home 159 91.4% Speak English very well15 8.6% Speak English less than very well1.3% of residents speak other language at home 57 100.0% Speak English very well
English speakers - Native, born elsewhere 64.4% of residents of Independent Hill speak English at home.
24.6% of residents speak Spanish at home 66 70.2% Speak English very well28 29.8% Speak English less than very well4.5% of residents speak other language at home 17 100.0% Speak English very well
English speakers - Foreign-born 12.9% of residents of Independent Hill speak English at home.
33.5% of residents speak Spanish at home 168 41.5% Speak English very well237 58.5% Speak English less than very well53.4% of residents speak other language at home 384 59.5% Speak English very well261 40.5% Speak English less than very well
White (Caucasian) - Speak only English Native:
99.0% (5,041)Foreign-born:
15.8% (21)
White (Caucasian) - Speak another language Native:
3.2% (162)Foreign-born:
84.5% (114)
Black or African American - Speak only English Native:
97.9% (1,275)Foreign-born:
24.0% (26)
Black or African American - Speak another language Native:
1.7% (23)Foreign-born:
68.1% (73)
Asian - Speak only English Native:
48.5% (125)Foreign-born:
15.8% (89)
Asian - Speak another language Native:
47.3% (122)Foreign-born:
84.1% (471)
Other race - Speak only English Native:
37.2% (86)Foreign-born:
2.3% (6)
Other race - Speak another language Native:
62.7% (145)Foreign-born:
95.5% (252)
Two or more races - Speak another language Native:
4.6% (62)Foreign-born:
98.5% (59)
White alone - Speak only English Native:
99.2% (5,048)Foreign-born:
19.7% (24)
White alone - Speak another language Native:
1.1% (57)Foreign-born:
79.9% (98)
Hispanic or Latino - Speak another language Native:
31.2% (366)Foreign-born:
96.9% (391)
Foreign-born residents in Independent Hill
Marital status for residents in Independent Hill Marital status - White (Caucasian) population 15 years and over
Males 18.6% Never married77.9% Now married0.0% Separated2.3% Widowed1.3% DivorcedFemales 24.9% Never married66.7% Now married0.8% Separated2.5% Widowed5.2% DivorcedWomen who gave birth in the past 12 months Now married:
41.7% (21)Unmarried:
58.3% (29)
Women who did not give birth in the past 12 months Now married:
60.5% (781)Unmarried:
39.5% (510)
Marital status - Black or African American population 15 years and over
Males 18.3% Never married69.7% Now married0.0% Separated1.8% Widowed10.2% DivorcedFemales 41.4% Never married52.4% Now married0.5% Separated2.5% Widowed3.2% DivorcedWomen who did not give birth in the past 12 months Now married:
40.6% (174)Unmarried:
59.4% (255)
Marital status - American Indian / Alaska Native population 15 years and over
Males 35.9% Never married64.1% Now married0.0% Separated0.0% Widowed0.0% DivorcedFemales 0.0% Never married100.0% Now married0.0% Separated0.0% Widowed0.0% DivorcedMarital status - Asian population 15 years and over
Males 14.4% Never married78.1% Now married0.0% Separated0.0% Widowed7.4% DivorcedFemales 38.7% Never married49.7% Now married0.0% Separated2.4% Widowed9.1% DivorcedWomen who gave birth in the past 12 months Now married:
100.0% (21)Unmarried:
0.0% (0)
Women who did not give birth in the past 12 months Now married:
51.9% (126)Unmarried:
48.1% (117)
Marital status - Other race population 15 years and over
Males 42.6% Never married57.4% Now married0.0% Separated0.0% Widowed0.0% DivorcedFemales 33.9% Never married24.0% Now married0.0% Separated10.5% Widowed31.6% DivorcedWomen who did not give birth in the past 12 months Now married:
35.4% (45)Unmarried:
64.6% (82)
Marital status - Two or more races population 15 years and over
Males 46.6% Never married48.2% Now married0.0% Separated5.2% Widowed0.0% DivorcedFemales 17.8% Never married71.7% Now married3.7% Separated0.0% Widowed6.7% DivorcedWomen who did not give birth in the past 12 months Now married:
77.7% (280)Unmarried:
22.3% (80)
Marital status - White alone, not Hispanic / Latino population 15 years and over
Males 19.2% Never married77.0% Now married0.0% Separated2.4% Widowed1.4% DivorcedFemales 24.8% Never married66.0% Now married0.8% Separated2.7% Widowed5.6% DivorcedWomen who gave birth in the past 12 months Now married:
100.0% (24)Unmarried:
0.0% (0)
Women who did not give birth in the past 12 months Now married:
58.4% (810)Unmarried:
41.6% (578)
Marital status - Hispanic or Latino population 15 years and over
Males 33.6% Never married64.5% Now married0.0% Separated1.8% Widowed0.0% DivorcedFemales 20.4% Never married66.3% Now married0.0% Separated3.3% Widowed9.9% DivorcedWomen who gave birth in the past 12 months Now married:
0.0% (0)Unmarried:
100.0% (36)
Women who did not give birth in the past 12 months Now married:
77.7% (289)Unmarried:
22.3% (83)
Ancestries in Independent Hill
357 9.1% German327 8.3% English318 8.1% Irish185 4.7% American177 4.5% European122 3.1% Afghan97 2.5% Italian56 1.4% Norwegian40 1.0% African35 0.9% Ghanaian26 0.7% Portuguese25 0.6% Ukrainian24 0.6% Greek20 0.5% Polish18 0.5% Swedish16 0.4% Slovak13 0.3% Palestinian13 0.3% Brazilian11 0.3% Austrian11 0.3% Czech11 0.3% Russian10 0.3% Lithuanian8 0.2% Croatian8 0.2% French7 0.2% British7 0.2% French Canadian4 0.1% Canadian4 0.1% Yugoslavian3 0.08% Eastern European
Children Nativity (place of birth) in Independent Hill
Children under 6 years - Living with two parents Both parents native 376 100.0% NativeBoth parents foreign-born 54 100.0% NativeOne native, one foreign-born parent 40 100.0% NativeChildren under 6 years - Living with one parent Native parent 42 100.0% NativeForeign-born parent 48 100.0% Foreign-bornChildren 6 to 17 years - Living with two parents Both parents native 1,313 99.4% Native8 0.6% Foreign-bornBoth parents foreign-born 112 54.3% Native94 45.7% Foreign-bornOne native, one foreign-born parent 227 98.3% Native4 1.7% Foreign-bornChildren 6 to 17 years - Living with one parent Native parent 128 100.0% NativeForeign-born parent 66 48.4% Native70 51.6% Foreign-born
Grandparents responsible for own grandchildren in Independent Hill
Grandparents (30 to 59 years) White / Caucasian 34 39.6% Responsible for grandchildren52 60.4% Not responsible for grandchildrenOther race 6 100.0% Not responsible for grandchildrenWhite alone, not Hispanic / Latino 74 100.0% Not responsible for grandchildrenHispanic or Latino 60 95.0% Responsible for grandchildren3 5.0% Not responsible for grandchildrenGrandparents (60 years and over) White / Caucasian 57 100.0% Not responsible for grandchildrenOther race 8 10.0% Responsible for grandchildren76 90.0% Not responsible for grandchildrenWhite alone, not Hispanic / Latino 14 100.0% Not responsible for grandchildrenHispanic or Latino 7 8.0% Responsible for grandchildren79 92.0% Not responsible for grandchildren