Races in Idylwood, Virginia (VA) Detailed Stats
Data:
Races - White alone (%)
Races - White alone (% change since 2000)
Races - Black alone (%)
Races - Black alone (% change since 2000)
Races - American Indian alone (%)
Races - American Indian alone (% change since 2000)
Races - Asian alone (%)
Races - Asian alone (% change since 2000)
Races - Hispanic (%)
Races - Hispanic (% change since 2000)
Races - Native Hawaiian and Other Pacific Islander alone (%)
Races - Native Hawaiian and Other Pacific Islander alone (% change since 2000)
Races - Two or more races(%)
Races - Two or more races(% change since 2000)
Races - Other race alone (%)
Races - Other race alone (% change since 2000)
Racial diversity
Place of birth - Born in state of residence (%)
Place of birth - Born in state of residence (%) - White
Place of birth - Born in state of residence (%) - Black or African American
Place of birth - Born in state of residence (%) - Asian
Place of birth - Born in state of residence (%) - Hispanic or Latino
Place of birth - Born in state of residence (%) - American Indian and Alaska Native
Place of birth - Born in state of residence (%) - Multirace
Place of birth - Born in state of residence (%) - Other Race
Place of birth - Born in other state (%)
Place of birth - Born in other state (%) - White
Place of birth - Born in other state (%) - Black or African American
Place of birth - Born in other state (%) - Asian
Place of birth - Born in other state (%) - Hispanic or Latino
Place of birth - Born in other state (%) - American Indian and Alaska Native
Place of birth - Born in other state (%) - Multirace
Place of birth - Born in other state (%) - Other Race
Place of birth - Native, outside of US (%)
Place of birth - Native, outside of US (%) - White
Place of birth - Native, outside of US (%) - Black or African American
Place of birth - Native, outside of US (%) - Asian
Place of birth - Native, outside of US (%) - Hispanic or Latino
Place of birth - Native, outside of US (%) - American Indian and Alaska Native
Place of birth - Native, outside of US (%) - Multirace
Place of birth - Native, outside of US (%) - Other Race
Place of birth - Foreign born (%)
Place of birth - Foreign born (%) - White
Place of birth - Foreign born (%) - Black or African American
Place of birth - Foreign born (%) - Asian
Place of birth - Foreign born (%) - Hispanic or Latino
Place of birth - Foreign born (%) - American Indian and Alaska Native
Place of birth - Foreign born (%) - Multirace
Place of birth - Foreign born (%) - Other Race
Residents speaking English at home (%)
Residents speaking English at home - Born in the United States (%)
Residents speaking English at home - Native, born elsewhere (%)
Residents speaking English at home - Foreign born (%)
Residents speaking Spanish at home (%)
Residents speaking Spanish at home - Born in the United States (%)
Residents speaking Spanish at home - Native, born elsewhere (%)
Residents speaking Spanish at home - Foreign born (%)
Residents speaking other language at home (%)
Residents speaking other language at home - Born in the United States (%)
Residents speaking other language at home - Native, born elsewhere (%)
Residents speaking other language at home - Foreign born (%)
Marital status - Never married (%)
Marital status - Now married (%)
Marital status - Separated (%)
Marital status - Widowed (%)
Marital status - Divorced (%)
Ancestries Reported - Arab (%)
Ancestries Reported - Czech (%)
Ancestries Reported - Danish (%)
Ancestries Reported - Dutch (%)
Ancestries Reported - English (%)
Ancestries Reported - French (%)
Ancestries Reported - French Canadian (%)
Ancestries Reported - German (%)
Ancestries Reported - Greek (%)
Ancestries Reported - Hungarian (%)
Ancestries Reported - Irish (%)
Ancestries Reported - Italian (%)
Ancestries Reported - Lithuanian (%)
Ancestries Reported - Norwegian (%)
Ancestries Reported - Polish (%)
Ancestries Reported - Portuguese (%)
Ancestries Reported - Russian (%)
Ancestries Reported - Scotch-Irish (%)
Ancestries Reported - Scottish (%)
Ancestries Reported - Slovak (%)
Ancestries Reported - Subsaharan African (%)
Ancestries Reported - Swedish (%)
Ancestries Reported - Swiss (%)
Ancestries Reported - Ukrainian (%)
Ancestries Reported - United States (%)
Ancestries Reported - Welsh (%)
Ancestries Reported - West Indian (%)
Ancestries Reported - Other (%)
Geographical mobility - Same house 1 year ago (%)
Geographical mobility - Same house 1 year ago (%) - White
Geographical mobility - Same house 1 year ago (%) - Black or African American
Geographical mobility - Same house 1 year ago (%) - Asian
Geographical mobility - Same house 1 year ago (%) - Hispanic or Latino
Geographical mobility - Same house 1 year ago (%) - American Indian and Alaska Native
Geographical mobility - Same house 1 year ago (%) - Multirace
Geographical mobility - Same house 1 year ago (%) - Other Race
Geographical mobility - Moved within same county (%)
Geographical mobility - Moved within same county (%) - White
Geographical mobility - Moved within same county (%) - Black or African American
Geographical mobility - Moved within same county (%) - Asian
Geographical mobility - Moved within same county (%) - Hispanic or Latino
Geographical mobility - Moved within same county (%) - American Indian and Alaska Native
Geographical mobility - Moved within same county (%) - Multirace
Geographical mobility - Moved within same county (%) - Other Race
Geographical mobility - Moved from different county within same state (%)
Geographical mobility - Moved from different county within same state (%) - White
Geographical mobility - Moved from different county within same state (%) - Black or African American
Geographical mobility - Moved from different county within same state (%) - Asian
Geographical mobility - Moved from different county within same state (%) - Hispanic or Latino
Geographical mobility - Moved from different county within same state (%) - American Indian and Alaska Native
Geographical mobility - Moved from different county within same state (%) - Multirace
Geographical mobility - Moved from different county within same state (%) - Other Race
Geographical mobility - Moved from different state (%)
Geographical mobility - Moved from different state (%) - White
Geographical mobility - Moved from different state (%) - Black or African American
Geographical mobility - Moved from different state (%) - Asian
Geographical mobility - Moved from different state (%) - Hispanic or Latino
Geographical mobility - Moved from different state (%) - American Indian and Alaska Native
Geographical mobility - Moved from different state (%) - Multirace
Geographical mobility - Moved from different state (%) - Other Race
Geographical mobility - Moved from abroad (%)
Geographical mobility - Moved from abroad (%) - White
Geographical mobility - Moved from abroad (%) - Black or African American
Geographical mobility - Moved from abroad (%) - Asian
Geographical mobility - Moved from abroad (%) - Hispanic or Latino
Geographical mobility - Moved from abroad (%) - American Indian and Alaska Native
Geographical mobility - Moved from abroad (%) - Multirace
Geographical mobility - Moved from abroad (%) - Other Race
Place of birth for the foreign-born population - Ireland (%)
Place of birth for the foreign-born population - Denmark (%)
Place of birth for the foreign-born population - Norway (%)
Place of birth for the foreign-born population - Sweden (%)
Place of birth for the foreign-born population - United Kingdom (%)
Place of birth for the foreign-born population - England (%)
Place of birth for the foreign-born population - Scotland (%)
Place of birth for the foreign-born population - Other Northern Europe (%)
Place of birth for the foreign-born population - Austria (%)
Place of birth for the foreign-born population - Belgium (%)
Place of birth for the foreign-born population - France (%)
Place of birth for the foreign-born population - Germany (%)
Place of birth for the foreign-born population - Netherlands (%)
Place of birth for the foreign-born population - Switzerland (%)
Place of birth for the foreign-born population - Other Western Europe (%)
Place of birth for the foreign-born population - Greece (%)
Place of birth for the foreign-born population - Italy (%)
Place of birth for the foreign-born population - Portugal (%)
Place of birth for the foreign-born population - Spain (%)
Place of birth for the foreign-born population - Other Southern Europe (%)
Place of birth for the foreign-born population - Albania (%)
Place of birth for the foreign-born population - Belarus (%)
Place of birth for the foreign-born population - Bosnia and Herzegovina (%)
Place of birth for the foreign-born population - Bulgaria (%)
Place of birth for the foreign-born population - Croatia (%)
Place of birth for the foreign-born population - Czechoslovakia (%)
Place of birth for the foreign-born population - Hungary (%)
Place of birth for the foreign-born population - Latvia (%)
Place of birth for the foreign-born population - Lithuania (%)
Place of birth for the foreign-born population - North Macedonia (Macedonia) (%)
Place of birth for the foreign-born population - Moldova (%)
Place of birth for the foreign-born population - Poland (%)
Place of birth for the foreign-born population - Romania (%)
Place of birth for the foreign-born population - Russia (%)
Place of birth for the foreign-born population - Serbia (%)
Place of birth for the foreign-born population - Ukraine (%)
Place of birth for the foreign-born population - Other Eastern Europe (%)
Place of birth for the foreign-born population - China (%)
Place of birth for the foreign-born population - Hong Kong (%)
Place of birth for the foreign-born population - Taiwan (%)
Place of birth for the foreign-born population - Japan (%)
Place of birth for the foreign-born population - Korea (%)
Place of birth for the foreign-born population - Other Eastern Asia (%)
Place of birth for the foreign-born population - Afghanistan (%)
Place of birth for the foreign-born population - Bangladesh (%)
Place of birth for the foreign-born population - India (%)
Place of birth for the foreign-born population - Iran (%)
Place of birth for the foreign-born population - Kazakhstan (%)
Place of birth for the foreign-born population - Nepal (%)
Place of birth for the foreign-born population - Pakistan (%)
Place of birth for the foreign-born population - Sri Lanka (%)
Place of birth for the foreign-born population - Uzbekistan (%)
Place of birth for the foreign-born population - Other South Central Asia (%)
Place of birth for the foreign-born population - Burma (%)
Place of birth for the foreign-born population - Cambodia (%)
Place of birth for the foreign-born population - Indonesia (%)
Place of birth for the foreign-born population - Laos (%)
Place of birth for the foreign-born population - Malaysia (%)
Place of birth for the foreign-born population - Philippines (%)
Place of birth for the foreign-born population - Singapore (%)
Place of birth for the foreign-born population - Thailand (%)
Place of birth for the foreign-born population - Vietnam (%)
Place of birth for the foreign-born population - Other South Eastern Asia (%)
Place of birth for the foreign-born population - Armenia (%)
Place of birth for the foreign-born population - Iraq (%)
Place of birth for the foreign-born population - Israel (%)
Place of birth for the foreign-born population - Jordan (%)
Place of birth for the foreign-born population - Kuwait (%)
Place of birth for the foreign-born population - Lebanon (%)
Place of birth for the foreign-born population - Saudi Arabia (%)
Place of birth for the foreign-born population - Syria (%)
Place of birth for the foreign-born population - Turkey (%)
Place of birth for the foreign-born population - Yemen (%)
Place of birth for the foreign-born population - Other Western Asia (%)
Place of birth for the foreign-born population - Eritrea (%)
Place of birth for the foreign-born population - Ethiopia (%)
Place of birth for the foreign-born population - Kenya (%)
Place of birth for the foreign-born population - Somalia (%)
Place of birth for the foreign-born population - Uganda (%)
Place of birth for the foreign-born population - Zimbabwe (%)
Place of birth for the foreign-born population - Other Eastern Africa (%)
Place of birth for the foreign-born population - Cameroon (%)
Place of birth for the foreign-born population - Congo (%)
Place of birth for the foreign-born population - Democratic Republic of Congo (Zaire) (%)
Place of birth for the foreign-born population - Other Middle Africa (%)
Place of birth for the foreign-born population - Egypt (%)
Place of birth for the foreign-born population - Morocco (%)
Place of birth for the foreign-born population - Sudan (%)
Place of birth for the foreign-born population - Other Northern Africa (%)
Place of birth for the foreign-born population - South Africa (%)
Place of birth for the foreign-born population - Other Southern Africa (%)
Place of birth for the foreign-born population - Cabo Verde (%)
Place of birth for the foreign-born population - Ghana (%)
Place of birth for the foreign-born population - Liberia (%)
Place of birth for the foreign-born population - Nigeria (%)
Place of birth for the foreign-born population - Senegal (%)
Place of birth for the foreign-born population - Sierra Leone (%)
Place of birth for the foreign-born population - Other Western Africa (%)
Place of birth for the foreign-born population - Australia (%)
Place of birth for the foreign-born population - New Zealand (%)
Place of birth for the foreign-born population - Fiji (%)
Place of birth for the foreign-born population - Micronesia (%)
Place of birth for the foreign-born population - Bahamas (%)
Place of birth for the foreign-born population - Barbados (%)
Place of birth for the foreign-born population - Cuba (%)
Place of birth for the foreign-born population - Dominica (%)
Place of birth for the foreign-born population - Dominican Republic (%)
Place of birth for the foreign-born population - Grenada (%)
Place of birth for the foreign-born population - Haiti (%)
Place of birth for the foreign-born population - Jamaica (%)
Place of birth for the foreign-born population - St. Vincent and the Grenadines (%)
Place of birth for the foreign-born population - Trinidad and Tobago (%)
Place of birth for the foreign-born population - West Indies (%)
Place of birth for the foreign-born population - Other Caribbean (%)
Place of birth for the foreign-born population - Belize (%)
Place of birth for the foreign-born population - Costa Rica (%)
Place of birth for the foreign-born population - El Salvador (%)
Place of birth for the foreign-born population - Guatemala (%)
Place of birth for the foreign-born population - Honduras (%)
Place of birth for the foreign-born population - Mexico (%)
Place of birth for the foreign-born population - Nicaragua (%)
Place of birth for the foreign-born population - Panama (%)
Place of birth for the foreign-born population - Other Central America (%)
Place of birth for the foreign-born population - Argentina (%)
Place of birth for the foreign-born population - Bolivia (%)
Place of birth for the foreign-born population - Brazil (%)
Place of birth for the foreign-born population - Chile (%)
Place of birth for the foreign-born population - Colombia (%)
Place of birth for the foreign-born population - Ecuador (%)
Place of birth for the foreign-born population - Guyana (%)
Place of birth for the foreign-born population - Peru (%)
Place of birth for the foreign-born population - Uruguay (%)
Place of birth for the foreign-born population - Venezuela (%)
Place of birth for the foreign-born population - Other South America (%)
Place of birth for the foreign-born population - Canada (%)
Place of birth for the foreign-born population - Other Northern America (%)
Place of birth for the foreign-born population - Other (%)
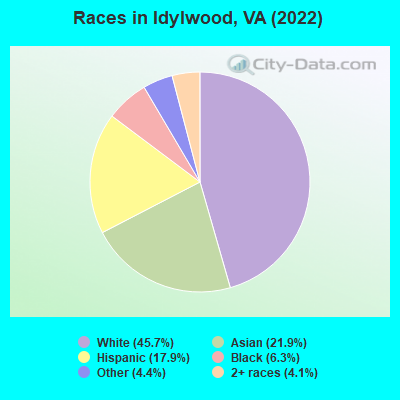
According to 2022 data, the most numerous races in Idylwood, VA are White alone (8,086 residents), Black alone (1,115 residents), and Hispanic (3,159 residents). 52.5% of Idylwood residents speak English at home. 41.1% of Idylwood, VA residents are foreign-born (21.3% born in Asia, 10.8% born in Latin America, 4.9% born in Africa), which is 70.8% greater than the foreign-born rate of 12.0% across the entire state of Virginia.
Race distribution in Idylwood
2000 2022
4,965,637 70.2% White alone 1,376,378 19.4% Black alone 329,540 4.7% Hispanic 259,277 3.7% Asian alone 114,022 1.6% Two or more races 18,596 0.3% American Indian alone 11,685 0.2% Other race alone 3,380 0.05% Native Hawaiian and Other
5,095,130 58.7% White alone 1,594,785 18.4% Black alone 905,750 10.4% Hispanic 602,881 6.9% Asian alone 406,047 4.7% Two or more races 60,419 0.7% Other race alone 11,738 0.1% American Indian alone 6,869 0.08% Native Hawaiian and Other
Income and house value in Idylwood Median household income in 2022 $132,310 White non-Hispanic householders$59,851 Black householders$105,338 Asian householders$85,176 Some other race householders$124,123 Two or more races householders$85,831 Hispanic or Latino race householdersMedian 2022 house value $884,031 White Non-Hispanic householders$684,327 Black or African American householders$177,473 American Indian or Alaska Native householders $646,906 Asian householders$657,651 Some other race householders$630,974 Two or more races householders$630,604 Hispanic or Latino householders
Median age by race in Idylwood
39.7 Median age for White residents38.7 42.1 31.7 Median age for Black or African American residents23.5 35.1 9.8 Median age for American Indian / Alaska Native residents-964,539,006.1 -669,005,847.3 38.1 Median age for Asian residents37.4 38.9 -666,666,666.0 Median age for Native Hawaiian / Pacific Islander residents-558,791,801.0 -584,518,166.9 35.8 Median age for Other race residents39.6 32.3 23.7 Median age for Two or more races residents19.4 32.0 39.4 Median age for White alone residents38.9 40.2 40.1 Median age for Hispanic or Latino residents39.3 40.4
Owner/renter occupied households by race in Idylwood
House owners and renters - White residents 2,347 60.2% Owner occupied1,553 39.8% Renter occupiedHouse owners and renters - Black or African American residents 72 14.1% Owner occupied438 85.9% Renter occupiedHouse owners and renters - Asian residents 944 55.6% Owner occupied754 44.4% Renter occupiedHouse owners and renters - Native Hawaiian / Pacific Islander residents 6 100.0% Owner occupiedHouse owners and renters - Other race residents 351 51.7% Owner occupied328 48.3% Renter occupiedHouse owners and renters - Two or more races residents 222 57.2% Owner occupied167 42.8% Renter occupiedHouse owners and renters - White alone residents 2,254 61.7% Owner occupied1,399 38.3% Renter occupiedHouse owners and renters - Hispanic or Latino residents 600 51.5% Owner occupied566 48.5% Renter occupied
Language usage in Idylwood
English speakers - Total 52.5% of residents of Idylwood speak English at home.
15.0% of residents speak Spanish at home 1,223 48.8% Speak English very well1,283 51.2% Speak English less than very well32.3% of residents speak other language at home 3,475 64.6% Speak English very well1,901 35.4% Speak English less than very well
English speakers - Born in the United States 91.8% of residents of Idylwood speak English at home.
3.4% of residents speak Spanish at home 133 70.0% Speak English very well57 30.0% Speak English less than very well5.0% of residents speak other language at home 240 86.6% Speak English very well37 13.4% Speak English less than very well
English speakers - Native, born elsewhere 59.4% of residents of Idylwood speak English at home.
28.0% of residents speak Spanish at home 57 54.8% Speak English very well47 45.2% Speak English less than very well11.8% of residents speak other language at home 44 100.0% Speak English very well
English speakers - Foreign-born 16.2% of residents of Idylwood speak English at home.
23.5% of residents speak Spanish at home 579 34.2% Speak English very well1,115 65.8% Speak English less than very well60.5% of residents speak other language at home 2,599 59.7% Speak English very well1,753 40.3% Speak English less than very well
White (Caucasian) - Speak only English Native:
88.6% (5,599)Foreign-born:
12.1% (198)
White (Caucasian) - Speak another language Native:
10.0% (630)Foreign-born:
83.0% (1,358)
Black or African American - Speak only English Native:
91.8% (456)Foreign-born:
40.0% (221)
Black or African American - Speak another language Native:
7.5% (37)Foreign-born:
63.7% (352)
American Indian / Alaska Native - Speak another language Native:
97.8% (9)Foreign-born:
100.0% (15)
Asian - Speak only English Native:
57.9% (562)Foreign-born:
18.3% (528)
Asian - Speak another language Native:
41.3% (401)Foreign-born:
82.4% (2,383)
Other race - Speak only English Native:
50.9% (368)Foreign-born:
14.8% (188)
Other race - Speak another language Native:
51.4% (373)Foreign-born:
86.7% (1,099)
Two or more races - Speak only English Native:
71.9% (695)Foreign-born:
20.0% (95)
Two or more races - Speak another language Native:
28.3% (273)Foreign-born:
79.8% (380)
White alone - Speak only English Native:
90.9% (5,501)Foreign-born:
9.9% (157)
White alone - Speak another language Native:
8.7% (527)Foreign-born:
87.5% (1,395)
Hispanic or Latino - Speak only English Native:
39.9% (449)Foreign-born:
8.9% (163)
Hispanic or Latino - Speak another language Native:
58.9% (663)Foreign-born:
91.2% (1,672)
Foreign-born residents in Idylwood 7,270 residents are foreign born (21.3% Asia , 10.8% Latin America , 4.9% Africa ).
This city:
41.1%Virginia:
12.6%
Marital status for residents in Idylwood Marital status - White (Caucasian) population 15 years and over
Males 34.2% Never married59.9% Now married0.5% Separated0.1% Widowed5.2% DivorcedFemales 30.2% Never married49.4% Now married2.9% Separated8.2% Widowed9.4% DivorcedWomen who gave birth in the past 12 months Now married:
100.0% (109)Unmarried:
0.0% (0)
Women who did not give birth in the past 12 months Now married:
48.0% (1,020)Unmarried:
52.0% (1,104)
Marital status - Black or African American population 15 years and over
Males 42.3% Never married42.0% Now married0.0% Separated0.0% Widowed15.7% DivorcedFemales 56.4% Never married24.8% Now married3.4% Separated0.2% Widowed15.1% DivorcedWomen who gave birth in the past 12 months Now married:
100.0% (15)Unmarried:
0.0% (0)
Women who did not give birth in the past 12 months Now married:
16.8% (53)Unmarried:
83.2% (264)
Marital status - Asian population 15 years and over
Males 41.2% Never married55.0% Now married1.1% Separated0.0% Widowed2.7% DivorcedFemales 26.5% Never married52.8% Now married3.8% Separated8.5% Widowed8.4% DivorcedWomen who gave birth in the past 12 months Now married:
60.8% (31)Unmarried:
39.2% (20)
Women who did not give birth in the past 12 months Now married:
59.7% (730)Unmarried:
40.3% (493)
Marital status - Other race population 15 years and over
Males 62.9% Never married30.6% Now married5.2% Separated0.0% Widowed1.3% DivorcedFemales 28.2% Never married63.0% Now married4.8% Separated2.6% Widowed1.4% DivorcedWomen who gave birth in the past 12 months Now married:
100.0% (31)Unmarried:
0.0% (0)
Women who did not give birth in the past 12 months Now married:
60.5% (379)Unmarried:
39.5% (247)
Marital status - Two or more races population 15 years and over
Males 49.4% Never married50.6% Now married0.0% Separated0.0% Widowed0.0% DivorcedFemales 40.3% Never married49.8% Now married3.1% Separated0.0% Widowed6.9% DivorcedWomen who gave birth in the past 12 months Now married:
100.0% (16)Unmarried:
0.0% (0)
Women who did not give birth in the past 12 months Now married:
47.2% (203)Unmarried:
52.8% (227)
Marital status - White alone, not Hispanic / Latino population 15 years and over
Males 31.8% Never married63.2% Now married0.3% Separated0.1% Widowed4.6% DivorcedFemales 29.4% Never married50.3% Now married2.2% Separated8.8% Widowed9.3% DivorcedWomen who gave birth in the past 12 months Now married:
100.0% (118)Unmarried:
0.0% (0)
Women who did not give birth in the past 12 months Now married:
47.8% (926)Unmarried:
52.2% (1,011)
Marital status - Hispanic or Latino population 15 years and over
Males 61.3% Never married31.4% Now married3.0% Separated0.0% Widowed4.3% DivorcedFemales 40.5% Never married42.3% Now married7.3% Separated3.4% Widowed6.5% DivorcedWomen who gave birth in the past 12 months Now married:
100.0% (34)Unmarried:
0.0% (0)
Women who did not give birth in the past 12 months Now married:
36.6% (289)Unmarried:
63.4% (500)
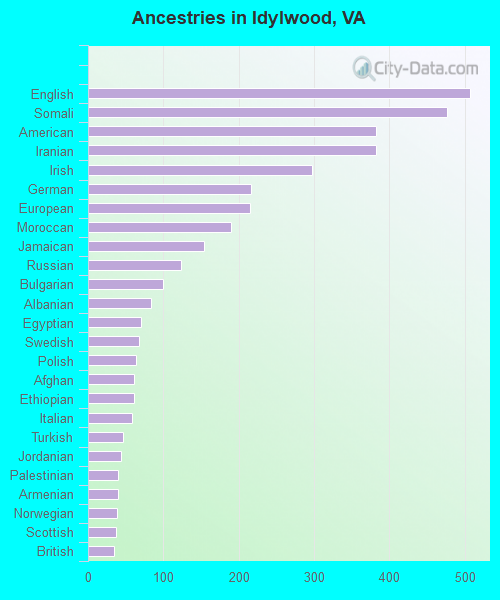
Ancestries in Idylwood
507 5.0% English477 4.7% Somali382 3.8% American382 3.8% Iranian298 3.0% Irish217 2.2% German215 2.1% European190 1.9% Moroccan154 1.5% Jamaican123 1.2% Russian99 1.0% Bulgarian83 0.8% Albanian70 0.7% Egyptian68 0.7% Swedish64 0.6% Polish61 0.6% Afghan61 0.6% Ethiopian59 0.6% Italian47 0.5% Turkish44 0.4% Jordanian40 0.4% Palestinian40 0.4% Armenian38 0.4% Norwegian37 0.4% Scottish35 0.3% British33 0.3% Greek33 0.3% African29 0.3% Scotch-Irish27 0.3% Portuguese27 0.3% Lebanese26 0.3% Ukrainian25 0.2% Scandinavian24 0.2% South African19 0.2% Eastern European18 0.2% Brazilian17 0.2% Slavic16 0.2% Austrian14 0.1% Arab11 0.1% Lithuanian11 0.1% Romanian10 0.10% Slovak10 0.10% Hungarian9 0.09% Welsh8 0.08% Dutch7 0.07% Iraqi5 0.05% Swiss4 0.04% Northern European4 0.04% Haitian1 0.01% French Canadian
Geographical mobility in Idylwood Same house 1 year ago 7,555 88.2% White (Caucasian)773 70.1% Black or African American19 78.7% American Indian / Alaska Native3,173 80.5% Asian7 95.3% Native Hawaiian / Pacific Islander1,995 92.0% Other race1,407 85.6% Two or more races7,111 89.2% White alone, not Hispanic / Latino2,576 82.3% Hispanic or LatinoMoved within same county 494 5.8% White / Caucasian73 6.6% Black or African American484 12.3% Asian153 9.3% Two or more races352 4.4% White alone, not Hispanic / Latino399 12.7% Hispanic or LatinoMoved within same state 226 2.6% White / Caucasian191 4.8% Asian20 0.9% Other race239 3.0% White alone, not Hispanic / LatinoMoved from different state 270 3.2% White / Caucasian393 35.7% Black or African American33 0.8% Asian80 3.7% Other race252 3.2% White alone, not Hispanic / Latino78 2.5% Hispanic or LatinoMoved from abroad 24 0.3% White5 22.7% American Indian / Alaska Native80 2.0% Asian145 6.7% Other race63 3.8% Two or more races23 0.3% White alone, not Hispanic / Latino73 2.3% Hispanic or Latino
Children Nativity (place of birth) in Idylwood
Children under 6 years - Living with two parents Both parents native 457 100.0% NativeBoth parents foreign-born 285 76.0% Native90 24.0% Foreign-bornOne native, one foreign-born parent 156 100.0% NativeChildren under 6 years - Living with one parent Native parent 46 100.0% NativeForeign-born parent 99 100.0% NativeChildren 6 to 17 years - Living with two parents Both parents native 792 96.6% Native28 3.4% Foreign-bornBoth parents foreign-born 620 69.4% Native274 30.6% Foreign-bornOne native, one foreign-born parent 285 93.2% Native21 6.8% Foreign-bornChildren 6 to 17 years - Living with one parent Foreign-born parent 659 63.4% Native380 36.6% Foreign-born
Place of birth for residents in Idylwood
Grandparents responsible for own grandchildren in Idylwood
Grandparents (30 to 59 years) White / Caucasian 20 100.0% Not responsible for grandchildrenNative Hawaiian / Pacific Islander 6 100.0% Not responsible for grandchildrenHispanic or Latino 33 100.0% Not responsible for grandchildrenGrandparents (60 years and over) White / Caucasian 7 6.3% Responsible for grandchildren106 93.7% Not responsible for grandchildrenHispanic or Latino 41 100.0% Not responsible for grandchildren