Races in Hurst, Texas (TX) Detailed Stats
Data:
Races - White alone (%)
Races - White alone (% change since 2000)
Races - Black alone (%)
Races - Black alone (% change since 2000)
Races - American Indian alone (%)
Races - American Indian alone (% change since 2000)
Races - Asian alone (%)
Races - Asian alone (% change since 2000)
Races - Hispanic (%)
Races - Hispanic (% change since 2000)
Races - Native Hawaiian and Other Pacific Islander alone (%)
Races - Native Hawaiian and Other Pacific Islander alone (% change since 2000)
Races - Two or more races(%)
Races - Two or more races(% change since 2000)
Races - Other race alone (%)
Races - Other race alone (% change since 2000)
Racial diversity
Place of birth - Born in state of residence (%)
Place of birth - Born in state of residence (%) - White
Place of birth - Born in state of residence (%) - Black or African American
Place of birth - Born in state of residence (%) - Asian
Place of birth - Born in state of residence (%) - Hispanic or Latino
Place of birth - Born in state of residence (%) - American Indian and Alaska Native
Place of birth - Born in state of residence (%) - Multirace
Place of birth - Born in state of residence (%) - Other Race
Place of birth - Born in other state (%)
Place of birth - Born in other state (%) - White
Place of birth - Born in other state (%) - Black or African American
Place of birth - Born in other state (%) - Asian
Place of birth - Born in other state (%) - Hispanic or Latino
Place of birth - Born in other state (%) - American Indian and Alaska Native
Place of birth - Born in other state (%) - Multirace
Place of birth - Born in other state (%) - Other Race
Place of birth - Native, outside of US (%)
Place of birth - Native, outside of US (%) - White
Place of birth - Native, outside of US (%) - Black or African American
Place of birth - Native, outside of US (%) - Asian
Place of birth - Native, outside of US (%) - Hispanic or Latino
Place of birth - Native, outside of US (%) - American Indian and Alaska Native
Place of birth - Native, outside of US (%) - Multirace
Place of birth - Native, outside of US (%) - Other Race
Place of birth - Foreign born (%)
Place of birth - Foreign born (%) - White
Place of birth - Foreign born (%) - Black or African American
Place of birth - Foreign born (%) - Asian
Place of birth - Foreign born (%) - Hispanic or Latino
Place of birth - Foreign born (%) - American Indian and Alaska Native
Place of birth - Foreign born (%) - Multirace
Place of birth - Foreign born (%) - Other Race
Residents speaking English at home (%)
Residents speaking English at home - Born in the United States (%)
Residents speaking English at home - Native, born elsewhere (%)
Residents speaking English at home - Foreign born (%)
Residents speaking Spanish at home (%)
Residents speaking Spanish at home - Born in the United States (%)
Residents speaking Spanish at home - Native, born elsewhere (%)
Residents speaking Spanish at home - Foreign born (%)
Residents speaking other language at home (%)
Residents speaking other language at home - Born in the United States (%)
Residents speaking other language at home - Native, born elsewhere (%)
Residents speaking other language at home - Foreign born (%)
Marital status - Never married (%)
Marital status - Now married (%)
Marital status - Separated (%)
Marital status - Widowed (%)
Marital status - Divorced (%)
Ancestries Reported - Arab (%)
Ancestries Reported - Czech (%)
Ancestries Reported - Danish (%)
Ancestries Reported - Dutch (%)
Ancestries Reported - English (%)
Ancestries Reported - French (%)
Ancestries Reported - French Canadian (%)
Ancestries Reported - German (%)
Ancestries Reported - Greek (%)
Ancestries Reported - Hungarian (%)
Ancestries Reported - Irish (%)
Ancestries Reported - Italian (%)
Ancestries Reported - Lithuanian (%)
Ancestries Reported - Norwegian (%)
Ancestries Reported - Polish (%)
Ancestries Reported - Portuguese (%)
Ancestries Reported - Russian (%)
Ancestries Reported - Scotch-Irish (%)
Ancestries Reported - Scottish (%)
Ancestries Reported - Slovak (%)
Ancestries Reported - Subsaharan African (%)
Ancestries Reported - Swedish (%)
Ancestries Reported - Swiss (%)
Ancestries Reported - Ukrainian (%)
Ancestries Reported - United States (%)
Ancestries Reported - Welsh (%)
Ancestries Reported - West Indian (%)
Ancestries Reported - Other (%)
Geographical mobility - Same house 1 year ago (%)
Geographical mobility - Same house 1 year ago (%) - White
Geographical mobility - Same house 1 year ago (%) - Black or African American
Geographical mobility - Same house 1 year ago (%) - Asian
Geographical mobility - Same house 1 year ago (%) - Hispanic or Latino
Geographical mobility - Same house 1 year ago (%) - American Indian and Alaska Native
Geographical mobility - Same house 1 year ago (%) - Multirace
Geographical mobility - Same house 1 year ago (%) - Other Race
Geographical mobility - Moved within same county (%)
Geographical mobility - Moved within same county (%) - White
Geographical mobility - Moved within same county (%) - Black or African American
Geographical mobility - Moved within same county (%) - Asian
Geographical mobility - Moved within same county (%) - Hispanic or Latino
Geographical mobility - Moved within same county (%) - American Indian and Alaska Native
Geographical mobility - Moved within same county (%) - Multirace
Geographical mobility - Moved within same county (%) - Other Race
Geographical mobility - Moved from different county within same state (%)
Geographical mobility - Moved from different county within same state (%) - White
Geographical mobility - Moved from different county within same state (%) - Black or African American
Geographical mobility - Moved from different county within same state (%) - Asian
Geographical mobility - Moved from different county within same state (%) - Hispanic or Latino
Geographical mobility - Moved from different county within same state (%) - American Indian and Alaska Native
Geographical mobility - Moved from different county within same state (%) - Multirace
Geographical mobility - Moved from different county within same state (%) - Other Race
Geographical mobility - Moved from different state (%)
Geographical mobility - Moved from different state (%) - White
Geographical mobility - Moved from different state (%) - Black or African American
Geographical mobility - Moved from different state (%) - Asian
Geographical mobility - Moved from different state (%) - Hispanic or Latino
Geographical mobility - Moved from different state (%) - American Indian and Alaska Native
Geographical mobility - Moved from different state (%) - Multirace
Geographical mobility - Moved from different state (%) - Other Race
Geographical mobility - Moved from abroad (%)
Geographical mobility - Moved from abroad (%) - White
Geographical mobility - Moved from abroad (%) - Black or African American
Geographical mobility - Moved from abroad (%) - Asian
Geographical mobility - Moved from abroad (%) - Hispanic or Latino
Geographical mobility - Moved from abroad (%) - American Indian and Alaska Native
Geographical mobility - Moved from abroad (%) - Multirace
Geographical mobility - Moved from abroad (%) - Other Race
Place of birth for the foreign-born population - Ireland (%)
Place of birth for the foreign-born population - Denmark (%)
Place of birth for the foreign-born population - Norway (%)
Place of birth for the foreign-born population - Sweden (%)
Place of birth for the foreign-born population - United Kingdom (%)
Place of birth for the foreign-born population - England (%)
Place of birth for the foreign-born population - Scotland (%)
Place of birth for the foreign-born population - Other Northern Europe (%)
Place of birth for the foreign-born population - Austria (%)
Place of birth for the foreign-born population - Belgium (%)
Place of birth for the foreign-born population - France (%)
Place of birth for the foreign-born population - Germany (%)
Place of birth for the foreign-born population - Netherlands (%)
Place of birth for the foreign-born population - Switzerland (%)
Place of birth for the foreign-born population - Other Western Europe (%)
Place of birth for the foreign-born population - Greece (%)
Place of birth for the foreign-born population - Italy (%)
Place of birth for the foreign-born population - Portugal (%)
Place of birth for the foreign-born population - Spain (%)
Place of birth for the foreign-born population - Other Southern Europe (%)
Place of birth for the foreign-born population - Albania (%)
Place of birth for the foreign-born population - Belarus (%)
Place of birth for the foreign-born population - Bosnia and Herzegovina (%)
Place of birth for the foreign-born population - Bulgaria (%)
Place of birth for the foreign-born population - Croatia (%)
Place of birth for the foreign-born population - Czechoslovakia (%)
Place of birth for the foreign-born population - Hungary (%)
Place of birth for the foreign-born population - Latvia (%)
Place of birth for the foreign-born population - Lithuania (%)
Place of birth for the foreign-born population - North Macedonia (Macedonia) (%)
Place of birth for the foreign-born population - Moldova (%)
Place of birth for the foreign-born population - Poland (%)
Place of birth for the foreign-born population - Romania (%)
Place of birth for the foreign-born population - Russia (%)
Place of birth for the foreign-born population - Serbia (%)
Place of birth for the foreign-born population - Ukraine (%)
Place of birth for the foreign-born population - Other Eastern Europe (%)
Place of birth for the foreign-born population - China (%)
Place of birth for the foreign-born population - Hong Kong (%)
Place of birth for the foreign-born population - Taiwan (%)
Place of birth for the foreign-born population - Japan (%)
Place of birth for the foreign-born population - Korea (%)
Place of birth for the foreign-born population - Other Eastern Asia (%)
Place of birth for the foreign-born population - Afghanistan (%)
Place of birth for the foreign-born population - Bangladesh (%)
Place of birth for the foreign-born population - India (%)
Place of birth for the foreign-born population - Iran (%)
Place of birth for the foreign-born population - Kazakhstan (%)
Place of birth for the foreign-born population - Nepal (%)
Place of birth for the foreign-born population - Pakistan (%)
Place of birth for the foreign-born population - Sri Lanka (%)
Place of birth for the foreign-born population - Uzbekistan (%)
Place of birth for the foreign-born population - Other South Central Asia (%)
Place of birth for the foreign-born population - Burma (%)
Place of birth for the foreign-born population - Cambodia (%)
Place of birth for the foreign-born population - Indonesia (%)
Place of birth for the foreign-born population - Laos (%)
Place of birth for the foreign-born population - Malaysia (%)
Place of birth for the foreign-born population - Philippines (%)
Place of birth for the foreign-born population - Singapore (%)
Place of birth for the foreign-born population - Thailand (%)
Place of birth for the foreign-born population - Vietnam (%)
Place of birth for the foreign-born population - Other South Eastern Asia (%)
Place of birth for the foreign-born population - Armenia (%)
Place of birth for the foreign-born population - Iraq (%)
Place of birth for the foreign-born population - Israel (%)
Place of birth for the foreign-born population - Jordan (%)
Place of birth for the foreign-born population - Kuwait (%)
Place of birth for the foreign-born population - Lebanon (%)
Place of birth for the foreign-born population - Saudi Arabia (%)
Place of birth for the foreign-born population - Syria (%)
Place of birth for the foreign-born population - Turkey (%)
Place of birth for the foreign-born population - Yemen (%)
Place of birth for the foreign-born population - Other Western Asia (%)
Place of birth for the foreign-born population - Eritrea (%)
Place of birth for the foreign-born population - Ethiopia (%)
Place of birth for the foreign-born population - Kenya (%)
Place of birth for the foreign-born population - Somalia (%)
Place of birth for the foreign-born population - Uganda (%)
Place of birth for the foreign-born population - Zimbabwe (%)
Place of birth for the foreign-born population - Other Eastern Africa (%)
Place of birth for the foreign-born population - Cameroon (%)
Place of birth for the foreign-born population - Congo (%)
Place of birth for the foreign-born population - Democratic Republic of Congo (Zaire) (%)
Place of birth for the foreign-born population - Other Middle Africa (%)
Place of birth for the foreign-born population - Egypt (%)
Place of birth for the foreign-born population - Morocco (%)
Place of birth for the foreign-born population - Sudan (%)
Place of birth for the foreign-born population - Other Northern Africa (%)
Place of birth for the foreign-born population - South Africa (%)
Place of birth for the foreign-born population - Other Southern Africa (%)
Place of birth for the foreign-born population - Cabo Verde (%)
Place of birth for the foreign-born population - Ghana (%)
Place of birth for the foreign-born population - Liberia (%)
Place of birth for the foreign-born population - Nigeria (%)
Place of birth for the foreign-born population - Senegal (%)
Place of birth for the foreign-born population - Sierra Leone (%)
Place of birth for the foreign-born population - Other Western Africa (%)
Place of birth for the foreign-born population - Australia (%)
Place of birth for the foreign-born population - New Zealand (%)
Place of birth for the foreign-born population - Fiji (%)
Place of birth for the foreign-born population - Micronesia (%)
Place of birth for the foreign-born population - Bahamas (%)
Place of birth for the foreign-born population - Barbados (%)
Place of birth for the foreign-born population - Cuba (%)
Place of birth for the foreign-born population - Dominica (%)
Place of birth for the foreign-born population - Dominican Republic (%)
Place of birth for the foreign-born population - Grenada (%)
Place of birth for the foreign-born population - Haiti (%)
Place of birth for the foreign-born population - Jamaica (%)
Place of birth for the foreign-born population - St. Vincent and the Grenadines (%)
Place of birth for the foreign-born population - Trinidad and Tobago (%)
Place of birth for the foreign-born population - West Indies (%)
Place of birth for the foreign-born population - Other Caribbean (%)
Place of birth for the foreign-born population - Belize (%)
Place of birth for the foreign-born population - Costa Rica (%)
Place of birth for the foreign-born population - El Salvador (%)
Place of birth for the foreign-born population - Guatemala (%)
Place of birth for the foreign-born population - Honduras (%)
Place of birth for the foreign-born population - Mexico (%)
Place of birth for the foreign-born population - Nicaragua (%)
Place of birth for the foreign-born population - Panama (%)
Place of birth for the foreign-born population - Other Central America (%)
Place of birth for the foreign-born population - Argentina (%)
Place of birth for the foreign-born population - Bolivia (%)
Place of birth for the foreign-born population - Brazil (%)
Place of birth for the foreign-born population - Chile (%)
Place of birth for the foreign-born population - Colombia (%)
Place of birth for the foreign-born population - Ecuador (%)
Place of birth for the foreign-born population - Guyana (%)
Place of birth for the foreign-born population - Peru (%)
Place of birth for the foreign-born population - Uruguay (%)
Place of birth for the foreign-born population - Venezuela (%)
Place of birth for the foreign-born population - Other South America (%)
Place of birth for the foreign-born population - Canada (%)
Place of birth for the foreign-born population - Other Northern America (%)
Place of birth for the foreign-born population - Other (%)
Latest news about races in Hurst, TX collected exclusively by city-data.com from local newspapers, TV, and radio stations
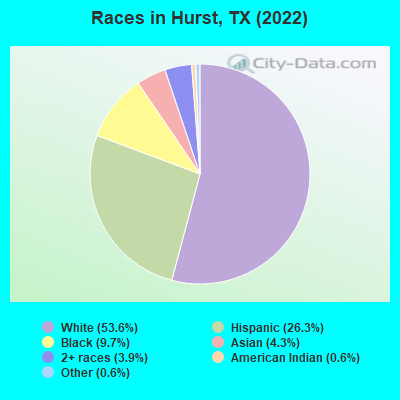
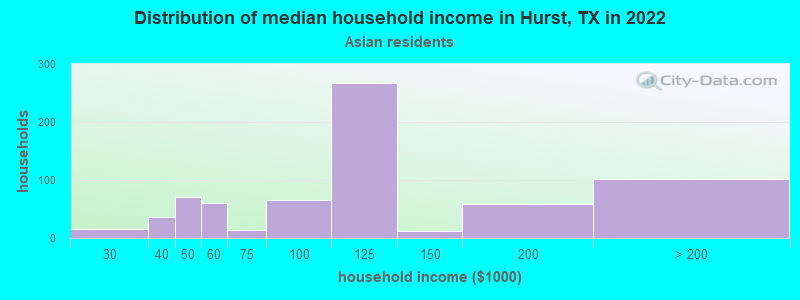
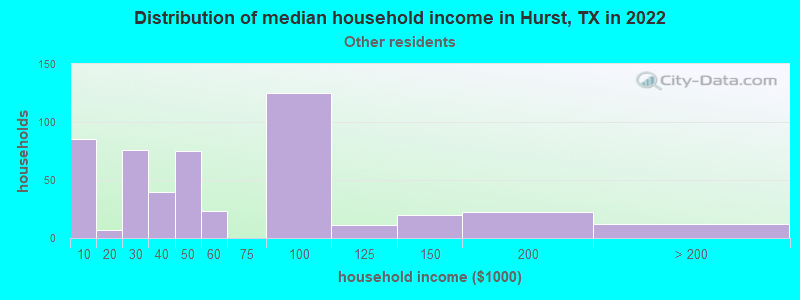
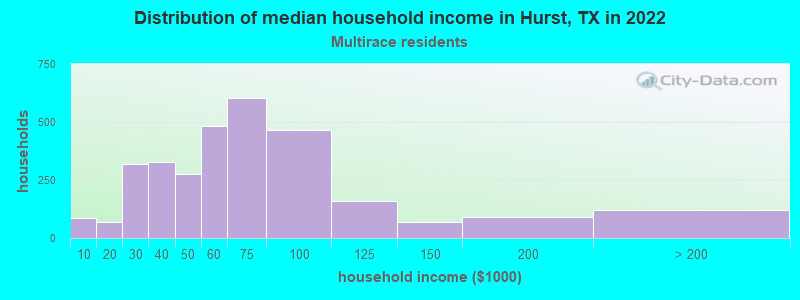
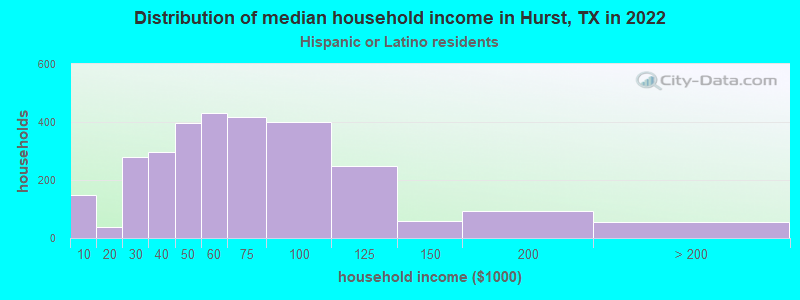
According to 2022 data, the most numerous races in Hurst, TX are Hispanic (10,742 residents), White alone (21,878 residents), and Black alone (3,967 residents). 74.6% of Hurst residents speak English at home. 13.7% of Hurst, TX residents are foreign-born (7.8% born in Latin America, 3.0% born in Asia, 2.2% born in Africa), which is 23.7% less than the foreign-born rate of 17.0% across the entire state of Texas.
Race distribution in Hurst
2000 2022
10,933,313 52.4% White alone 6,669,666 32.0% Hispanic 2,364,255 11.3% Black alone 554,445 2.7% Asian alone 230,567 1.1% Two or more races 68,859 0.3% American Indian alone 19,958 0.10% Other race alone 10,757 0.05% Native Hawaiian and Other
12,070,642 40.2% Hispanic 11,683,430 38.9% White alone 3,508,706 11.7% Black alone 1,608,173 5.4% Asian alone 956,560 3.2% Two or more races 125,763 0.4% Other race alone 47,023 0.2% American Indian alone 29,275 0.10% Native Hawaiian and Other
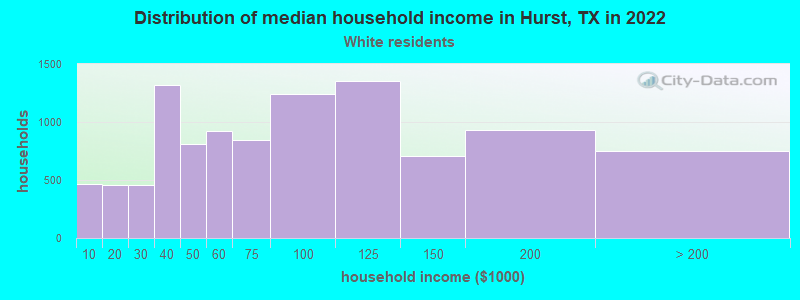
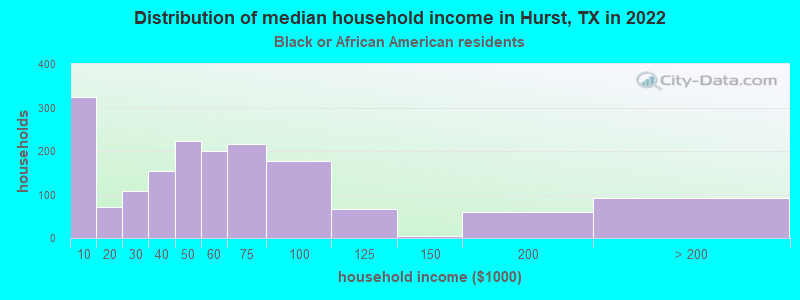
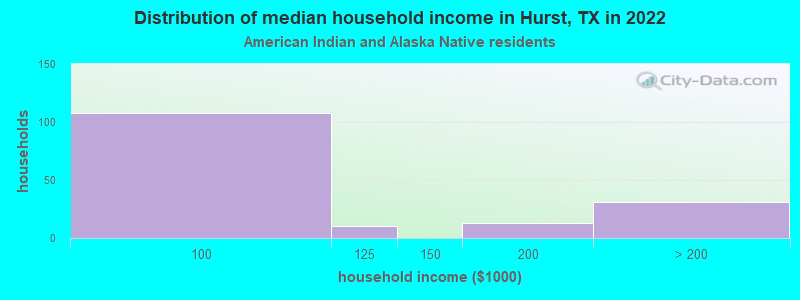
Income and house value in Hurst Median household income in 2022 $76,680 White non-Hispanic householders$47,130 Black householders$99,772 American Indian and Alaska Native householders$109,283 Asian householders$45,476 Some other race householders$58,123 Two or more races householders$55,309 Hispanic or Latino race householdersMedian 2022 house value $304,920 White Non-Hispanic householders$308,635 Black or African American householders$216,694 American Indian or Alaska Native householders $435,556 Asian householders$208,955 Native Hawaiian and other Pacific Islander householders$216,694 Some other race householders$301,515 Two or more races householders$264,677 Hispanic or Latino householders
Median age by race in Hurst
44.6 Median age for White residents42.3 47.8 26.7 Median age for Black or African American residents24.3 30.9 33.4 Median age for American Indian / Alaska Native residents34.8 33.2 43.2 Median age for Asian residents39.8 43.4 14.9 Median age for Native Hawaiian / Pacific Islander residents-550,102,248.9 -551,928,782.8 25.5 Median age for Other race residents25.5 24.2 32.0 Median age for Two or more races residents27.4 34.8 47.9 Median age for White alone residents42.7 51.2 24.8 Median age for Hispanic or Latino residents23.7 25.5
Owner/renter occupied households by race in Hurst
House owners and renters - White residents 7,129 70.1% Owner occupied3,037 29.9% Renter occupiedHouse owners and renters - Black or African American residents 264 16.3% Owner occupied1,356 83.7% Renter occupiedHouse owners and renters - American Indian / Alaska Native residents 24 17.0% Owner occupied117 83.0% Renter occupiedHouse owners and renters - Asian residents 413 60.3% Owner occupied272 39.7% Renter occupiedHouse owners and renters - Other race residents 260 58.6% Owner occupied184 41.4% Renter occupiedHouse owners and renters - Two or more races residents 1,184 38.0% Owner occupied1,927 62.0% Renter occupiedHouse owners and renters - White alone residents 7,246 72.7% Owner occupied2,721 27.3% Renter occupiedHouse owners and renters - Hispanic or Latino residents 964 35.1% Owner occupied1,787 64.9% Renter occupied
Language usage in Hurst
English speakers - Total 74.6% of residents of Hurst speak English at home.
18.8% of residents speak Spanish at home 4,781 66.2% Speak English very well2,446 33.8% Speak English less than very well6.5% of residents speak other language at home 1,968 78.4% Speak English very well541 21.6% Speak English less than very well
English speakers - Born in the United States 92.3% of residents of Hurst speak English at home.
6.1% of residents speak Spanish at home 592 82.7% Speak English very well124 17.3% Speak English less than very well1.1% of residents speak other language at home 124 100.0% Speak English very well
English speakers - Native, born elsewhere 65.5% of residents of Hurst speak English at home.
36.6% of residents speak Spanish at home 223 94.1% Speak English very well14 5.9% Speak English less than very well
English speakers - Foreign-born 8.3% of residents of Hurst speak English at home.
55.3% of residents speak Spanish at home 1,128 37.0% Speak English very well1,920 63.0% Speak English less than very well36.5% of residents speak other language at home 1,483 73.7% Speak English very well528 26.3% Speak English less than very well
White (Caucasian) - Speak only English Native:
94.5% (20,804)Foreign-born:
19.7% (163)
White (Caucasian) - Speak another language Native:
6.0% (1,320)Foreign-born:
77.4% (643)
Black or African American - Speak only English Native:
92.5% (2,691)Foreign-born:
17.0% (124)
Black or African American - Speak another language Native:
8.6% (250)Foreign-born:
83.7% (611)
American Indian / Alaska Native - Speak another language Native:
3.4% (20)Foreign-born:
100.0% (5)
Asian - Speak only English Native:
60.7% (255)Foreign-born:
6.9% (79)
Asian - Speak another language Native:
40.8% (171)Foreign-born:
92.6% (1,057)
Other race - Speak only English Native:
32.8% (366)Foreign-born:
6.0% (35)
Other race - Speak another language Native:
66.3% (740)Foreign-born:
93.4% (541)
Two or more races - Speak only English Native:
63.8% (3,327)Foreign-born:
2.0% (52)
Two or more races - Speak another language Native:
30.1% (1,568)Foreign-born:
99.8% (2,553)
White alone - Speak only English Native:
98.0% (20,234)Foreign-born:
28.3% (132)
White alone - Speak another language Native:
2.1% (430)Foreign-born:
69.3% (323)
Hispanic or Latino - Speak only English Native:
45.5% (3,139)Foreign-born:
3.0% (94)
Hispanic or Latino - Speak another language Native:
54.2% (3,743)Foreign-born:
97.1% (3,026)
Foreign-born residents in Hurst 5,609 residents are foreign born (7.8% Latin America , 3.0% Asia , 2.2% Africa ).
This city:
13.7%Texas:
17.1%
Marital status for residents in Hurst Marital status - White (Caucasian) population 15 years and over
Males 28.7% Never married54.1% Now married2.7% Separated2.4% Widowed12.0% DivorcedFemales 23.8% Never married47.4% Now married3.0% Separated12.3% Widowed13.5% DivorcedWomen who gave birth in the past 12 months Now married:
83.0% (266)Unmarried:
17.0% (54)
Women who did not give birth in the past 12 months Now married:
44.8% (2,143)Unmarried:
55.2% (2,643)
Marital status - Black or African American population 15 years and over
Males 49.1% Never married39.1% Now married2.0% Separated0.0% Widowed9.8% DivorcedFemales 46.3% Never married33.7% Now married4.0% Separated1.0% Widowed15.0% DivorcedWomen who gave birth in the past 12 months Now married:
46.5% (49)Unmarried:
53.5% (57)
Women who did not give birth in the past 12 months Now married:
40.0% (468)Unmarried:
60.0% (703)
Marital status - American Indian / Alaska Native population 15 years and over
Males 50.0% Never married29.3% Now married0.0% Separated0.0% Widowed20.7% DivorcedFemales 29.4% Never married70.6% Now married0.0% Separated0.0% Widowed0.0% DivorcedWomen who did not give birth in the past 12 months Now married:
59.8% (79)Unmarried:
40.2% (53)
Marital status - Asian population 15 years and over
Males 18.6% Never married81.2% Now married0.0% Separated0.0% Widowed0.2% DivorcedFemales 22.0% Never married65.4% Now married0.0% Separated2.1% Widowed10.5% DivorcedWomen who gave birth in the past 12 months Now married:
100.0% (9)Unmarried:
0.0% (0)
Women who did not give birth in the past 12 months Now married:
63.3% (359)Unmarried:
36.7% (208)
Marital status - Native Hawaiian / Pacific Islander population 15 years and over
Males 0.0% Never married100.0% Now married0.0% Separated0.0% Widowed0.0% DivorcedFemales 100.0% Never married0.0% Now married0.0% Separated0.0% Widowed0.0% DivorcedWomen who did not give birth in the past 12 months Now married:
0.0% (0)Unmarried:
100.0% (32)
Marital status - Other race population 15 years and over
Males 32.2% Never married54.8% Now married4.4% Separated4.8% Widowed3.7% DivorcedFemales 54.4% Never married41.9% Now married0.0% Separated0.0% Widowed3.8% DivorcedWomen who did not give birth in the past 12 months Now married:
36.1% (140)Unmarried:
63.9% (248)
Marital status - Two or more races population 15 years and over
Males 33.1% Never married57.1% Now married2.1% Separated5.1% Widowed2.6% DivorcedFemales 32.0% Never married42.3% Now married3.3% Separated5.1% Widowed17.3% DivorcedWomen who gave birth in the past 12 months Now married:
95.4% (249)Unmarried:
4.6% (12)
Women who did not give birth in the past 12 months Now married:
42.8% (823)Unmarried:
57.2% (1,098)
Marital status - White alone, not Hispanic / Latino population 15 years and over
Males 28.8% Never married54.0% Now married3.1% Separated2.4% Widowed11.7% DivorcedFemales 18.9% Never married50.1% Now married2.7% Separated13.8% Widowed14.5% DivorcedWomen who gave birth in the past 12 months Now married:
86.9% (186)Unmarried:
13.1% (28)
Women who did not give birth in the past 12 months Now married:
48.7% (1,920)Unmarried:
51.3% (2,023)
Marital status - Hispanic or Latino population 15 years and over
Males 29.7% Never married56.4% Now married1.6% Separated4.6% Widowed7.6% DivorcedFemales 41.1% Never married42.5% Now married3.4% Separated4.6% Widowed8.5% DivorcedWomen who gave birth in the past 12 months Now married:
85.1% (252)Unmarried:
14.9% (44)
Women who did not give birth in the past 12 months Now married:
42.4% (1,229)Unmarried:
57.6% (1,671)
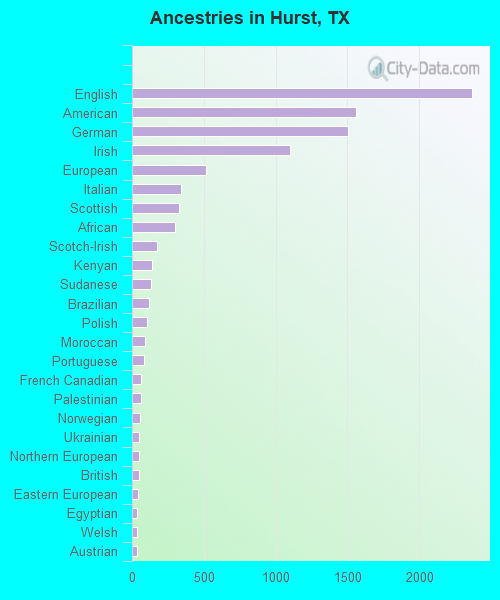
Ancestries in Hurst
2,369 11.7% English1,563 7.7% American1,504 7.4% German1,102 5.4% Irish519 2.6% European344 1.7% Italian328 1.6% Scottish303 1.5% African174 0.9% Scotch-Irish140 0.7% Kenyan135 0.7% Sudanese118 0.6% Brazilian106 0.5% Polish92 0.5% Moroccan86 0.4% Portuguese65 0.3% French Canadian64 0.3% Palestinian54 0.3% Norwegian51 0.3% Ukrainian49 0.2% Northern European48 0.2% British44 0.2% Eastern European38 0.2% Egyptian38 0.2% Welsh32 0.2% Austrian28 0.1% Greek26 0.1% Jamaican25 0.1% Canadian23 0.1% French23 0.1% Swedish19 0.09% Belgian17 0.08% Swiss12 0.06% Russian12 0.06% Jordanian12 0.06% Czech11 0.05% Slovak11 0.05% Dutch10 0.05% Syrian9 0.04% Danish6 0.03% Lebanese3 0.01% Hungarian
Geographical mobility in Hurst Same house 1 year ago 21,251 91.4% White (Caucasian)3,270 81.1% Black or African American484 77.7% American Indian / Alaska Native1,773 98.9% Asian105 98.2% Native Hawaiian / Pacific Islander1,727 98.3% Other race7,947 95.9% Two or more races19,946 92.0% White alone, not Hispanic / Latino9,881 94.0% Hispanic or LatinoMoved within same county 1,348 5.8% White / Caucasian415 10.3% Black or African American108 17.4% American Indian / Alaska Native13 0.7% Asian25 1.4% Other race247 3.0% Two or more races1,146 5.3% White alone, not Hispanic / Latino498 4.7% Hispanic or LatinoMoved within same state 551 2.4% White / Caucasian262 6.5% Black or African American51 0.6% Two or more races494 2.3% White alone, not Hispanic / Latino113 1.1% Hispanic or LatinoMoved from different state 152 0.7% White / Caucasian17 0.9% Other race163 0.8% White alone, not Hispanic / Latino18 0.2% Hispanic or LatinoMoved from abroad 12 0.0% White17 1.0% Other race15 0.1% White alone, not Hispanic / Latino46 0.4% Hispanic or Latino
Children Nativity (place of birth) in Hurst
Children under 6 years - Living with two parents Both parents native 965 100.0% NativeBoth parents foreign-born 575 100.0% NativeOne native, one foreign-born parent 138 100.0% NativeChildren under 6 years - Living with one parent Native parent 815 100.0% NativeForeign-born parent 267 100.0% NativeChildren 6 to 17 years - Living with two parents Both parents native 3,038 99.5% Native15 0.5% Foreign-bornBoth parents foreign-born 749 79.9% Native189 20.1% Foreign-bornOne native, one foreign-born parent 495 100.0% NativeChildren 6 to 17 years - Living with one parent Native parent 1,513 100.0% NativeForeign-born parent 727 54.1% Native616 45.9% Foreign-born
Grandparents responsible for own grandchildren in Hurst
Grandparents (30 to 59 years) White / Caucasian 59 84.6% Responsible for grandchildren11 15.4% Not responsible for grandchildrenBlack or African American 47 100.0% Not responsible for grandchildrenAmerican Indian / Alaska Native 37 100.0% Not responsible for grandchildrenOther race 62 100.0% Not responsible for grandchildrenTwo or more races 75 100.0% Responsible for grandchildrenWhite alone, not Hispanic / Latino 42 75.8% Responsible for grandchildren14 24.2% Not responsible for grandchildrenHispanic or Latino 64 46.3% Responsible for grandchildren74 53.7% Not responsible for grandchildrenGrandparents (60 years and over) White / Caucasian 94 27.1% Responsible for grandchildren253 72.9% Not responsible for grandchildrenBlack or African American 52 100.0% Not responsible for grandchildrenAmerican Indian / Alaska Native 20 100.0% Responsible for grandchildrenOther race 11 100.0% Responsible for grandchildrenWhite alone, not Hispanic / Latino 102 34.1% Responsible for grandchildren196 65.9% Not responsible for grandchildrenHispanic or Latino 19 17.5% Responsible for grandchildren88 82.5% Not responsible for grandchildren