Races in Huntsville, Georgia (GA) Detailed Stats
Ancestries, Foreign-born residents, place of birth
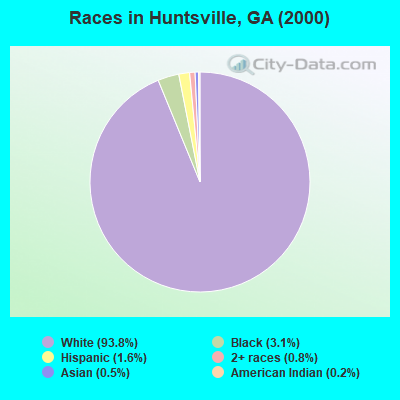
Race distribution in Huntsville

- 13,49793.8%White alone
- 4423.1%Black alone
- 2371.6%Hispanic
- 1130.8%Two or more races
- 650.5%Asian alone
- 270.2%American Indian alone
- 70.05%Other race alone
- 50.03%Native Hawaiian and Other
Pacific Islander alone
2000
2022
-
- 5,128,66162.6%White alone
- 2,331,46528.5%Black alone
- 435,2275.3%Hispanic
- 171,5132.1%Asian alone
- 87,3641.1%Two or more races
- 17,6700.2%American Indian alone
- 11,2750.1%Other race alone
- 3,2780.04%Native Hawaiian and Other
Pacific Islander alone

-
- 5,415,65749.6%White alone
- 3,349,24030.7%Black alone
- 1,132,60410.4%Hispanic
- 479,1564.4%Asian alone
- 462,9234.2%Two or more races
- 54,4160.5%Other race alone
- 11,9230.1%American Indian alone
- 6,9570.06%Native Hawaiian and Other
Pacific Islander alone

Income and house value in Huntsville
- Median household income in 2022
- $101,963White non-Hispanic householders
- $101,349Black householders
- $85,307Asian householders
- $156,892Some other race householders
- $76,048Two or more races householders
- $96,956Hispanic or Latino race householders
- Median 2022 house value
- $389,595White Non-Hispanic householders
- $402,561Black or African American householders
- $414,623Asian householders
- $297,925Some other race householders
- $339,237Two or more races householders
- $317,526Hispanic or Latino householders
Household income for White non-Hispanic householders

Household income for Black householders

Household income for American Indian and Alaska Native householders

Household income for Asian householders

Household income for Two or more races householders

Household income for Hispanic or Latino race householders

Zip code: 30132