Races in Huntley, Illinois (IL) Detailed Stats
Data:
Races - White alone (%)
Races - White alone (% change since 2000)
Races - Black alone (%)
Races - Black alone (% change since 2000)
Races - American Indian alone (%)
Races - American Indian alone (% change since 2000)
Races - Asian alone (%)
Races - Asian alone (% change since 2000)
Races - Hispanic (%)
Races - Hispanic (% change since 2000)
Races - Native Hawaiian and Other Pacific Islander alone (%)
Races - Native Hawaiian and Other Pacific Islander alone (% change since 2000)
Races - Two or more races(%)
Races - Two or more races(% change since 2000)
Races - Other race alone (%)
Races - Other race alone (% change since 2000)
Racial diversity
Place of birth - Born in state of residence (%)
Place of birth - Born in state of residence (%) - White
Place of birth - Born in state of residence (%) - Black or African American
Place of birth - Born in state of residence (%) - Asian
Place of birth - Born in state of residence (%) - Hispanic or Latino
Place of birth - Born in state of residence (%) - American Indian and Alaska Native
Place of birth - Born in state of residence (%) - Multirace
Place of birth - Born in state of residence (%) - Other Race
Place of birth - Born in other state (%)
Place of birth - Born in other state (%) - White
Place of birth - Born in other state (%) - Black or African American
Place of birth - Born in other state (%) - Asian
Place of birth - Born in other state (%) - Hispanic or Latino
Place of birth - Born in other state (%) - American Indian and Alaska Native
Place of birth - Born in other state (%) - Multirace
Place of birth - Born in other state (%) - Other Race
Place of birth - Native, outside of US (%)
Place of birth - Native, outside of US (%) - White
Place of birth - Native, outside of US (%) - Black or African American
Place of birth - Native, outside of US (%) - Asian
Place of birth - Native, outside of US (%) - Hispanic or Latino
Place of birth - Native, outside of US (%) - American Indian and Alaska Native
Place of birth - Native, outside of US (%) - Multirace
Place of birth - Native, outside of US (%) - Other Race
Place of birth - Foreign born (%)
Place of birth - Foreign born (%) - White
Place of birth - Foreign born (%) - Black or African American
Place of birth - Foreign born (%) - Asian
Place of birth - Foreign born (%) - Hispanic or Latino
Place of birth - Foreign born (%) - American Indian and Alaska Native
Place of birth - Foreign born (%) - Multirace
Place of birth - Foreign born (%) - Other Race
Residents speaking English at home (%)
Residents speaking English at home - Born in the United States (%)
Residents speaking English at home - Native, born elsewhere (%)
Residents speaking English at home - Foreign born (%)
Residents speaking Spanish at home (%)
Residents speaking Spanish at home - Born in the United States (%)
Residents speaking Spanish at home - Native, born elsewhere (%)
Residents speaking Spanish at home - Foreign born (%)
Residents speaking other language at home (%)
Residents speaking other language at home - Born in the United States (%)
Residents speaking other language at home - Native, born elsewhere (%)
Residents speaking other language at home - Foreign born (%)
Marital status - Never married (%)
Marital status - Now married (%)
Marital status - Separated (%)
Marital status - Widowed (%)
Marital status - Divorced (%)
Ancestries Reported - Arab (%)
Ancestries Reported - Czech (%)
Ancestries Reported - Danish (%)
Ancestries Reported - Dutch (%)
Ancestries Reported - English (%)
Ancestries Reported - French (%)
Ancestries Reported - French Canadian (%)
Ancestries Reported - German (%)
Ancestries Reported - Greek (%)
Ancestries Reported - Hungarian (%)
Ancestries Reported - Irish (%)
Ancestries Reported - Italian (%)
Ancestries Reported - Lithuanian (%)
Ancestries Reported - Norwegian (%)
Ancestries Reported - Polish (%)
Ancestries Reported - Portuguese (%)
Ancestries Reported - Russian (%)
Ancestries Reported - Scotch-Irish (%)
Ancestries Reported - Scottish (%)
Ancestries Reported - Slovak (%)
Ancestries Reported - Subsaharan African (%)
Ancestries Reported - Swedish (%)
Ancestries Reported - Swiss (%)
Ancestries Reported - Ukrainian (%)
Ancestries Reported - United States (%)
Ancestries Reported - Welsh (%)
Ancestries Reported - West Indian (%)
Ancestries Reported - Other (%)
Geographical mobility - Same house 1 year ago (%)
Geographical mobility - Same house 1 year ago (%) - White
Geographical mobility - Same house 1 year ago (%) - Black or African American
Geographical mobility - Same house 1 year ago (%) - Asian
Geographical mobility - Same house 1 year ago (%) - Hispanic or Latino
Geographical mobility - Same house 1 year ago (%) - American Indian and Alaska Native
Geographical mobility - Same house 1 year ago (%) - Multirace
Geographical mobility - Same house 1 year ago (%) - Other Race
Geographical mobility - Moved within same county (%)
Geographical mobility - Moved within same county (%) - White
Geographical mobility - Moved within same county (%) - Black or African American
Geographical mobility - Moved within same county (%) - Asian
Geographical mobility - Moved within same county (%) - Hispanic or Latino
Geographical mobility - Moved within same county (%) - American Indian and Alaska Native
Geographical mobility - Moved within same county (%) - Multirace
Geographical mobility - Moved within same county (%) - Other Race
Geographical mobility - Moved from different county within same state (%)
Geographical mobility - Moved from different county within same state (%) - White
Geographical mobility - Moved from different county within same state (%) - Black or African American
Geographical mobility - Moved from different county within same state (%) - Asian
Geographical mobility - Moved from different county within same state (%) - Hispanic or Latino
Geographical mobility - Moved from different county within same state (%) - American Indian and Alaska Native
Geographical mobility - Moved from different county within same state (%) - Multirace
Geographical mobility - Moved from different county within same state (%) - Other Race
Geographical mobility - Moved from different state (%)
Geographical mobility - Moved from different state (%) - White
Geographical mobility - Moved from different state (%) - Black or African American
Geographical mobility - Moved from different state (%) - Asian
Geographical mobility - Moved from different state (%) - Hispanic or Latino
Geographical mobility - Moved from different state (%) - American Indian and Alaska Native
Geographical mobility - Moved from different state (%) - Multirace
Geographical mobility - Moved from different state (%) - Other Race
Geographical mobility - Moved from abroad (%)
Geographical mobility - Moved from abroad (%) - White
Geographical mobility - Moved from abroad (%) - Black or African American
Geographical mobility - Moved from abroad (%) - Asian
Geographical mobility - Moved from abroad (%) - Hispanic or Latino
Geographical mobility - Moved from abroad (%) - American Indian and Alaska Native
Geographical mobility - Moved from abroad (%) - Multirace
Geographical mobility - Moved from abroad (%) - Other Race
Place of birth for the foreign-born population - Ireland (%)
Place of birth for the foreign-born population - Denmark (%)
Place of birth for the foreign-born population - Norway (%)
Place of birth for the foreign-born population - Sweden (%)
Place of birth for the foreign-born population - United Kingdom (%)
Place of birth for the foreign-born population - England (%)
Place of birth for the foreign-born population - Scotland (%)
Place of birth for the foreign-born population - Other Northern Europe (%)
Place of birth for the foreign-born population - Austria (%)
Place of birth for the foreign-born population - Belgium (%)
Place of birth for the foreign-born population - France (%)
Place of birth for the foreign-born population - Germany (%)
Place of birth for the foreign-born population - Netherlands (%)
Place of birth for the foreign-born population - Switzerland (%)
Place of birth for the foreign-born population - Other Western Europe (%)
Place of birth for the foreign-born population - Greece (%)
Place of birth for the foreign-born population - Italy (%)
Place of birth for the foreign-born population - Portugal (%)
Place of birth for the foreign-born population - Spain (%)
Place of birth for the foreign-born population - Other Southern Europe (%)
Place of birth for the foreign-born population - Albania (%)
Place of birth for the foreign-born population - Belarus (%)
Place of birth for the foreign-born population - Bosnia and Herzegovina (%)
Place of birth for the foreign-born population - Bulgaria (%)
Place of birth for the foreign-born population - Croatia (%)
Place of birth for the foreign-born population - Czechoslovakia (%)
Place of birth for the foreign-born population - Hungary (%)
Place of birth for the foreign-born population - Latvia (%)
Place of birth for the foreign-born population - Lithuania (%)
Place of birth for the foreign-born population - North Macedonia (Macedonia) (%)
Place of birth for the foreign-born population - Moldova (%)
Place of birth for the foreign-born population - Poland (%)
Place of birth for the foreign-born population - Romania (%)
Place of birth for the foreign-born population - Russia (%)
Place of birth for the foreign-born population - Serbia (%)
Place of birth for the foreign-born population - Ukraine (%)
Place of birth for the foreign-born population - Other Eastern Europe (%)
Place of birth for the foreign-born population - China (%)
Place of birth for the foreign-born population - Hong Kong (%)
Place of birth for the foreign-born population - Taiwan (%)
Place of birth for the foreign-born population - Japan (%)
Place of birth for the foreign-born population - Korea (%)
Place of birth for the foreign-born population - Other Eastern Asia (%)
Place of birth for the foreign-born population - Afghanistan (%)
Place of birth for the foreign-born population - Bangladesh (%)
Place of birth for the foreign-born population - India (%)
Place of birth for the foreign-born population - Iran (%)
Place of birth for the foreign-born population - Kazakhstan (%)
Place of birth for the foreign-born population - Nepal (%)
Place of birth for the foreign-born population - Pakistan (%)
Place of birth for the foreign-born population - Sri Lanka (%)
Place of birth for the foreign-born population - Uzbekistan (%)
Place of birth for the foreign-born population - Other South Central Asia (%)
Place of birth for the foreign-born population - Burma (%)
Place of birth for the foreign-born population - Cambodia (%)
Place of birth for the foreign-born population - Indonesia (%)
Place of birth for the foreign-born population - Laos (%)
Place of birth for the foreign-born population - Malaysia (%)
Place of birth for the foreign-born population - Philippines (%)
Place of birth for the foreign-born population - Singapore (%)
Place of birth for the foreign-born population - Thailand (%)
Place of birth for the foreign-born population - Vietnam (%)
Place of birth for the foreign-born population - Other South Eastern Asia (%)
Place of birth for the foreign-born population - Armenia (%)
Place of birth for the foreign-born population - Iraq (%)
Place of birth for the foreign-born population - Israel (%)
Place of birth for the foreign-born population - Jordan (%)
Place of birth for the foreign-born population - Kuwait (%)
Place of birth for the foreign-born population - Lebanon (%)
Place of birth for the foreign-born population - Saudi Arabia (%)
Place of birth for the foreign-born population - Syria (%)
Place of birth for the foreign-born population - Turkey (%)
Place of birth for the foreign-born population - Yemen (%)
Place of birth for the foreign-born population - Other Western Asia (%)
Place of birth for the foreign-born population - Eritrea (%)
Place of birth for the foreign-born population - Ethiopia (%)
Place of birth for the foreign-born population - Kenya (%)
Place of birth for the foreign-born population - Somalia (%)
Place of birth for the foreign-born population - Uganda (%)
Place of birth for the foreign-born population - Zimbabwe (%)
Place of birth for the foreign-born population - Other Eastern Africa (%)
Place of birth for the foreign-born population - Cameroon (%)
Place of birth for the foreign-born population - Congo (%)
Place of birth for the foreign-born population - Democratic Republic of Congo (Zaire) (%)
Place of birth for the foreign-born population - Other Middle Africa (%)
Place of birth for the foreign-born population - Egypt (%)
Place of birth for the foreign-born population - Morocco (%)
Place of birth for the foreign-born population - Sudan (%)
Place of birth for the foreign-born population - Other Northern Africa (%)
Place of birth for the foreign-born population - South Africa (%)
Place of birth for the foreign-born population - Other Southern Africa (%)
Place of birth for the foreign-born population - Cabo Verde (%)
Place of birth for the foreign-born population - Ghana (%)
Place of birth for the foreign-born population - Liberia (%)
Place of birth for the foreign-born population - Nigeria (%)
Place of birth for the foreign-born population - Senegal (%)
Place of birth for the foreign-born population - Sierra Leone (%)
Place of birth for the foreign-born population - Other Western Africa (%)
Place of birth for the foreign-born population - Australia (%)
Place of birth for the foreign-born population - New Zealand (%)
Place of birth for the foreign-born population - Fiji (%)
Place of birth for the foreign-born population - Micronesia (%)
Place of birth for the foreign-born population - Bahamas (%)
Place of birth for the foreign-born population - Barbados (%)
Place of birth for the foreign-born population - Cuba (%)
Place of birth for the foreign-born population - Dominica (%)
Place of birth for the foreign-born population - Dominican Republic (%)
Place of birth for the foreign-born population - Grenada (%)
Place of birth for the foreign-born population - Haiti (%)
Place of birth for the foreign-born population - Jamaica (%)
Place of birth for the foreign-born population - St. Vincent and the Grenadines (%)
Place of birth for the foreign-born population - Trinidad and Tobago (%)
Place of birth for the foreign-born population - West Indies (%)
Place of birth for the foreign-born population - Other Caribbean (%)
Place of birth for the foreign-born population - Belize (%)
Place of birth for the foreign-born population - Costa Rica (%)
Place of birth for the foreign-born population - El Salvador (%)
Place of birth for the foreign-born population - Guatemala (%)
Place of birth for the foreign-born population - Honduras (%)
Place of birth for the foreign-born population - Mexico (%)
Place of birth for the foreign-born population - Nicaragua (%)
Place of birth for the foreign-born population - Panama (%)
Place of birth for the foreign-born population - Other Central America (%)
Place of birth for the foreign-born population - Argentina (%)
Place of birth for the foreign-born population - Bolivia (%)
Place of birth for the foreign-born population - Brazil (%)
Place of birth for the foreign-born population - Chile (%)
Place of birth for the foreign-born population - Colombia (%)
Place of birth for the foreign-born population - Ecuador (%)
Place of birth for the foreign-born population - Guyana (%)
Place of birth for the foreign-born population - Peru (%)
Place of birth for the foreign-born population - Uruguay (%)
Place of birth for the foreign-born population - Venezuela (%)
Place of birth for the foreign-born population - Other South America (%)
Place of birth for the foreign-born population - Canada (%)
Place of birth for the foreign-born population - Other Northern America (%)
Place of birth for the foreign-born population - Other (%)
Latest news about races in Huntley, IL collected exclusively by city-data.com from local newspapers, TV, and radio stations
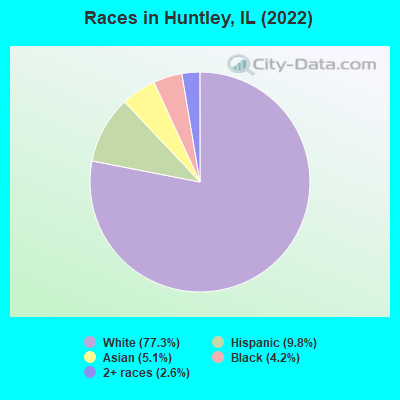
According to 2022 data, the most numerous races in Huntley, IL are White alone (21,418 residents), Hispanic (2,721 residents), and Black alone (1,175 residents). 86.6% of Huntley residents speak English at home. 10.0% of Huntley, IL residents are foreign-born (3.7% born in Asia, 2.3% born in Europe, 2.3% born in Latin America), which is 39.5% less than the foreign-born rate of 14.0% across the entire state of Illinois.
Race distribution in Huntley
2000 2022
8,424,140 67.8% White alone 1,856,152 14.9% Black alone 1,530,262 12.3% Hispanic 419,916 3.4% Asian alone 153,996 1.2% Two or more races 13,479 0.1% Other race alone 18,232 0.1% American Indian alone 3,116 0.03% Native Hawaiian and Other
7,356,301 58.5% White alone 2,299,726 18.3% Hispanic 1,660,423 13.2% Black alone 747,296 5.9% Asian alone 458,599 3.6% Two or more races 45,386 0.4% Other race alone 10,405 0.08% American Indian alone 3,896 0.03% Native Hawaiian and Other
Income and house value in Huntley Median household income in 2022 $73,975 White non-Hispanic householdersover $200,000 Black householders$101,852 Asian householders$106,710 Two or more races householders$82,178 Hispanic or Latino race householdersMedian 2022 house value $326,785 White Non-Hispanic householders$319,292 Black or African American householders $428,618 Asian householders$345,857 Some other race householders$251,517 Two or more races householders$296,814 Hispanic or Latino householders
Median age by race in Huntley
55.0 Median age for White residents51.8 61.7 29.8 Median age for Black or African American residents32.5 14.1 86.1 Median age for American Indian / Alaska Native residents89.4 77.5 47.3 Median age for Asian residents55.7 44.1 -666,666,666.0 Median age for Native Hawaiian / Pacific Islander residents-666,666,666.0 -666,666,666.0 37.6 Median age for Other race residents26.9 41.0 13.2 Median age for Two or more races residents11.3 15.4 55.5 Median age for White alone residents50.9 62.5 26.3 Median age for Hispanic or Latino residents22.1 33.8
Owner/renter occupied households by race in Huntley
House owners and renters - White residents 9,641 90.3% Owner occupied1,039 9.7% Renter occupiedHouse owners and renters - Black or African American residents 177 94.1% Owner occupied11 5.9% Renter occupiedHouse owners and renters - American Indian / Alaska Native residents 51 100.0% Owner occupiedHouse owners and renters - Asian residents 605 100.0% Owner occupiedHouse owners and renters - Other race residents 315 90.0% Owner occupied35 10.0% Renter occupiedHouse owners and renters - Two or more races residents 240 81.8% Owner occupied53 18.2% Renter occupiedHouse owners and renters - White alone residents 9,522 90.9% Owner occupied957 9.1% Renter occupiedHouse owners and renters - Hispanic or Latino residents 825 81.8% Owner occupied184 18.2% Renter occupied
Language usage in Huntley
English speakers - Total 86.6% of residents of Huntley speak English at home.
4.8% of residents speak Spanish at home 905 70.0% Speak English very well387 30.0% Speak English less than very well8.0% of residents speak other language at home 1,715 80.2% Speak English very well424 19.8% Speak English less than very well
English speakers - Born in the United States 93.5% of residents of Huntley speak English at home.
5.4% of residents speak Spanish at home 137 60.1% Speak English very well91 39.9% Speak English less than very well1.2% of residents speak other language at home 50 100.0% Speak English very well
English speakers - Native, born elsewhere 88.6% of residents of Huntley speak English at home.
English speakers - Foreign-born 20.5% of residents of Huntley speak English at home.
16.7% of residents speak Spanish at home 286 57.1% Speak English very well215 42.9% Speak English less than very well61.5% of residents speak other language at home 1,406 76.3% Speak English very well437 23.7% Speak English less than very well
White (Caucasian) - Speak only English Native:
98.9% (19,972)Foreign-born:
34.3% (297)
White (Caucasian) - Speak another language Native:
1.7% (351)Foreign-born:
64.2% (556)
Black or African American - Speak only English Native:
95.6% (925)Foreign-born:
50.9% (175)
Black or African American - Speak another language Native:
4.4% (43)Foreign-born:
51.7% (178)
American Indian / Alaska Native - Speak another language Native:
29.6% (31)Foreign-born:
100.0% (10)
Asian - Speak only English Native:
64.3% (214)Foreign-born:
17.4% (192)
Asian - Speak another language Native:
28.9% (96)Foreign-born:
82.7% (915)
Other race - Speak another language Native:
62.3% (251)Foreign-born:
92.4% (326)
Two or more races - Speak another language Native:
22.8% (291)Foreign-born:
100.0% (139)
White alone - Speak only English Native:
98.3% (19,381)Foreign-born:
27.8% (299)
White alone - Speak another language Native:
1.4% (279)Foreign-born:
70.2% (755)
Hispanic or Latino - Speak only English Native:
64.1% (1,321)Foreign-born:
4.9% (25)
Hispanic or Latino - Speak another language Native:
31.2% (643)Foreign-born:
95.4% (482)
Foreign-born residents in Huntley 2,781 residents are foreign born (3.7% Asia , 2.3% Europe , 2.3% Latin America ).
This city:
10.0%Illinois:
14.1%
Marital status for residents in Huntley Marital status - White (Caucasian) population 15 years and over
Males 22.4% Never married59.7% Now married0.6% Separated6.6% Widowed10.8% DivorcedFemales 18.4% Never married49.6% Now married0.4% Separated17.7% Widowed13.9% DivorcedWomen who gave birth in the past 12 months Now married:
100.0% (119)Unmarried:
0.0% (0)
Women who did not give birth in the past 12 months Now married:
50.3% (1,731)Unmarried:
49.7% (1,713)
Marital status - Black or African American population 15 years and over
Males 21.8% Never married78.2% Now married0.0% Separated0.0% Widowed0.0% DivorcedFemales 30.9% Never married63.5% Now married0.0% Separated2.4% Widowed3.2% DivorcedWomen who did not give birth in the past 12 months Now married:
73.0% (204)Unmarried:
27.0% (76)
Marital status - American Indian / Alaska Native population 15 years and over
Males 44.2% Never married55.8% Now married0.0% Separated0.0% Widowed0.0% DivorcedFemales 0.0% Never married82.4% Now married0.0% Separated17.6% Widowed0.0% DivorcedMarital status - Asian population 15 years and over
Males 16.0% Never married79.1% Now married0.0% Separated4.9% Widowed0.0% DivorcedFemales 34.4% Never married55.0% Now married0.0% Separated3.3% Widowed7.3% DivorcedWomen who did not give birth in the past 12 months Now married:
45.9% (199)Unmarried:
54.1% (234)
Marital status - Other race population 15 years and over
Males 40.5% Never married59.5% Now married0.0% Separated0.0% Widowed0.0% DivorcedFemales 12.1% Never married62.8% Now married0.0% Separated13.5% Widowed11.6% DivorcedWomen who did not give birth in the past 12 months Now married:
63.0% (73)Unmarried:
37.0% (43)
Marital status - Two or more races population 15 years and over
Males 62.9% Never married34.3% Now married0.0% Separated0.0% Widowed2.9% DivorcedFemales 35.0% Never married33.2% Now married23.4% Separated0.0% Widowed8.4% DivorcedWomen who gave birth in the past 12 months Now married:
100.0% (90)Unmarried:
0.0% (0)
Women who did not give birth in the past 12 months Now married:
39.7% (118)Unmarried:
60.3% (179)
Marital status - White alone, not Hispanic / Latino population 15 years and over
Males 21.5% Never married60.5% Now married0.4% Separated6.8% Widowed10.9% DivorcedFemales 16.0% Never married50.9% Now married0.3% Separated18.2% Widowed14.6% DivorcedWomen who gave birth in the past 12 months Now married:
100.0% (123)Unmarried:
0.0% (0)
Women who did not give birth in the past 12 months Now married:
53.4% (1,660)Unmarried:
46.6% (1,449)
Marital status - Hispanic or Latino population 15 years and over
Males 48.7% Never married44.0% Now married2.9% Separated0.0% Widowed4.4% DivorcedFemales 43.8% Never married32.2% Now married7.7% Separated9.5% Widowed6.8% DivorcedWomen who gave birth in the past 12 months Now married:
100.0% (64)Unmarried:
0.0% (0)
Women who did not give birth in the past 12 months Now married:
33.4% (279)Unmarried:
66.6% (557)
Ancestries in Huntley
2,073 16.0% German1,442 11.1% Polish1,219 9.4% Italian1,128 8.7% American856 6.6% Irish361 2.8% Nigerian312 2.4% English236 1.8% Scottish196 1.5% Norwegian184 1.4% French Canadian176 1.4% European167 1.3% African144 1.1% Greek141 1.1% British124 1.0% Swedish100 0.8% Eastern European95 0.7% Jamaican85 0.7% Lithuanian75 0.6% Northern European63 0.5% Dutch54 0.4% French35 0.3% Ukrainian31 0.2% Assyrian31 0.2% Czech29 0.2% Arab23 0.2% Welsh22 0.2% Danish12 0.09% Egyptian11 0.08% Albanian10 0.08% Moroccan1 0.01% Russian
Geographical mobility in Huntley Same house 1 year ago 20,227 93.8% White (Caucasian)1,022 87.6% Black or African American73 60.9% American Indian / Alaska Native961 69.7% Asian517 82.9% Other race1,629 93.3% Two or more races19,790 93.0% White alone, not Hispanic / Latino2,499 92.4% Hispanic or LatinoMoved within same county 276 1.3% White / Caucasian169 12.3% Asian76 12.2% Other race304 1.4% White alone, not Hispanic / Latino54 2.0% Hispanic or LatinoMoved within same state 1,454 6.7% White / Caucasian87 7.5% Black or African American51 42.8% American Indian / Alaska Native258 18.7% Asian23 3.8% Other race86 5.0% Two or more races1,558 7.3% White alone, not Hispanic / Latino223 8.3% Hispanic or LatinoMoved from different state 20 0.1% White / Caucasian28 2.0% Asian22 0.1% White alone, not Hispanic / LatinoMoved from abroad 2 0.0% White3 0.0% White alone, not Hispanic / Latino
Children Nativity (place of birth) in Huntley
Children under 6 years - Living with two parents Both parents native 1,368 100.0% NativeBoth parents foreign-born 63 100.0% NativeOne native, one foreign-born parent 14 100.0% NativeChildren under 6 years - Living with one parent Native parent 83 100.0% NativeForeign-born parent 112 100.0% NativeChildren 6 to 17 years - Living with two parents Both parents native 1,993 100.0% NativeBoth parents foreign-born 554 79.4% Native144 20.6% Foreign-bornOne native, one foreign-born parent 335 92.3% Native28 7.7% Foreign-bornChildren 6 to 17 years - Living with one parent Native parent 879 100.0% NativeForeign-born parent 150 49.1% Native156 50.9% Foreign-born