Races in Hopatcong, New Jersey (NJ) Detailed Stats
Data:
Races - White alone (%)
Races - White alone (% change since 2000)
Races - Black alone (%)
Races - Black alone (% change since 2000)
Races - American Indian alone (%)
Races - American Indian alone (% change since 2000)
Races - Asian alone (%)
Races - Asian alone (% change since 2000)
Races - Hispanic (%)
Races - Hispanic (% change since 2000)
Races - Native Hawaiian and Other Pacific Islander alone (%)
Races - Native Hawaiian and Other Pacific Islander alone (% change since 2000)
Races - Two or more races(%)
Races - Two or more races(% change since 2000)
Races - Other race alone (%)
Races - Other race alone (% change since 2000)
Racial diversity
Place of birth - Born in state of residence (%)
Place of birth - Born in state of residence (%) - White
Place of birth - Born in state of residence (%) - Black or African American
Place of birth - Born in state of residence (%) - Asian
Place of birth - Born in state of residence (%) - Hispanic or Latino
Place of birth - Born in state of residence (%) - American Indian and Alaska Native
Place of birth - Born in state of residence (%) - Multirace
Place of birth - Born in state of residence (%) - Other Race
Place of birth - Born in other state (%)
Place of birth - Born in other state (%) - White
Place of birth - Born in other state (%) - Black or African American
Place of birth - Born in other state (%) - Asian
Place of birth - Born in other state (%) - Hispanic or Latino
Place of birth - Born in other state (%) - American Indian and Alaska Native
Place of birth - Born in other state (%) - Multirace
Place of birth - Born in other state (%) - Other Race
Place of birth - Native, outside of US (%)
Place of birth - Native, outside of US (%) - White
Place of birth - Native, outside of US (%) - Black or African American
Place of birth - Native, outside of US (%) - Asian
Place of birth - Native, outside of US (%) - Hispanic or Latino
Place of birth - Native, outside of US (%) - American Indian and Alaska Native
Place of birth - Native, outside of US (%) - Multirace
Place of birth - Native, outside of US (%) - Other Race
Place of birth - Foreign born (%)
Place of birth - Foreign born (%) - White
Place of birth - Foreign born (%) - Black or African American
Place of birth - Foreign born (%) - Asian
Place of birth - Foreign born (%) - Hispanic or Latino
Place of birth - Foreign born (%) - American Indian and Alaska Native
Place of birth - Foreign born (%) - Multirace
Place of birth - Foreign born (%) - Other Race
Residents speaking English at home (%)
Residents speaking English at home - Born in the United States (%)
Residents speaking English at home - Native, born elsewhere (%)
Residents speaking English at home - Foreign born (%)
Residents speaking Spanish at home (%)
Residents speaking Spanish at home - Born in the United States (%)
Residents speaking Spanish at home - Native, born elsewhere (%)
Residents speaking Spanish at home - Foreign born (%)
Residents speaking other language at home (%)
Residents speaking other language at home - Born in the United States (%)
Residents speaking other language at home - Native, born elsewhere (%)
Residents speaking other language at home - Foreign born (%)
Marital status - Never married (%)
Marital status - Now married (%)
Marital status - Separated (%)
Marital status - Widowed (%)
Marital status - Divorced (%)
Ancestries Reported - Arab (%)
Ancestries Reported - Czech (%)
Ancestries Reported - Danish (%)
Ancestries Reported - Dutch (%)
Ancestries Reported - English (%)
Ancestries Reported - French (%)
Ancestries Reported - French Canadian (%)
Ancestries Reported - German (%)
Ancestries Reported - Greek (%)
Ancestries Reported - Hungarian (%)
Ancestries Reported - Irish (%)
Ancestries Reported - Italian (%)
Ancestries Reported - Lithuanian (%)
Ancestries Reported - Norwegian (%)
Ancestries Reported - Polish (%)
Ancestries Reported - Portuguese (%)
Ancestries Reported - Russian (%)
Ancestries Reported - Scotch-Irish (%)
Ancestries Reported - Scottish (%)
Ancestries Reported - Slovak (%)
Ancestries Reported - Subsaharan African (%)
Ancestries Reported - Swedish (%)
Ancestries Reported - Swiss (%)
Ancestries Reported - Ukrainian (%)
Ancestries Reported - United States (%)
Ancestries Reported - Welsh (%)
Ancestries Reported - West Indian (%)
Ancestries Reported - Other (%)
Geographical mobility - Same house 1 year ago (%)
Geographical mobility - Same house 1 year ago (%) - White
Geographical mobility - Same house 1 year ago (%) - Black or African American
Geographical mobility - Same house 1 year ago (%) - Asian
Geographical mobility - Same house 1 year ago (%) - Hispanic or Latino
Geographical mobility - Same house 1 year ago (%) - American Indian and Alaska Native
Geographical mobility - Same house 1 year ago (%) - Multirace
Geographical mobility - Same house 1 year ago (%) - Other Race
Geographical mobility - Moved within same county (%)
Geographical mobility - Moved within same county (%) - White
Geographical mobility - Moved within same county (%) - Black or African American
Geographical mobility - Moved within same county (%) - Asian
Geographical mobility - Moved within same county (%) - Hispanic or Latino
Geographical mobility - Moved within same county (%) - American Indian and Alaska Native
Geographical mobility - Moved within same county (%) - Multirace
Geographical mobility - Moved within same county (%) - Other Race
Geographical mobility - Moved from different county within same state (%)
Geographical mobility - Moved from different county within same state (%) - White
Geographical mobility - Moved from different county within same state (%) - Black or African American
Geographical mobility - Moved from different county within same state (%) - Asian
Geographical mobility - Moved from different county within same state (%) - Hispanic or Latino
Geographical mobility - Moved from different county within same state (%) - American Indian and Alaska Native
Geographical mobility - Moved from different county within same state (%) - Multirace
Geographical mobility - Moved from different county within same state (%) - Other Race
Geographical mobility - Moved from different state (%)
Geographical mobility - Moved from different state (%) - White
Geographical mobility - Moved from different state (%) - Black or African American
Geographical mobility - Moved from different state (%) - Asian
Geographical mobility - Moved from different state (%) - Hispanic or Latino
Geographical mobility - Moved from different state (%) - American Indian and Alaska Native
Geographical mobility - Moved from different state (%) - Multirace
Geographical mobility - Moved from different state (%) - Other Race
Geographical mobility - Moved from abroad (%)
Geographical mobility - Moved from abroad (%) - White
Geographical mobility - Moved from abroad (%) - Black or African American
Geographical mobility - Moved from abroad (%) - Asian
Geographical mobility - Moved from abroad (%) - Hispanic or Latino
Geographical mobility - Moved from abroad (%) - American Indian and Alaska Native
Geographical mobility - Moved from abroad (%) - Multirace
Geographical mobility - Moved from abroad (%) - Other Race
Place of birth for the foreign-born population - Ireland (%)
Place of birth for the foreign-born population - Denmark (%)
Place of birth for the foreign-born population - Norway (%)
Place of birth for the foreign-born population - Sweden (%)
Place of birth for the foreign-born population - United Kingdom (%)
Place of birth for the foreign-born population - England (%)
Place of birth for the foreign-born population - Scotland (%)
Place of birth for the foreign-born population - Other Northern Europe (%)
Place of birth for the foreign-born population - Austria (%)
Place of birth for the foreign-born population - Belgium (%)
Place of birth for the foreign-born population - France (%)
Place of birth for the foreign-born population - Germany (%)
Place of birth for the foreign-born population - Netherlands (%)
Place of birth for the foreign-born population - Switzerland (%)
Place of birth for the foreign-born population - Other Western Europe (%)
Place of birth for the foreign-born population - Greece (%)
Place of birth for the foreign-born population - Italy (%)
Place of birth for the foreign-born population - Portugal (%)
Place of birth for the foreign-born population - Spain (%)
Place of birth for the foreign-born population - Other Southern Europe (%)
Place of birth for the foreign-born population - Albania (%)
Place of birth for the foreign-born population - Belarus (%)
Place of birth for the foreign-born population - Bosnia and Herzegovina (%)
Place of birth for the foreign-born population - Bulgaria (%)
Place of birth for the foreign-born population - Croatia (%)
Place of birth for the foreign-born population - Czechoslovakia (%)
Place of birth for the foreign-born population - Hungary (%)
Place of birth for the foreign-born population - Latvia (%)
Place of birth for the foreign-born population - Lithuania (%)
Place of birth for the foreign-born population - North Macedonia (Macedonia) (%)
Place of birth for the foreign-born population - Moldova (%)
Place of birth for the foreign-born population - Poland (%)
Place of birth for the foreign-born population - Romania (%)
Place of birth for the foreign-born population - Russia (%)
Place of birth for the foreign-born population - Serbia (%)
Place of birth for the foreign-born population - Ukraine (%)
Place of birth for the foreign-born population - Other Eastern Europe (%)
Place of birth for the foreign-born population - China (%)
Place of birth for the foreign-born population - Hong Kong (%)
Place of birth for the foreign-born population - Taiwan (%)
Place of birth for the foreign-born population - Japan (%)
Place of birth for the foreign-born population - Korea (%)
Place of birth for the foreign-born population - Other Eastern Asia (%)
Place of birth for the foreign-born population - Afghanistan (%)
Place of birth for the foreign-born population - Bangladesh (%)
Place of birth for the foreign-born population - India (%)
Place of birth for the foreign-born population - Iran (%)
Place of birth for the foreign-born population - Kazakhstan (%)
Place of birth for the foreign-born population - Nepal (%)
Place of birth for the foreign-born population - Pakistan (%)
Place of birth for the foreign-born population - Sri Lanka (%)
Place of birth for the foreign-born population - Uzbekistan (%)
Place of birth for the foreign-born population - Other South Central Asia (%)
Place of birth for the foreign-born population - Burma (%)
Place of birth for the foreign-born population - Cambodia (%)
Place of birth for the foreign-born population - Indonesia (%)
Place of birth for the foreign-born population - Laos (%)
Place of birth for the foreign-born population - Malaysia (%)
Place of birth for the foreign-born population - Philippines (%)
Place of birth for the foreign-born population - Singapore (%)
Place of birth for the foreign-born population - Thailand (%)
Place of birth for the foreign-born population - Vietnam (%)
Place of birth for the foreign-born population - Other South Eastern Asia (%)
Place of birth for the foreign-born population - Armenia (%)
Place of birth for the foreign-born population - Iraq (%)
Place of birth for the foreign-born population - Israel (%)
Place of birth for the foreign-born population - Jordan (%)
Place of birth for the foreign-born population - Kuwait (%)
Place of birth for the foreign-born population - Lebanon (%)
Place of birth for the foreign-born population - Saudi Arabia (%)
Place of birth for the foreign-born population - Syria (%)
Place of birth for the foreign-born population - Turkey (%)
Place of birth for the foreign-born population - Yemen (%)
Place of birth for the foreign-born population - Other Western Asia (%)
Place of birth for the foreign-born population - Eritrea (%)
Place of birth for the foreign-born population - Ethiopia (%)
Place of birth for the foreign-born population - Kenya (%)
Place of birth for the foreign-born population - Somalia (%)
Place of birth for the foreign-born population - Uganda (%)
Place of birth for the foreign-born population - Zimbabwe (%)
Place of birth for the foreign-born population - Other Eastern Africa (%)
Place of birth for the foreign-born population - Cameroon (%)
Place of birth for the foreign-born population - Congo (%)
Place of birth for the foreign-born population - Democratic Republic of Congo (Zaire) (%)
Place of birth for the foreign-born population - Other Middle Africa (%)
Place of birth for the foreign-born population - Egypt (%)
Place of birth for the foreign-born population - Morocco (%)
Place of birth for the foreign-born population - Sudan (%)
Place of birth for the foreign-born population - Other Northern Africa (%)
Place of birth for the foreign-born population - South Africa (%)
Place of birth for the foreign-born population - Other Southern Africa (%)
Place of birth for the foreign-born population - Cabo Verde (%)
Place of birth for the foreign-born population - Ghana (%)
Place of birth for the foreign-born population - Liberia (%)
Place of birth for the foreign-born population - Nigeria (%)
Place of birth for the foreign-born population - Senegal (%)
Place of birth for the foreign-born population - Sierra Leone (%)
Place of birth for the foreign-born population - Other Western Africa (%)
Place of birth for the foreign-born population - Australia (%)
Place of birth for the foreign-born population - New Zealand (%)
Place of birth for the foreign-born population - Fiji (%)
Place of birth for the foreign-born population - Micronesia (%)
Place of birth for the foreign-born population - Bahamas (%)
Place of birth for the foreign-born population - Barbados (%)
Place of birth for the foreign-born population - Cuba (%)
Place of birth for the foreign-born population - Dominica (%)
Place of birth for the foreign-born population - Dominican Republic (%)
Place of birth for the foreign-born population - Grenada (%)
Place of birth for the foreign-born population - Haiti (%)
Place of birth for the foreign-born population - Jamaica (%)
Place of birth for the foreign-born population - St. Vincent and the Grenadines (%)
Place of birth for the foreign-born population - Trinidad and Tobago (%)
Place of birth for the foreign-born population - West Indies (%)
Place of birth for the foreign-born population - Other Caribbean (%)
Place of birth for the foreign-born population - Belize (%)
Place of birth for the foreign-born population - Costa Rica (%)
Place of birth for the foreign-born population - El Salvador (%)
Place of birth for the foreign-born population - Guatemala (%)
Place of birth for the foreign-born population - Honduras (%)
Place of birth for the foreign-born population - Mexico (%)
Place of birth for the foreign-born population - Nicaragua (%)
Place of birth for the foreign-born population - Panama (%)
Place of birth for the foreign-born population - Other Central America (%)
Place of birth for the foreign-born population - Argentina (%)
Place of birth for the foreign-born population - Bolivia (%)
Place of birth for the foreign-born population - Brazil (%)
Place of birth for the foreign-born population - Chile (%)
Place of birth for the foreign-born population - Colombia (%)
Place of birth for the foreign-born population - Ecuador (%)
Place of birth for the foreign-born population - Guyana (%)
Place of birth for the foreign-born population - Peru (%)
Place of birth for the foreign-born population - Uruguay (%)
Place of birth for the foreign-born population - Venezuela (%)
Place of birth for the foreign-born population - Other South America (%)
Place of birth for the foreign-born population - Canada (%)
Place of birth for the foreign-born population - Other Northern America (%)
Place of birth for the foreign-born population - Other (%)
Latest news about races in Hopatcong, NJ collected exclusively by city-data.com from local newspapers, TV, and radio stations
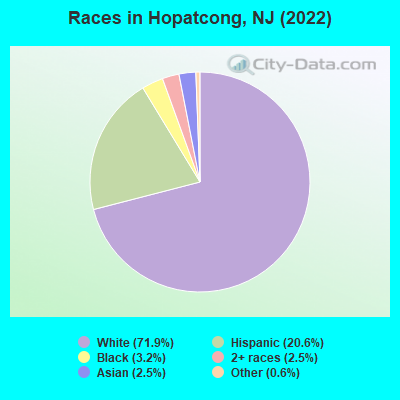
According to 2022 data, the most numerous races in Hopatcong, NJ are White alone (10,445 residents), Hispanic (2,992 residents), and Black alone (462 residents). 84.6% of Hopatcong residents speak English at home. 11.1% of Hopatcong, NJ residents are foreign-born (4.9% born in Latin America, 3.3% born in Europe, 2.1% born in Asia), which is 107.9% less than the foreign-born rate of 23.0% across the entire state of New Jersey.
Race distribution in Hopatcong
2000 2022
5,557,209 66.0% White alone 1,117,191 13.3% Hispanic 1,096,171 13.0% Black alone 477,012 5.7% Asian alone 133,689 1.6% Two or more races 19,565 0.2% Other race alone 11,338 0.1% American Indian alone 2,175 0.03% Native Hawaiian and Other
4,766,476 51.5% White alone 2,028,470 21.9% Hispanic 1,111,632 12.0% Black alone 923,546 10.0% Asian alone 332,237 3.6% Two or more races 89,847 1.0% Other race alone 8,557 0.09% American Indian alone 934 0.01% Native Hawaiian and Other
Income and house value in Hopatcong Median household income in 2022 $114,313 White non-Hispanic householders$128,029 Asian householders$147,778 Some other race householders$116,464 Two or more races householders$107,736 Hispanic or Latino race householdersMedian 2022 house value $308,726 White Non-Hispanic householders$326,011 Black or African American householders$492,299 American Indian or Alaska Native householders $397,777 Asian householders$292,972 Some other race householders$278,750 Two or more races householders$308,507 Hispanic or Latino householders
Median age by race in Hopatcong
44.2 Median age for White residents44.8 44.0 38.0 Median age for Black or African American residents38.7 39.1 -1,094,650,204.7 Median age for American Indian / Alaska Native residents-1,093,004,114.1 -666,666,666.0 63.8 Median age for Asian residents64.0 61.3 -666,666,666.0 Median age for Native Hawaiian / Pacific Islander residents-666,666,666.0 -666,666,666.0 30.3 Median age for Other race residents31.6 29.2 37.4 Median age for Two or more races residents36.7 36.6 46.7 Median age for White alone residents46.7 46.4 29.8 Median age for Hispanic or Latino residents30.0 29.3
Owner/renter occupied households by race in Hopatcong
House owners and renters - White residents 4,256 87.5% Owner occupied608 12.5% Renter occupiedHouse owners and renters - Black or African American residents 253 96.0% Owner occupied11 4.0% Renter occupiedHouse owners and renters - Asian residents 201 96.2% Owner occupied8 3.8% Renter occupiedHouse owners and renters - Other race residents 281 100.0% Owner occupiedHouse owners and renters - Two or more races residents 429 73.1% Owner occupied158 26.9% Renter occupiedHouse owners and renters - White alone residents 4,010 86.7% Owner occupied614 13.3% Renter occupiedHouse owners and renters - Hispanic or Latino residents 890 93.2% Owner occupied65 6.8% Renter occupied
Language usage in Hopatcong
English speakers - Total 84.6% of residents of Hopatcong speak English at home.
11.0% of residents speak Spanish at home 1,260 82.0% Speak English very well276 18.0% Speak English less than very well4.9% of residents speak other language at home 536 77.6% Speak English very well155 22.4% Speak English less than very well
English speakers - Born in the United States 93.3% of residents of Hopatcong speak English at home.
6.2% of residents speak Spanish at home 160 100.0% Speak English very well1.0% of residents speak other language at home 25 100.0% Speak English very well
English speakers - Native, born elsewhere 31.0% of residents of Hopatcong speak English at home.
73.3% of residents speak Spanish at home 197 67.7% Speak English very well94 32.3% Speak English less than very well3.3% of residents speak other language at home 13 100.0% Speak English very well
English speakers - Foreign-born 27.1% of residents of Hopatcong speak English at home.
34.2% of residents speak Spanish at home 415 71.8% Speak English very well163 28.2% Speak English less than very well37.7% of residents speak other language at home 470 73.9% Speak English very well166 26.1% Speak English less than very well
White (Caucasian) - Speak only English Native:
97.5% (9,945)Foreign-born:
28.2% (155)
White (Caucasian) - Speak another language Native:
2.5% (253)Foreign-born:
72.2% (396)
Black or African American - Speak only English Native:
97.8% (260)Foreign-born:
68.3% (80)
Black or African American - Speak another language Native:
2.6% (7)Foreign-born:
32.6% (38)
Asian - Speak only English Native:
100.0% (128)Foreign-born:
18.3% (59)
Other race - Speak only English Native:
41.5% (309)Foreign-born:
40.1% (56)
Other race - Speak another language Native:
29.7% (221)Foreign-born:
67.5% (94)
Two or more races - Speak only English Native:
65.2% (924)Foreign-born:
7.1% (42)
Two or more races - Speak another language Native:
36.4% (515)Foreign-born:
85.2% (496)
White alone - Speak only English Native:
99.5% (9,662)Foreign-born:
34.5% (157)
White alone - Speak another language Native:
0.8% (77)Foreign-born:
66.1% (301)
Hispanic or Latino - Speak only English Native:
54.5% (1,178)Foreign-born:
12.3% (79)
Hispanic or Latino - Speak another language Native:
45.6% (985)Foreign-born:
87.6% (562)
Foreign-born residents in Hopatcong 1,608 residents are foreign born (4.9% Latin America , 3.3% Europe , 2.1% Asia ).
This city:
11.1%New Jersey:
23.2%
Marital status for residents in Hopatcong Marital status - White (Caucasian) population 15 years and over
Males 33.1% Never married53.7% Now married2.5% Separated2.6% Widowed8.1% DivorcedFemales 23.6% Never married57.1% Now married1.2% Separated7.3% Widowed10.8% DivorcedWomen who gave birth in the past 12 months Now married:
48.7% (35)Unmarried:
51.3% (37)
Women who did not give birth in the past 12 months Now married:
53.7% (1,302)Unmarried:
46.3% (1,121)
Marital status - Black or African American population 15 years and over
Males 16.0% Never married78.3% Now married0.0% Separated5.7% Widowed0.0% DivorcedFemales 23.1% Never married70.8% Now married0.0% Separated6.1% Widowed0.0% DivorcedWomen who did not give birth in the past 12 months Now married:
71.1% (101)Unmarried:
28.9% (41)
Marital status - Asian population 15 years and over
Males 35.1% Never married57.1% Now married0.0% Separated0.0% Widowed7.7% DivorcedFemales 37.3% Never married43.7% Now married3.0% Separated11.6% Widowed4.5% DivorcedWomen who did not give birth in the past 12 months Now married:
23.3% (27)Unmarried:
76.7% (90)
Marital status - Other race population 15 years and over
Males 12.6% Never married67.8% Now married0.0% Separated0.0% Widowed19.7% DivorcedFemales 8.6% Never married70.7% Now married0.0% Separated0.0% Widowed20.7% DivorcedWomen who did not give birth in the past 12 months Now married:
88.8% (110)Unmarried:
11.2% (14)
Marital status - Two or more races population 15 years and over
Males 42.5% Never married41.2% Now married6.5% Separated0.0% Widowed9.8% DivorcedFemales 46.5% Never married30.3% Now married3.5% Separated0.0% Widowed19.7% DivorcedWomen who gave birth in the past 12 months Now married:
54.3% (49)Unmarried:
45.7% (42)
Women who did not give birth in the past 12 months Now married:
31.0% (186)Unmarried:
69.0% (414)
Marital status - White alone, not Hispanic / Latino population 15 years and over
Males 32.1% Never married55.4% Now married1.1% Separated2.8% Widowed8.5% DivorcedFemales 22.8% Never married58.2% Now married0.9% Separated7.2% Widowed11.0% DivorcedWomen who gave birth in the past 12 months Now married:
48.7% (36)Unmarried:
51.3% (38)
Women who did not give birth in the past 12 months Now married:
54.9% (1,224)Unmarried:
45.1% (1,004)
Marital status - Hispanic or Latino population 15 years and over
Males 37.3% Never married41.4% Now married10.2% Separated0.0% Widowed11.1% DivorcedFemales 35.3% Never married41.2% Now married3.9% Separated3.6% Widowed16.0% DivorcedWomen who gave birth in the past 12 months Now married:
54.3% (29)Unmarried:
45.7% (25)
Women who did not give birth in the past 12 months Now married:
48.1% (344)Unmarried:
51.9% (371)
Ancestries in Hopatcong
797 16.1% Italian525 10.6% Irish298 6.0% German280 5.7% English233 4.7% American169 3.4% Polish119 2.4% Scotch-Irish106 2.1% Greek93 1.9% Ukrainian66 1.3% European65 1.3% Hungarian62 1.3% Ghanaian58 1.2% Portuguese48 1.0% Scottish36 0.7% African33 0.7% Dutch30 0.6% Barbadian29 0.6% British25 0.5% Austrian23 0.5% Slovak23 0.5% French20 0.4% Albanian15 0.3% Eastern European14 0.3% Jamaican13 0.3% Haitian12 0.2% Luxembourger11 0.2% Syrian11 0.2% Lithuanian10 0.2% Basque9 0.2% Russian9 0.2% Egyptian9 0.2% Pennsylvania German6 0.1% Czech3 0.06% Estonian
Children Nativity (place of birth) in Hopatcong
Children under 6 years - Living with two parents Both parents native 378 100.0% NativeBoth parents foreign-born 34 100.0% NativeOne native, one foreign-born parent 148 100.0% NativeChildren under 6 years - Living with one parent Native parent 152 100.0% NativeForeign-born parent 119 100.0% NativeChildren 6 to 17 years - Living with two parents Both parents native 1,049 100.0% NativeBoth parents foreign-born 52 79.3% Native14 20.7% Foreign-bornOne native, one foreign-born parent 106 100.0% NativeChildren 6 to 17 years - Living with one parent Native parent 416 100.0% NativeForeign-born parent 97 50.0% Native97 50.0% Foreign-born
Grandparents responsible for own grandchildren in Hopatcong
Grandparents (30 to 59 years) White / Caucasian 15 24.0% Responsible for grandchildren46 76.0% Not responsible for grandchildrenOther race 33 100.0% Not responsible for grandchildrenTwo or more races 13 40.8% Responsible for grandchildren19 59.2% Not responsible for grandchildrenWhite alone, not Hispanic / Latino 10 14.8% Responsible for grandchildren60 85.2% Not responsible for grandchildrenHispanic or Latino 19 33.3% Responsible for grandchildren38 66.7% Not responsible for grandchildrenGrandparents (60 years and over) White / Caucasian 7 6.0% Responsible for grandchildren108 94.0% Not responsible for grandchildrenTwo or more races 2 100.0% Not responsible for grandchildrenWhite alone, not Hispanic / Latino 8 6.1% Responsible for grandchildren119 93.9% Not responsible for grandchildren