Races in Homestead, Florida (FL) Detailed Stats
Data:
Races - White alone (%)
Races - White alone (% change since 2000)
Races - Black alone (%)
Races - Black alone (% change since 2000)
Races - American Indian alone (%)
Races - American Indian alone (% change since 2000)
Races - Asian alone (%)
Races - Asian alone (% change since 2000)
Races - Hispanic (%)
Races - Hispanic (% change since 2000)
Races - Native Hawaiian and Other Pacific Islander alone (%)
Races - Native Hawaiian and Other Pacific Islander alone (% change since 2000)
Races - Two or more races(%)
Races - Two or more races(% change since 2000)
Races - Other race alone (%)
Races - Other race alone (% change since 2000)
Racial diversity
Place of birth - Born in state of residence (%)
Place of birth - Born in state of residence (%) - White
Place of birth - Born in state of residence (%) - Black or African American
Place of birth - Born in state of residence (%) - Asian
Place of birth - Born in state of residence (%) - Hispanic or Latino
Place of birth - Born in state of residence (%) - American Indian and Alaska Native
Place of birth - Born in state of residence (%) - Multirace
Place of birth - Born in state of residence (%) - Other Race
Place of birth - Born in other state (%)
Place of birth - Born in other state (%) - White
Place of birth - Born in other state (%) - Black or African American
Place of birth - Born in other state (%) - Asian
Place of birth - Born in other state (%) - Hispanic or Latino
Place of birth - Born in other state (%) - American Indian and Alaska Native
Place of birth - Born in other state (%) - Multirace
Place of birth - Born in other state (%) - Other Race
Place of birth - Native, outside of US (%)
Place of birth - Native, outside of US (%) - White
Place of birth - Native, outside of US (%) - Black or African American
Place of birth - Native, outside of US (%) - Asian
Place of birth - Native, outside of US (%) - Hispanic or Latino
Place of birth - Native, outside of US (%) - American Indian and Alaska Native
Place of birth - Native, outside of US (%) - Multirace
Place of birth - Native, outside of US (%) - Other Race
Place of birth - Foreign born (%)
Place of birth - Foreign born (%) - White
Place of birth - Foreign born (%) - Black or African American
Place of birth - Foreign born (%) - Asian
Place of birth - Foreign born (%) - Hispanic or Latino
Place of birth - Foreign born (%) - American Indian and Alaska Native
Place of birth - Foreign born (%) - Multirace
Place of birth - Foreign born (%) - Other Race
Residents speaking English at home (%)
Residents speaking English at home - Born in the United States (%)
Residents speaking English at home - Native, born elsewhere (%)
Residents speaking English at home - Foreign born (%)
Residents speaking Spanish at home (%)
Residents speaking Spanish at home - Born in the United States (%)
Residents speaking Spanish at home - Native, born elsewhere (%)
Residents speaking Spanish at home - Foreign born (%)
Residents speaking other language at home (%)
Residents speaking other language at home - Born in the United States (%)
Residents speaking other language at home - Native, born elsewhere (%)
Residents speaking other language at home - Foreign born (%)
Marital status - Never married (%)
Marital status - Now married (%)
Marital status - Separated (%)
Marital status - Widowed (%)
Marital status - Divorced (%)
Ancestries Reported - Arab (%)
Ancestries Reported - Czech (%)
Ancestries Reported - Danish (%)
Ancestries Reported - Dutch (%)
Ancestries Reported - English (%)
Ancestries Reported - French (%)
Ancestries Reported - French Canadian (%)
Ancestries Reported - German (%)
Ancestries Reported - Greek (%)
Ancestries Reported - Hungarian (%)
Ancestries Reported - Irish (%)
Ancestries Reported - Italian (%)
Ancestries Reported - Lithuanian (%)
Ancestries Reported - Norwegian (%)
Ancestries Reported - Polish (%)
Ancestries Reported - Portuguese (%)
Ancestries Reported - Russian (%)
Ancestries Reported - Scotch-Irish (%)
Ancestries Reported - Scottish (%)
Ancestries Reported - Slovak (%)
Ancestries Reported - Subsaharan African (%)
Ancestries Reported - Swedish (%)
Ancestries Reported - Swiss (%)
Ancestries Reported - Ukrainian (%)
Ancestries Reported - United States (%)
Ancestries Reported - Welsh (%)
Ancestries Reported - West Indian (%)
Ancestries Reported - Other (%)
Geographical mobility - Same house 1 year ago (%)
Geographical mobility - Same house 1 year ago (%) - White
Geographical mobility - Same house 1 year ago (%) - Black or African American
Geographical mobility - Same house 1 year ago (%) - Asian
Geographical mobility - Same house 1 year ago (%) - Hispanic or Latino
Geographical mobility - Same house 1 year ago (%) - American Indian and Alaska Native
Geographical mobility - Same house 1 year ago (%) - Multirace
Geographical mobility - Same house 1 year ago (%) - Other Race
Geographical mobility - Moved within same county (%)
Geographical mobility - Moved within same county (%) - White
Geographical mobility - Moved within same county (%) - Black or African American
Geographical mobility - Moved within same county (%) - Asian
Geographical mobility - Moved within same county (%) - Hispanic or Latino
Geographical mobility - Moved within same county (%) - American Indian and Alaska Native
Geographical mobility - Moved within same county (%) - Multirace
Geographical mobility - Moved within same county (%) - Other Race
Geographical mobility - Moved from different county within same state (%)
Geographical mobility - Moved from different county within same state (%) - White
Geographical mobility - Moved from different county within same state (%) - Black or African American
Geographical mobility - Moved from different county within same state (%) - Asian
Geographical mobility - Moved from different county within same state (%) - Hispanic or Latino
Geographical mobility - Moved from different county within same state (%) - American Indian and Alaska Native
Geographical mobility - Moved from different county within same state (%) - Multirace
Geographical mobility - Moved from different county within same state (%) - Other Race
Geographical mobility - Moved from different state (%)
Geographical mobility - Moved from different state (%) - White
Geographical mobility - Moved from different state (%) - Black or African American
Geographical mobility - Moved from different state (%) - Asian
Geographical mobility - Moved from different state (%) - Hispanic or Latino
Geographical mobility - Moved from different state (%) - American Indian and Alaska Native
Geographical mobility - Moved from different state (%) - Multirace
Geographical mobility - Moved from different state (%) - Other Race
Geographical mobility - Moved from abroad (%)
Geographical mobility - Moved from abroad (%) - White
Geographical mobility - Moved from abroad (%) - Black or African American
Geographical mobility - Moved from abroad (%) - Asian
Geographical mobility - Moved from abroad (%) - Hispanic or Latino
Geographical mobility - Moved from abroad (%) - American Indian and Alaska Native
Geographical mobility - Moved from abroad (%) - Multirace
Geographical mobility - Moved from abroad (%) - Other Race
Place of birth for the foreign-born population - Ireland (%)
Place of birth for the foreign-born population - Denmark (%)
Place of birth for the foreign-born population - Norway (%)
Place of birth for the foreign-born population - Sweden (%)
Place of birth for the foreign-born population - United Kingdom (%)
Place of birth for the foreign-born population - England (%)
Place of birth for the foreign-born population - Scotland (%)
Place of birth for the foreign-born population - Other Northern Europe (%)
Place of birth for the foreign-born population - Austria (%)
Place of birth for the foreign-born population - Belgium (%)
Place of birth for the foreign-born population - France (%)
Place of birth for the foreign-born population - Germany (%)
Place of birth for the foreign-born population - Netherlands (%)
Place of birth for the foreign-born population - Switzerland (%)
Place of birth for the foreign-born population - Other Western Europe (%)
Place of birth for the foreign-born population - Greece (%)
Place of birth for the foreign-born population - Italy (%)
Place of birth for the foreign-born population - Portugal (%)
Place of birth for the foreign-born population - Spain (%)
Place of birth for the foreign-born population - Other Southern Europe (%)
Place of birth for the foreign-born population - Albania (%)
Place of birth for the foreign-born population - Belarus (%)
Place of birth for the foreign-born population - Bosnia and Herzegovina (%)
Place of birth for the foreign-born population - Bulgaria (%)
Place of birth for the foreign-born population - Croatia (%)
Place of birth for the foreign-born population - Czechoslovakia (%)
Place of birth for the foreign-born population - Hungary (%)
Place of birth for the foreign-born population - Latvia (%)
Place of birth for the foreign-born population - Lithuania (%)
Place of birth for the foreign-born population - North Macedonia (Macedonia) (%)
Place of birth for the foreign-born population - Moldova (%)
Place of birth for the foreign-born population - Poland (%)
Place of birth for the foreign-born population - Romania (%)
Place of birth for the foreign-born population - Russia (%)
Place of birth for the foreign-born population - Serbia (%)
Place of birth for the foreign-born population - Ukraine (%)
Place of birth for the foreign-born population - Other Eastern Europe (%)
Place of birth for the foreign-born population - China (%)
Place of birth for the foreign-born population - Hong Kong (%)
Place of birth for the foreign-born population - Taiwan (%)
Place of birth for the foreign-born population - Japan (%)
Place of birth for the foreign-born population - Korea (%)
Place of birth for the foreign-born population - Other Eastern Asia (%)
Place of birth for the foreign-born population - Afghanistan (%)
Place of birth for the foreign-born population - Bangladesh (%)
Place of birth for the foreign-born population - India (%)
Place of birth for the foreign-born population - Iran (%)
Place of birth for the foreign-born population - Kazakhstan (%)
Place of birth for the foreign-born population - Nepal (%)
Place of birth for the foreign-born population - Pakistan (%)
Place of birth for the foreign-born population - Sri Lanka (%)
Place of birth for the foreign-born population - Uzbekistan (%)
Place of birth for the foreign-born population - Other South Central Asia (%)
Place of birth for the foreign-born population - Burma (%)
Place of birth for the foreign-born population - Cambodia (%)
Place of birth for the foreign-born population - Indonesia (%)
Place of birth for the foreign-born population - Laos (%)
Place of birth for the foreign-born population - Malaysia (%)
Place of birth for the foreign-born population - Philippines (%)
Place of birth for the foreign-born population - Singapore (%)
Place of birth for the foreign-born population - Thailand (%)
Place of birth for the foreign-born population - Vietnam (%)
Place of birth for the foreign-born population - Other South Eastern Asia (%)
Place of birth for the foreign-born population - Armenia (%)
Place of birth for the foreign-born population - Iraq (%)
Place of birth for the foreign-born population - Israel (%)
Place of birth for the foreign-born population - Jordan (%)
Place of birth for the foreign-born population - Kuwait (%)
Place of birth for the foreign-born population - Lebanon (%)
Place of birth for the foreign-born population - Saudi Arabia (%)
Place of birth for the foreign-born population - Syria (%)
Place of birth for the foreign-born population - Turkey (%)
Place of birth for the foreign-born population - Yemen (%)
Place of birth for the foreign-born population - Other Western Asia (%)
Place of birth for the foreign-born population - Eritrea (%)
Place of birth for the foreign-born population - Ethiopia (%)
Place of birth for the foreign-born population - Kenya (%)
Place of birth for the foreign-born population - Somalia (%)
Place of birth for the foreign-born population - Uganda (%)
Place of birth for the foreign-born population - Zimbabwe (%)
Place of birth for the foreign-born population - Other Eastern Africa (%)
Place of birth for the foreign-born population - Cameroon (%)
Place of birth for the foreign-born population - Congo (%)
Place of birth for the foreign-born population - Democratic Republic of Congo (Zaire) (%)
Place of birth for the foreign-born population - Other Middle Africa (%)
Place of birth for the foreign-born population - Egypt (%)
Place of birth for the foreign-born population - Morocco (%)
Place of birth for the foreign-born population - Sudan (%)
Place of birth for the foreign-born population - Other Northern Africa (%)
Place of birth for the foreign-born population - South Africa (%)
Place of birth for the foreign-born population - Other Southern Africa (%)
Place of birth for the foreign-born population - Cabo Verde (%)
Place of birth for the foreign-born population - Ghana (%)
Place of birth for the foreign-born population - Liberia (%)
Place of birth for the foreign-born population - Nigeria (%)
Place of birth for the foreign-born population - Senegal (%)
Place of birth for the foreign-born population - Sierra Leone (%)
Place of birth for the foreign-born population - Other Western Africa (%)
Place of birth for the foreign-born population - Australia (%)
Place of birth for the foreign-born population - New Zealand (%)
Place of birth for the foreign-born population - Fiji (%)
Place of birth for the foreign-born population - Micronesia (%)
Place of birth for the foreign-born population - Bahamas (%)
Place of birth for the foreign-born population - Barbados (%)
Place of birth for the foreign-born population - Cuba (%)
Place of birth for the foreign-born population - Dominica (%)
Place of birth for the foreign-born population - Dominican Republic (%)
Place of birth for the foreign-born population - Grenada (%)
Place of birth for the foreign-born population - Haiti (%)
Place of birth for the foreign-born population - Jamaica (%)
Place of birth for the foreign-born population - St. Vincent and the Grenadines (%)
Place of birth for the foreign-born population - Trinidad and Tobago (%)
Place of birth for the foreign-born population - West Indies (%)
Place of birth for the foreign-born population - Other Caribbean (%)
Place of birth for the foreign-born population - Belize (%)
Place of birth for the foreign-born population - Costa Rica (%)
Place of birth for the foreign-born population - El Salvador (%)
Place of birth for the foreign-born population - Guatemala (%)
Place of birth for the foreign-born population - Honduras (%)
Place of birth for the foreign-born population - Mexico (%)
Place of birth for the foreign-born population - Nicaragua (%)
Place of birth for the foreign-born population - Panama (%)
Place of birth for the foreign-born population - Other Central America (%)
Place of birth for the foreign-born population - Argentina (%)
Place of birth for the foreign-born population - Bolivia (%)
Place of birth for the foreign-born population - Brazil (%)
Place of birth for the foreign-born population - Chile (%)
Place of birth for the foreign-born population - Colombia (%)
Place of birth for the foreign-born population - Ecuador (%)
Place of birth for the foreign-born population - Guyana (%)
Place of birth for the foreign-born population - Peru (%)
Place of birth for the foreign-born population - Uruguay (%)
Place of birth for the foreign-born population - Venezuela (%)
Place of birth for the foreign-born population - Other South America (%)
Place of birth for the foreign-born population - Canada (%)
Place of birth for the foreign-born population - Other Northern America (%)
Place of birth for the foreign-born population - Other (%)
Latest news about races in Homestead, FL collected exclusively by city-data.com from local newspapers, TV, and radio stations
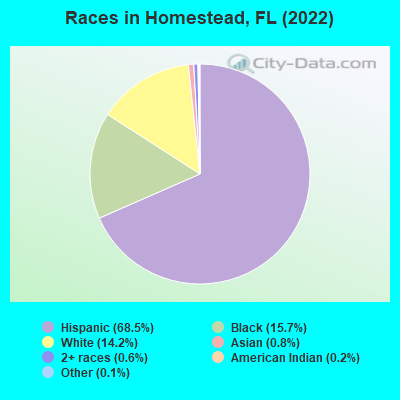
According to 2022 data, the most numerous races in Homestead, FL are White alone (11,547 residents), Hispanic (55,836 residents), and Black alone (12,795 residents). 29.2% of Homestead residents speak English at home. 38.0% of Homestead, FL residents are foreign-born (36.5% born in Latin America), which is 44.8% greater than the foreign-born rate of 21.0% across the entire state of Florida.
Race distribution in Homestead
2000 2022
10,458,509 65.4% White alone 2,682,715 16.8% Hispanic 2,264,268 14.2% Black alone 261,693 1.6% Asian alone 236,954 1.5% Two or more races 42,358 0.3% American Indian alone 28,994 0.2% Other race alone 6,887 0.04% Native Hawaiian and Other
11,309,403 50.8% White alone 6,025,039 27.1% Hispanic 3,241,015 14.6% Black alone 861,630 3.9% Two or more races 623,692 2.8% Asian alone 152,054 0.7% Other race alone 22,504 0.1% American Indian alone 9,486 0.04% Native Hawaiian and Other
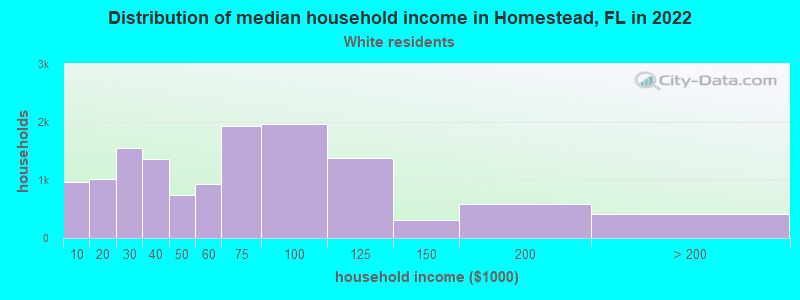
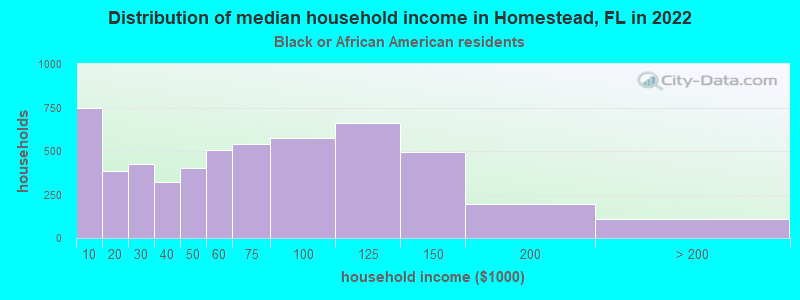
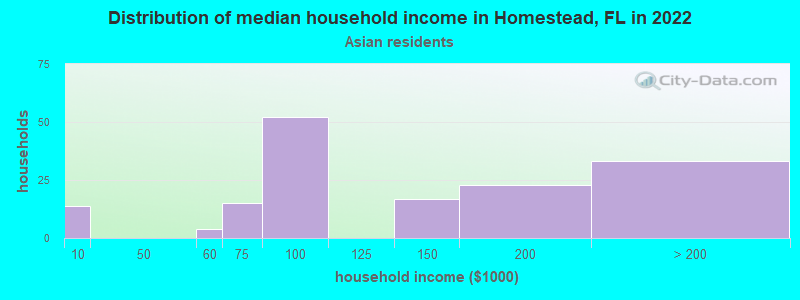
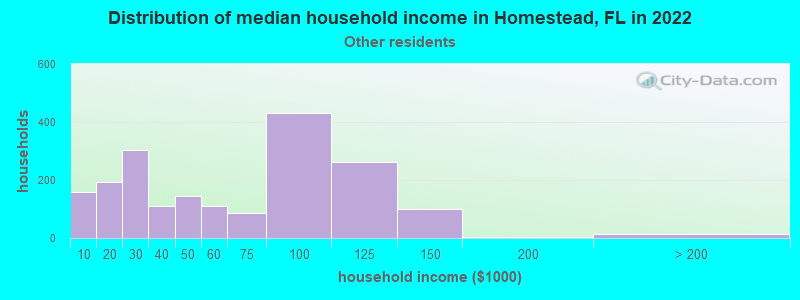
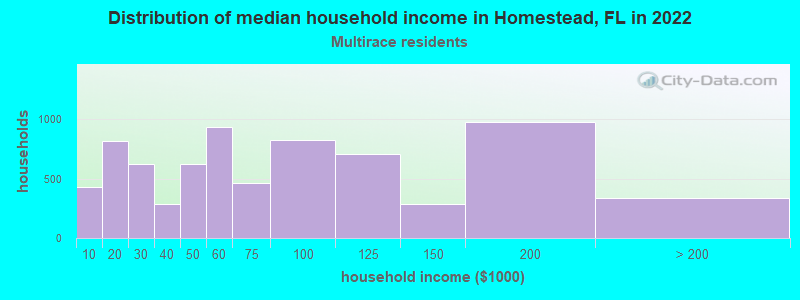
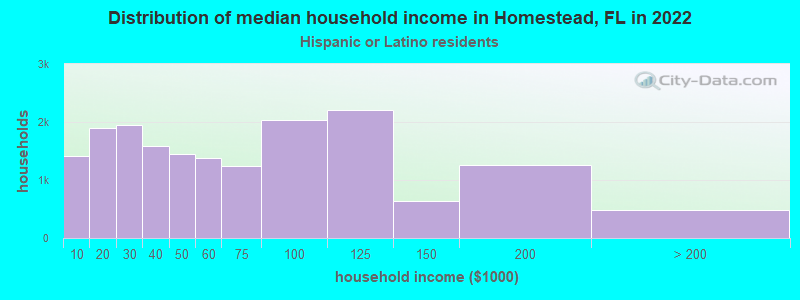
Income and house value in Homestead Median household income in 2022 $67,250 White non-Hispanic householders$77,571 Black householders$24,380 American Indian and Alaska Native householders$79,803 Some other race householders$59,491 Two or more races householders$52,870 Hispanic or Latino race householdersMedian 2022 house value $488,607 White Non-Hispanic householders$397,502 Black or African American householders$483,518 American Indian or Alaska Native householders $490,643 Asian householders$372,054 Some other race householders$372,563 Two or more races householders$411,753 Hispanic or Latino householders
Median age by race in Homestead
32.8 Median age for White residents30.1 36.3 31.7 Median age for Black or African American residents30.1 35.9 43.0 Median age for American Indian / Alaska Native residents42.9 44.2 52.8 Median age for Asian residents52.0 64.8 -666,666,666.0 Median age for Native Hawaiian / Pacific Islander residents-666,666,666.0 -666,666,666.0 37.2 Median age for Other race residents32.6 37.9 36.2 Median age for Two or more races residents32.7 39.5 34.4 Median age for White alone residents36.0 28.8 33.7 Median age for Hispanic or Latino residents30.7 39.0
Owner/renter occupied households by race in Homestead
House owners and renters - White residents 6,001 45.6% Owner occupied7,157 54.4% Renter occupiedHouse owners and renters - Black or African American residents 1,759 34.9% Owner occupied3,281 65.1% Renter occupiedHouse owners and renters - American Indian / Alaska Native residents 36 9.1% Owner occupied363 90.9% Renter occupiedHouse owners and renters - Asian residents 135 94.9% Owner occupied7 5.1% Renter occupiedHouse owners and renters - Native Hawaiian / Pacific Islander residents 15 100.0% Owner occupiedHouse owners and renters - Other race residents 309 27.7% Owner occupied807 72.3% Renter occupiedHouse owners and renters - Two or more races residents 3,713 50.7% Owner occupied3,608 49.3% Renter occupiedHouse owners and renters - White alone residents 2,996 67.8% Owner occupied1,424 32.2% Renter occupiedHouse owners and renters - Hispanic or Latino residents 7,233 41.2% Owner occupied10,310 58.8% Renter occupied
Language usage in Homestead
English speakers - Total 29.2% of residents of Homestead speak English at home.
63.6% of residents speak Spanish at home 25,919 53.3% Speak English very well22,682 46.7% Speak English less than very well7.1% of residents speak other language at home 5,058 92.7% Speak English very well398 7.3% Speak English less than very well
English speakers - Born in the United States 66.5% of residents of Homestead speak English at home.
32.1% of residents speak Spanish at home 2,984 100.0% Speak English very well1.4% of residents speak other language at home 130 100.0% Speak English very well
English speakers - Native, born elsewhere 24.1% of residents of Homestead speak English at home.
75.9% of residents speak Spanish at home 3,719 68.4% Speak English very well1,716 31.6% Speak English less than very well
English speakers - Foreign-born 10.0% of residents of Homestead speak English at home.
81.1% of residents speak Spanish at home 7,284 26.6% Speak English very well20,111 73.4% Speak English less than very well8.9% of residents speak other language at home 2,624 86.8% Speak English very well398 13.2% Speak English less than very well
White (Caucasian) - Speak only English Native:
46.9% (9,845)Foreign-born:
3.4% (499)
White (Caucasian) - Speak another language Native:
53.1% (11,154)Foreign-born:
96.6% (14,175)
Black or African American - Speak only English Native:
73.3% (6,831)Foreign-born:
32.0% (1,073)
Black or African American - Speak another language Native:
26.7% (2,488)Foreign-born:
68.0% (2,285)
American Indian / Alaska Native - Speak only English Native:
26.8% (179)Foreign-born:
1.0% (9)
American Indian / Alaska Native - Speak another language Native:
82.9% (553)Foreign-born:
97.6% (910)
Asian - Speak only English Native:
89.4% (101)Foreign-born:
22.8% (81)
Asian - Speak another language Native:
12.3% (14)Foreign-born:
76.4% (273)
Native Hawaiian / Pacific Islander - Speak only English Native:
87.6% (40)Foreign-born:
100.0% (8)
Other race - Speak only English Native:
19.0% (554)Foreign-born:
13.2% (608)
Other race - Speak another language Native:
81.0% (2,360)Foreign-born:
86.6% (3,983)
Two or more races - Speak only English Native:
16.9% (1,699)Foreign-born:
8.9% (1,051)
Two or more races - Speak another language Native:
83.1% (8,325)Foreign-born:
91.1% (10,715)
White alone - Speak only English Native:
81.4% (5,591)Foreign-born:
64.1% (569)
White alone - Speak another language Native:
18.9% (1,301)Foreign-born:
45.2% (401)
Hispanic or Latino - Speak only English Native:
14.3% (3,372)Foreign-born:
4.4% (1,285)
Hispanic or Latino - Speak another language Native:
85.7% (20,184)Foreign-born:
95.6% (27,668)
Foreign-born residents in Homestead 30,246 residents are foreign born (36.5% Latin America ).
This city:
38.0%Florida:
21.1%
Marital status for residents in Homestead Marital status - White (Caucasian) population 15 years and over
Males 41.0% Never married50.4% Now married0.4% Separated2.4% Widowed5.7% DivorcedFemales 38.7% Never married42.6% Now married5.4% Separated4.3% Widowed9.1% DivorcedWomen who gave birth in the past 12 months Now married:
70.2% (258)Unmarried:
29.8% (109)
Women who did not give birth in the past 12 months Now married:
48.8% (2,253)Unmarried:
51.2% (2,360)
Marital status - Black or African American population 15 years and over
Males 55.7% Never married27.1% Now married0.0% Separated2.7% Widowed14.5% DivorcedFemales 49.1% Never married32.9% Now married4.5% Separated7.3% Widowed6.1% DivorcedWomen who gave birth in the past 12 months Now married:
17.5% (127)Unmarried:
82.5% (599)
Women who did not give birth in the past 12 months Now married:
50.6% (1,357)Unmarried:
49.4% (1,327)
Marital status - American Indian / Alaska Native population 15 years and over
Males 37.3% Never married56.9% Now married0.0% Separated5.8% Widowed0.0% DivorcedFemales 24.7% Never married63.8% Now married0.0% Separated7.6% Widowed3.9% DivorcedWomen who did not give birth in the past 12 months Now married:
55.1% (266)Unmarried:
44.9% (217)
Marital status - Asian population 15 years and over
Males 47.6% Never married35.0% Now married0.0% Separated17.5% Widowed0.0% DivorcedFemales 35.5% Never married39.3% Now married0.0% Separated19.0% Widowed6.2% DivorcedWomen who did not give birth in the past 12 months Now married:
61.9% (63)Unmarried:
38.1% (39)
Marital status - Other race population 15 years and over
Males 50.6% Never married40.3% Now married1.2% Separated0.8% Widowed7.1% DivorcedFemales 40.5% Never married44.2% Now married5.7% Separated0.9% Widowed8.7% DivorcedWomen who gave birth in the past 12 months Now married:
40.8% (71)Unmarried:
59.2% (103)
Women who did not give birth in the past 12 months Now married:
48.6% (1,025)Unmarried:
51.4% (1,082)
Marital status - Two or more races population 15 years and over
Males 47.9% Never married38.5% Now married3.9% Separated0.6% Widowed9.0% DivorcedFemales 40.9% Never married38.9% Now married3.1% Separated4.5% Widowed12.5% DivorcedWomen who gave birth in the past 12 months Now married:
61.9% (402)Unmarried:
38.1% (247)
Women who did not give birth in the past 12 months Now married:
43.1% (2,678)Unmarried:
56.9% (3,542)
Marital status - White alone, not Hispanic / Latino population 15 years and over
Males 37.4% Never married57.9% Now married0.0% Separated0.0% Widowed4.7% DivorcedFemales 30.2% Never married51.9% Now married2.9% Separated3.4% Widowed11.7% DivorcedWomen who gave birth in the past 12 months Now married:
53.5% (22)Unmarried:
46.5% (19)
Women who did not give birth in the past 12 months Now married:
48.3% (893)Unmarried:
51.7% (958)
Marital status - Hispanic or Latino population 15 years and over
Males 45.8% Never married43.0% Now married1.6% Separated2.7% Widowed6.8% DivorcedFemales 40.6% Never married38.4% Now married4.7% Separated4.7% Widowed11.6% DivorcedWomen who gave birth in the past 12 months Now married:
61.5% (562)Unmarried:
38.5% (352)
Women who did not give birth in the past 12 months Now married:
41.8% (5,532)Unmarried:
58.2% (7,687)
Ancestries in Homestead
2,836 5.3% Haitian1,897 3.5% Jamaican1,655 3.1% American735 1.4% English496 0.9% Irish430 0.8% Italian391 0.7% German277 0.5% French269 0.5% Arab223 0.4% West Indian201 0.4% Portuguese186 0.3% Greek178 0.3% Trinidadian and Tobagonian113 0.2% Guyanese95 0.2% Lebanese86 0.2% Scottish83 0.2% Nigerian60 0.1% African55 0.1% Yugoslavian52 0.10% Polish43 0.08% Canadian42 0.08% Swedish34 0.06% French Canadian31 0.06% Syrian28 0.05% British27 0.05% Eastern European27 0.05% Bahamian23 0.04% Brazilian20 0.04% European19 0.04% Dutch14 0.03% Northern European14 0.03% Scandinavian13 0.02% British West Indian7 0.01% Ukrainian7 0.01% Norwegian5 0.01% Russian5 0.01% Scotch-Irish
Geographical mobility in Homestead Same house 1 year ago 35,003 91.2% White (Caucasian)14,053 90.1% Black or African American1,151 55.9% American Indian / Alaska Native435 88.7% Asian7,531 93.6% Other race20,807 92.7% Two or more races9,974 87.8% White alone, not Hispanic / Latino51,204 92.4% Hispanic or LatinoMoved within same county 1,773 4.6% White / Caucasian1,000 6.4% Black or African American613 29.7% American Indian / Alaska Native63 12.8% Asian56 100.0% Native Hawaiian / Pacific Islander355 4.4% Other race1,161 5.2% Two or more races132 1.2% White alone, not Hispanic / Latino3,117 5.6% Hispanic or LatinoMoved within same state 6 0.0% White / Caucasian24 0.2% Black or African American42 0.5% Other race107 0.5% Two or more races6 0.1% White alone, not Hispanic / Latino215 0.4% Hispanic or LatinoMoved from different state 1,197 3.1% White / Caucasian243 1.6% Black or African American10 0.5% American Indian / Alaska Native1,197 10.5% White alone, not Hispanic / LatinoMoved from abroad 412 1.1% White178 8.7% American Indian / Alaska Native71 0.9% Other race382 1.7% Two or more races55 0.5% White alone, not Hispanic / Latino882 1.6% Hispanic or Latino
Children Nativity (place of birth) in Homestead
Children under 6 years - Living with two parents Both parents native 1,575 100.0% NativeBoth parents foreign-born 1,065 100.0% NativeOne native, one foreign-born parent 942 100.0% NativeChildren under 6 years - Living with one parent Native parent 769 71.5% Native307 28.5% Foreign-bornForeign-born parent 1,550 100.0% NativeChildren 6 to 17 years - Living with two parents Both parents native 2,340 100.0% NativeBoth parents foreign-born 2,666 89.9% Native299 10.1% Foreign-bornOne native, one foreign-born parent 2,595 100.0% NativeChildren 6 to 17 years - Living with one parent Native parent 2,076 100.0% NativeForeign-born parent 3,731 50.8% Native3,613 49.2% Foreign-born
Place of birth for residents in Homestead 29,240 Americas29,182 Latin America13,882 Caribbean11,052 Central America4,247 South America481 Europe355 Asia195 Southern Europe173 South Central Asia155 Northern Europe154 Africa120 Western Africa81 Western Europe68 Eastern Asia68 China62 South Eastern Asia57 Northern America47 Eastern Europe33 Eastern Africa12 Oceania9,098 Cuba5,483 Guatemala2,661 Mexico2,597 Haiti1,469 Colombia1,465 Nicaragua1,320 Jamaica975 Venezuela755 El Salvador644 Peru568 Dominican Republic543 Honduras410 Ecuador242 Argentina201 Brazil183 Trinidad and Tobago163 Guyana126 Chile120 Nigeria113 Bahamas104 Bangladesh93 England74 Greece69 Costa Rica68 China67 Germany62 Philippines61 United Kingdom59 Panama57 Canada50 India47 Portugal39 Spain34 Bosnia and Herzegovina32 Italy17 Pakistan13 Netherlands12 Fiji11 Belize5 Ukraine5 Russia
Grandparents responsible for own grandchildren in Homestead
Grandparents (30 to 59 years) White / Caucasian 93 26.6% Responsible for grandchildren257 73.4% Not responsible for grandchildrenBlack or African American 221 69.8% Responsible for grandchildren96 30.2% Not responsible for grandchildrenOther race 14 7.5% Responsible for grandchildren172 92.5% Not responsible for grandchildrenTwo or more races 92 100.0% Not responsible for grandchildrenWhite alone, not Hispanic / Latino 30 17.7% Responsible for grandchildren138 82.3% Not responsible for grandchildrenHispanic or Latino 156 28.2% Responsible for grandchildren397 71.8% Not responsible for grandchildrenGrandparents (60 years and over) White / Caucasian 31 6.2% Responsible for grandchildren464 93.8% Not responsible for grandchildrenBlack or African American 252 100.0% Not responsible for grandchildrenOther race 112 48.9% Responsible for grandchildren117 51.1% Not responsible for grandchildrenTwo or more races 443 49.3% Responsible for grandchildren455 50.7% Not responsible for grandchildrenWhite alone, not Hispanic / Latino 38 27.1% Responsible for grandchildren102 72.9% Not responsible for grandchildrenHispanic or Latino 468 34.3% Responsible for grandchildren895 65.7% Not responsible for grandchildren