Races in Hollins, Virginia (VA) Detailed Stats
Data:
Races - White alone (%)
Races - White alone (% change since 2000)
Races - Black alone (%)
Races - Black alone (% change since 2000)
Races - American Indian alone (%)
Races - American Indian alone (% change since 2000)
Races - Asian alone (%)
Races - Asian alone (% change since 2000)
Races - Hispanic (%)
Races - Hispanic (% change since 2000)
Races - Native Hawaiian and Other Pacific Islander alone (%)
Races - Native Hawaiian and Other Pacific Islander alone (% change since 2000)
Races - Two or more races(%)
Races - Two or more races(% change since 2000)
Races - Other race alone (%)
Races - Other race alone (% change since 2000)
Racial diversity
Place of birth - Born in state of residence (%)
Place of birth - Born in state of residence (%) - White
Place of birth - Born in state of residence (%) - Black or African American
Place of birth - Born in state of residence (%) - Asian
Place of birth - Born in state of residence (%) - Hispanic or Latino
Place of birth - Born in state of residence (%) - American Indian and Alaska Native
Place of birth - Born in state of residence (%) - Multirace
Place of birth - Born in state of residence (%) - Other Race
Place of birth - Born in other state (%)
Place of birth - Born in other state (%) - White
Place of birth - Born in other state (%) - Black or African American
Place of birth - Born in other state (%) - Asian
Place of birth - Born in other state (%) - Hispanic or Latino
Place of birth - Born in other state (%) - American Indian and Alaska Native
Place of birth - Born in other state (%) - Multirace
Place of birth - Born in other state (%) - Other Race
Place of birth - Native, outside of US (%)
Place of birth - Native, outside of US (%) - White
Place of birth - Native, outside of US (%) - Black or African American
Place of birth - Native, outside of US (%) - Asian
Place of birth - Native, outside of US (%) - Hispanic or Latino
Place of birth - Native, outside of US (%) - American Indian and Alaska Native
Place of birth - Native, outside of US (%) - Multirace
Place of birth - Native, outside of US (%) - Other Race
Place of birth - Foreign born (%)
Place of birth - Foreign born (%) - White
Place of birth - Foreign born (%) - Black or African American
Place of birth - Foreign born (%) - Asian
Place of birth - Foreign born (%) - Hispanic or Latino
Place of birth - Foreign born (%) - American Indian and Alaska Native
Place of birth - Foreign born (%) - Multirace
Place of birth - Foreign born (%) - Other Race
Residents speaking English at home (%)
Residents speaking English at home - Born in the United States (%)
Residents speaking English at home - Native, born elsewhere (%)
Residents speaking English at home - Foreign born (%)
Residents speaking Spanish at home (%)
Residents speaking Spanish at home - Born in the United States (%)
Residents speaking Spanish at home - Native, born elsewhere (%)
Residents speaking Spanish at home - Foreign born (%)
Residents speaking other language at home (%)
Residents speaking other language at home - Born in the United States (%)
Residents speaking other language at home - Native, born elsewhere (%)
Residents speaking other language at home - Foreign born (%)
Marital status - Never married (%)
Marital status - Now married (%)
Marital status - Separated (%)
Marital status - Widowed (%)
Marital status - Divorced (%)
Ancestries Reported - Arab (%)
Ancestries Reported - Czech (%)
Ancestries Reported - Danish (%)
Ancestries Reported - Dutch (%)
Ancestries Reported - English (%)
Ancestries Reported - French (%)
Ancestries Reported - French Canadian (%)
Ancestries Reported - German (%)
Ancestries Reported - Greek (%)
Ancestries Reported - Hungarian (%)
Ancestries Reported - Irish (%)
Ancestries Reported - Italian (%)
Ancestries Reported - Lithuanian (%)
Ancestries Reported - Norwegian (%)
Ancestries Reported - Polish (%)
Ancestries Reported - Portuguese (%)
Ancestries Reported - Russian (%)
Ancestries Reported - Scotch-Irish (%)
Ancestries Reported - Scottish (%)
Ancestries Reported - Slovak (%)
Ancestries Reported - Subsaharan African (%)
Ancestries Reported - Swedish (%)
Ancestries Reported - Swiss (%)
Ancestries Reported - Ukrainian (%)
Ancestries Reported - United States (%)
Ancestries Reported - Welsh (%)
Ancestries Reported - West Indian (%)
Ancestries Reported - Other (%)
Geographical mobility - Same house 1 year ago (%)
Geographical mobility - Same house 1 year ago (%) - White
Geographical mobility - Same house 1 year ago (%) - Black or African American
Geographical mobility - Same house 1 year ago (%) - Asian
Geographical mobility - Same house 1 year ago (%) - Hispanic or Latino
Geographical mobility - Same house 1 year ago (%) - American Indian and Alaska Native
Geographical mobility - Same house 1 year ago (%) - Multirace
Geographical mobility - Same house 1 year ago (%) - Other Race
Geographical mobility - Moved within same county (%)
Geographical mobility - Moved within same county (%) - White
Geographical mobility - Moved within same county (%) - Black or African American
Geographical mobility - Moved within same county (%) - Asian
Geographical mobility - Moved within same county (%) - Hispanic or Latino
Geographical mobility - Moved within same county (%) - American Indian and Alaska Native
Geographical mobility - Moved within same county (%) - Multirace
Geographical mobility - Moved within same county (%) - Other Race
Geographical mobility - Moved from different county within same state (%)
Geographical mobility - Moved from different county within same state (%) - White
Geographical mobility - Moved from different county within same state (%) - Black or African American
Geographical mobility - Moved from different county within same state (%) - Asian
Geographical mobility - Moved from different county within same state (%) - Hispanic or Latino
Geographical mobility - Moved from different county within same state (%) - American Indian and Alaska Native
Geographical mobility - Moved from different county within same state (%) - Multirace
Geographical mobility - Moved from different county within same state (%) - Other Race
Geographical mobility - Moved from different state (%)
Geographical mobility - Moved from different state (%) - White
Geographical mobility - Moved from different state (%) - Black or African American
Geographical mobility - Moved from different state (%) - Asian
Geographical mobility - Moved from different state (%) - Hispanic or Latino
Geographical mobility - Moved from different state (%) - American Indian and Alaska Native
Geographical mobility - Moved from different state (%) - Multirace
Geographical mobility - Moved from different state (%) - Other Race
Geographical mobility - Moved from abroad (%)
Geographical mobility - Moved from abroad (%) - White
Geographical mobility - Moved from abroad (%) - Black or African American
Geographical mobility - Moved from abroad (%) - Asian
Geographical mobility - Moved from abroad (%) - Hispanic or Latino
Geographical mobility - Moved from abroad (%) - American Indian and Alaska Native
Geographical mobility - Moved from abroad (%) - Multirace
Geographical mobility - Moved from abroad (%) - Other Race
Place of birth for the foreign-born population - Ireland (%)
Place of birth for the foreign-born population - Denmark (%)
Place of birth for the foreign-born population - Norway (%)
Place of birth for the foreign-born population - Sweden (%)
Place of birth for the foreign-born population - United Kingdom (%)
Place of birth for the foreign-born population - England (%)
Place of birth for the foreign-born population - Scotland (%)
Place of birth for the foreign-born population - Other Northern Europe (%)
Place of birth for the foreign-born population - Austria (%)
Place of birth for the foreign-born population - Belgium (%)
Place of birth for the foreign-born population - France (%)
Place of birth for the foreign-born population - Germany (%)
Place of birth for the foreign-born population - Netherlands (%)
Place of birth for the foreign-born population - Switzerland (%)
Place of birth for the foreign-born population - Other Western Europe (%)
Place of birth for the foreign-born population - Greece (%)
Place of birth for the foreign-born population - Italy (%)
Place of birth for the foreign-born population - Portugal (%)
Place of birth for the foreign-born population - Spain (%)
Place of birth for the foreign-born population - Other Southern Europe (%)
Place of birth for the foreign-born population - Albania (%)
Place of birth for the foreign-born population - Belarus (%)
Place of birth for the foreign-born population - Bosnia and Herzegovina (%)
Place of birth for the foreign-born population - Bulgaria (%)
Place of birth for the foreign-born population - Croatia (%)
Place of birth for the foreign-born population - Czechoslovakia (%)
Place of birth for the foreign-born population - Hungary (%)
Place of birth for the foreign-born population - Latvia (%)
Place of birth for the foreign-born population - Lithuania (%)
Place of birth for the foreign-born population - North Macedonia (Macedonia) (%)
Place of birth for the foreign-born population - Moldova (%)
Place of birth for the foreign-born population - Poland (%)
Place of birth for the foreign-born population - Romania (%)
Place of birth for the foreign-born population - Russia (%)
Place of birth for the foreign-born population - Serbia (%)
Place of birth for the foreign-born population - Ukraine (%)
Place of birth for the foreign-born population - Other Eastern Europe (%)
Place of birth for the foreign-born population - China (%)
Place of birth for the foreign-born population - Hong Kong (%)
Place of birth for the foreign-born population - Taiwan (%)
Place of birth for the foreign-born population - Japan (%)
Place of birth for the foreign-born population - Korea (%)
Place of birth for the foreign-born population - Other Eastern Asia (%)
Place of birth for the foreign-born population - Afghanistan (%)
Place of birth for the foreign-born population - Bangladesh (%)
Place of birth for the foreign-born population - India (%)
Place of birth for the foreign-born population - Iran (%)
Place of birth for the foreign-born population - Kazakhstan (%)
Place of birth for the foreign-born population - Nepal (%)
Place of birth for the foreign-born population - Pakistan (%)
Place of birth for the foreign-born population - Sri Lanka (%)
Place of birth for the foreign-born population - Uzbekistan (%)
Place of birth for the foreign-born population - Other South Central Asia (%)
Place of birth for the foreign-born population - Burma (%)
Place of birth for the foreign-born population - Cambodia (%)
Place of birth for the foreign-born population - Indonesia (%)
Place of birth for the foreign-born population - Laos (%)
Place of birth for the foreign-born population - Malaysia (%)
Place of birth for the foreign-born population - Philippines (%)
Place of birth for the foreign-born population - Singapore (%)
Place of birth for the foreign-born population - Thailand (%)
Place of birth for the foreign-born population - Vietnam (%)
Place of birth for the foreign-born population - Other South Eastern Asia (%)
Place of birth for the foreign-born population - Armenia (%)
Place of birth for the foreign-born population - Iraq (%)
Place of birth for the foreign-born population - Israel (%)
Place of birth for the foreign-born population - Jordan (%)
Place of birth for the foreign-born population - Kuwait (%)
Place of birth for the foreign-born population - Lebanon (%)
Place of birth for the foreign-born population - Saudi Arabia (%)
Place of birth for the foreign-born population - Syria (%)
Place of birth for the foreign-born population - Turkey (%)
Place of birth for the foreign-born population - Yemen (%)
Place of birth for the foreign-born population - Other Western Asia (%)
Place of birth for the foreign-born population - Eritrea (%)
Place of birth for the foreign-born population - Ethiopia (%)
Place of birth for the foreign-born population - Kenya (%)
Place of birth for the foreign-born population - Somalia (%)
Place of birth for the foreign-born population - Uganda (%)
Place of birth for the foreign-born population - Zimbabwe (%)
Place of birth for the foreign-born population - Other Eastern Africa (%)
Place of birth for the foreign-born population - Cameroon (%)
Place of birth for the foreign-born population - Congo (%)
Place of birth for the foreign-born population - Democratic Republic of Congo (Zaire) (%)
Place of birth for the foreign-born population - Other Middle Africa (%)
Place of birth for the foreign-born population - Egypt (%)
Place of birth for the foreign-born population - Morocco (%)
Place of birth for the foreign-born population - Sudan (%)
Place of birth for the foreign-born population - Other Northern Africa (%)
Place of birth for the foreign-born population - South Africa (%)
Place of birth for the foreign-born population - Other Southern Africa (%)
Place of birth for the foreign-born population - Cabo Verde (%)
Place of birth for the foreign-born population - Ghana (%)
Place of birth for the foreign-born population - Liberia (%)
Place of birth for the foreign-born population - Nigeria (%)
Place of birth for the foreign-born population - Senegal (%)
Place of birth for the foreign-born population - Sierra Leone (%)
Place of birth for the foreign-born population - Other Western Africa (%)
Place of birth for the foreign-born population - Australia (%)
Place of birth for the foreign-born population - New Zealand (%)
Place of birth for the foreign-born population - Fiji (%)
Place of birth for the foreign-born population - Micronesia (%)
Place of birth for the foreign-born population - Bahamas (%)
Place of birth for the foreign-born population - Barbados (%)
Place of birth for the foreign-born population - Cuba (%)
Place of birth for the foreign-born population - Dominica (%)
Place of birth for the foreign-born population - Dominican Republic (%)
Place of birth for the foreign-born population - Grenada (%)
Place of birth for the foreign-born population - Haiti (%)
Place of birth for the foreign-born population - Jamaica (%)
Place of birth for the foreign-born population - St. Vincent and the Grenadines (%)
Place of birth for the foreign-born population - Trinidad and Tobago (%)
Place of birth for the foreign-born population - West Indies (%)
Place of birth for the foreign-born population - Other Caribbean (%)
Place of birth for the foreign-born population - Belize (%)
Place of birth for the foreign-born population - Costa Rica (%)
Place of birth for the foreign-born population - El Salvador (%)
Place of birth for the foreign-born population - Guatemala (%)
Place of birth for the foreign-born population - Honduras (%)
Place of birth for the foreign-born population - Mexico (%)
Place of birth for the foreign-born population - Nicaragua (%)
Place of birth for the foreign-born population - Panama (%)
Place of birth for the foreign-born population - Other Central America (%)
Place of birth for the foreign-born population - Argentina (%)
Place of birth for the foreign-born population - Bolivia (%)
Place of birth for the foreign-born population - Brazil (%)
Place of birth for the foreign-born population - Chile (%)
Place of birth for the foreign-born population - Colombia (%)
Place of birth for the foreign-born population - Ecuador (%)
Place of birth for the foreign-born population - Guyana (%)
Place of birth for the foreign-born population - Peru (%)
Place of birth for the foreign-born population - Uruguay (%)
Place of birth for the foreign-born population - Venezuela (%)
Place of birth for the foreign-born population - Other South America (%)
Place of birth for the foreign-born population - Canada (%)
Place of birth for the foreign-born population - Other Northern America (%)
Place of birth for the foreign-born population - Other (%)
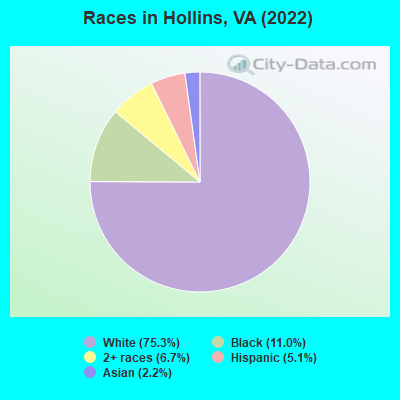
According to 2022 data, the most numerous races in Hollins, VA are White alone (12,367 residents), Black alone (1,812 residents), and Hispanic (843 residents). 91.4% of Hollins residents speak English at home. 7.3% of Hollins, VA residents are foreign-born (2.7% born in Asia, 2.6% born in Latin America, 1.8% born in Europe), which is 64.0% less than the foreign-born rate of 12.0% across the entire state of Virginia.
Race distribution in Hollins
2000 2022
4,965,637 70.2% White alone 1,376,378 19.4% Black alone 329,540 4.7% Hispanic 259,277 3.7% Asian alone 114,022 1.6% Two or more races 18,596 0.3% American Indian alone 11,685 0.2% Other race alone 3,380 0.05% Native Hawaiian and Other
5,095,130 58.7% White alone 1,594,785 18.4% Black alone 905,750 10.4% Hispanic 602,881 6.9% Asian alone 406,047 4.7% Two or more races 60,419 0.7% Other race alone 11,738 0.1% American Indian alone 6,869 0.08% Native Hawaiian and Other
Income and house value in Hollins Median household income in 2022 $67,030 White non-Hispanic householders$87,944 Black householders$165,911 Asian householders$110,692 Some other race householders$71,574 Hispanic or Latino race householdersMedian 2022 house value $237,218 White Non-Hispanic householders$227,071 Black or African American householders $253,679 Asian householders$191,669 Some other race householders$222,336 Two or more races householders$214,218 Hispanic or Latino householders
Median age by race in Hollins
52.1 Median age for White residents48.0 56.0 29.2 Median age for Black or African American residents40.5 26.3 -682,215,742.8 Median age for American Indian / Alaska Native residents-682,352,940.5 -687,861,271.0 37.4 Median age for Asian residents43.2 35.2 18.8 Median age for Native Hawaiian / Pacific Islander residents-666,666,666.0 22.0 23.8 Median age for Other race residents30.5 36.2 16.7 Median age for Two or more races residents20.8 14.7 53.8 Median age for White alone residents50.4 56.3 17.9 Median age for Hispanic or Latino residents17.8 12.4
Owner/renter occupied households by race in Hollins
House owners and renters - White residents 4,437 79.0% Owner occupied1,179 21.0% Renter occupiedHouse owners and renters - Black or African American residents 313 49.3% Owner occupied323 50.7% Renter occupiedHouse owners and renters - Asian residents 76 92.4% Owner occupied6 7.6% Renter occupiedHouse owners and renters - Other race residents 64 100.0% Owner occupiedHouse owners and renters - Two or more races residents 154 91.3% Owner occupied15 8.7% Renter occupiedHouse owners and renters - White alone residents 4,344 78.6% Owner occupied1,184 21.4% Renter occupiedHouse owners and renters - Hispanic or Latino residents 176 92.6% Owner occupied14 7.4% Renter occupied
Language usage in Hollins
English speakers - Total 91.4% of residents of Hollins speak English at home.
3.1% of residents speak Spanish at home 253 52.2% Speak English very well232 47.8% Speak English less than very well5.3% of residents speak other language at home 442 52.4% Speak English very well401 47.6% Speak English less than very well
English speakers - Born in the United States 98.8% of residents of Hollins speak English at home.
0.7% of residents speak Spanish at home 28 100.0% Speak English very well
English speakers - Native, born elsewhere 79.2% of residents of Hollins speak English at home.
25.0% of residents speak Spanish at home 9 50.0% Speak English very well9 50.0% Speak English less than very well
English speakers - Foreign-born 13.3% of residents of Hollins speak English at home.
33.0% of residents speak Spanish at home 201 47.1% Speak English very well226 52.9% Speak English less than very well52.7% of residents speak other language at home 278 40.8% Speak English very well403 59.2% Speak English less than very well
White (Caucasian) - Speak only English Native:
99.9% (11,961)Foreign-born:
20.6% (110)
White (Caucasian) - Speak another language Native:
0.5% (61)Foreign-born:
75.6% (404)
Black or African American - Speak only English Native:
99.8% (1,585)Foreign-born:
15.5% (10)
Asian - Speak only English Native:
90.4% (44)Foreign-born:
9.8% (33)
Asian - Speak another language Native:
2.4% (1)Foreign-born:
89.9% (304)
Other race - Speak only English Native:
13.3% (18)Foreign-born:
9.4% (15)
Other race - Speak another language Native:
81.8% (112)Foreign-born:
90.7% (143)
Two or more races - Speak another language Native:
20.0% (156)Foreign-born:
100.0% (74)
White alone - Speak only English Native:
100.0% (11,747)Foreign-born:
28.3% (112)
White alone - Speak another language Native:
0.2% (19)Foreign-born:
71.5% (284)
Hispanic or Latino - Speak only English Native:
59.9% (209)Foreign-born:
1.1% (4)
Hispanic or Latino - Speak another language Native:
38.2% (133)Foreign-born:
100.0% (393)
Foreign-born residents in Hollins 1,202 residents are foreign born (2.7% Asia , 2.6% Latin America , 1.8% Europe ).
This city:
7.3%Virginia:
12.6%
Marital status for residents in Hollins Marital status - White (Caucasian) population 15 years and over
Males 31.6% Never married48.7% Now married0.7% Separated4.8% Widowed14.2% DivorcedFemales 25.6% Never married39.8% Now married2.1% Separated16.4% Widowed16.1% DivorcedWomen who gave birth in the past 12 months Now married:
76.1% (33)Unmarried:
23.9% (10)
Women who did not give birth in the past 12 months Now married:
36.4% (902)Unmarried:
63.6% (1,576)
Marital status - Black or African American population 15 years and over
Males 59.8% Never married30.4% Now married6.6% Separated0.0% Widowed3.3% DivorcedFemales 63.1% Never married22.9% Now married0.5% Separated3.9% Widowed9.6% DivorcedWomen who gave birth in the past 12 months Now married:
100.0% (7)Unmarried:
0.0% (0)
Women who did not give birth in the past 12 months Now married:
20.2% (121)Unmarried:
79.8% (479)
Marital status - Asian population 15 years and over
Males 51.2% Never married18.2% Now married0.0% Separated0.0% Widowed30.6% DivorcedFemales 28.1% Never married43.8% Now married0.0% Separated5.8% Widowed22.3% DivorcedWomen who gave birth in the past 12 months Now married:
100.0% (19)Unmarried:
0.0% (0)
Women who did not give birth in the past 12 months Now married:
41.9% (32)Unmarried:
58.1% (45)
Marital status - Other race population 15 years and over
Males 32.5% Never married67.5% Now married0.0% Separated0.0% Widowed0.0% DivorcedFemales 25.9% Never married74.1% Now married0.0% Separated0.0% Widowed0.0% DivorcedWomen who gave birth in the past 12 months Now married:
100.0% (16)Unmarried:
0.0% (0)
Women who did not give birth in the past 12 months Now married:
69.6% (63)Unmarried:
30.4% (28)
Marital status - Two or more races population 15 years and over
Males 47.1% Never married48.1% Now married0.0% Separated0.0% Widowed4.8% DivorcedFemales 74.2% Never married17.4% Now married0.0% Separated0.0% Widowed8.4% DivorcedWomen who did not give birth in the past 12 months Now married:
11.4% (41)Unmarried:
88.6% (319)
Marital status - White alone, not Hispanic / Latino population 15 years and over
Males 31.5% Never married48.3% Now married0.7% Separated4.9% Widowed14.6% DivorcedFemales 25.4% Never married39.4% Now married2.1% Separated16.7% Widowed16.4% DivorcedWomen who gave birth in the past 12 months Now married:
76.1% (33)Unmarried:
23.9% (10)
Women who did not give birth in the past 12 months Now married:
35.0% (837)Unmarried:
65.0% (1,552)
Marital status - Hispanic or Latino population 15 years and over
Males 32.6% Never married67.4% Now married0.0% Separated0.0% Widowed0.0% DivorcedFemales 39.5% Never married60.5% Now married0.0% Separated0.0% Widowed0.0% DivorcedWomen who gave birth in the past 12 months Now married:
100.0% (13)Unmarried:
0.0% (0)
Women who did not give birth in the past 12 months Now married:
58.4% (137)Unmarried:
41.6% (98)
Ancestries in Hollins
1,980 21.9% American1,353 15.0% English653 7.2% German366 4.1% Irish261 2.9% Italian201 2.2% African198 2.2% Scotch-Irish191 2.1% Greek124 1.4% Scottish120 1.3% European94 1.0% French50 0.6% British47 0.5% Danish46 0.5% Lebanese38 0.4% Haitian37 0.4% Dutch32 0.4% Polish25 0.3% Welsh20 0.2% Israeli18 0.2% Russian18 0.2% Kenyan17 0.2% French Canadian14 0.2% Swedish13 0.1% Jordanian13 0.1% Palestinian13 0.1% Ghanaian8 0.09% Ukrainian7 0.08% Swiss
Children Nativity (place of birth) in Hollins
Children under 6 years - Living with two parents Both parents native 228 100.0% NativeBoth parents foreign-born 70 100.0% NativeOne native, one foreign-born parent 35 100.0% NativeChildren under 6 years - Living with one parent Native parent 261 100.0% NativeChildren 6 to 17 years - Living with two parents Both parents native 931 100.0% NativeBoth parents foreign-born 232 74.1% Native81 25.9% Foreign-bornOne native, one foreign-born parent 107 100.0% NativeChildren 6 to 17 years - Living with one parent Native parent 610 100.0% Native
Grandparents responsible for own grandchildren in Hollins
Grandparents (30 to 59 years) White / Caucasian 30 83.1% Responsible for grandchildren6 16.9% Not responsible for grandchildrenWhite alone, not Hispanic / Latino 31 81.8% Responsible for grandchildren7 18.2% Not responsible for grandchildrenGrandparents (60 years and over) White / Caucasian 64 60.0% Responsible for grandchildren43 40.0% Not responsible for grandchildrenWhite alone, not Hispanic / Latino 65 59.0% Responsible for grandchildren45 41.0% Not responsible for grandchildren