Races in Hillandale, Maryland (MD) Detailed Stats
Data:
Races - White alone (%)
Races - White alone (% change since 2000)
Races - Black alone (%)
Races - Black alone (% change since 2000)
Races - American Indian alone (%)
Races - American Indian alone (% change since 2000)
Races - Asian alone (%)
Races - Asian alone (% change since 2000)
Races - Hispanic (%)
Races - Hispanic (% change since 2000)
Races - Native Hawaiian and Other Pacific Islander alone (%)
Races - Native Hawaiian and Other Pacific Islander alone (% change since 2000)
Races - Two or more races(%)
Races - Two or more races(% change since 2000)
Races - Other race alone (%)
Races - Other race alone (% change since 2000)
Racial diversity
Place of birth - Born in state of residence (%)
Place of birth - Born in state of residence (%) - White
Place of birth - Born in state of residence (%) - Black or African American
Place of birth - Born in state of residence (%) - Asian
Place of birth - Born in state of residence (%) - Hispanic or Latino
Place of birth - Born in state of residence (%) - American Indian and Alaska Native
Place of birth - Born in state of residence (%) - Multirace
Place of birth - Born in state of residence (%) - Other Race
Place of birth - Born in other state (%)
Place of birth - Born in other state (%) - White
Place of birth - Born in other state (%) - Black or African American
Place of birth - Born in other state (%) - Asian
Place of birth - Born in other state (%) - Hispanic or Latino
Place of birth - Born in other state (%) - American Indian and Alaska Native
Place of birth - Born in other state (%) - Multirace
Place of birth - Born in other state (%) - Other Race
Place of birth - Native, outside of US (%)
Place of birth - Native, outside of US (%) - White
Place of birth - Native, outside of US (%) - Black or African American
Place of birth - Native, outside of US (%) - Asian
Place of birth - Native, outside of US (%) - Hispanic or Latino
Place of birth - Native, outside of US (%) - American Indian and Alaska Native
Place of birth - Native, outside of US (%) - Multirace
Place of birth - Native, outside of US (%) - Other Race
Place of birth - Foreign born (%)
Place of birth - Foreign born (%) - White
Place of birth - Foreign born (%) - Black or African American
Place of birth - Foreign born (%) - Asian
Place of birth - Foreign born (%) - Hispanic or Latino
Place of birth - Foreign born (%) - American Indian and Alaska Native
Place of birth - Foreign born (%) - Multirace
Place of birth - Foreign born (%) - Other Race
Residents speaking English at home (%)
Residents speaking English at home - Born in the United States (%)
Residents speaking English at home - Native, born elsewhere (%)
Residents speaking English at home - Foreign born (%)
Residents speaking Spanish at home (%)
Residents speaking Spanish at home - Born in the United States (%)
Residents speaking Spanish at home - Native, born elsewhere (%)
Residents speaking Spanish at home - Foreign born (%)
Residents speaking other language at home (%)
Residents speaking other language at home - Born in the United States (%)
Residents speaking other language at home - Native, born elsewhere (%)
Residents speaking other language at home - Foreign born (%)
Marital status - Never married (%)
Marital status - Now married (%)
Marital status - Separated (%)
Marital status - Widowed (%)
Marital status - Divorced (%)
Ancestries Reported - Arab (%)
Ancestries Reported - Czech (%)
Ancestries Reported - Danish (%)
Ancestries Reported - Dutch (%)
Ancestries Reported - English (%)
Ancestries Reported - French (%)
Ancestries Reported - French Canadian (%)
Ancestries Reported - German (%)
Ancestries Reported - Greek (%)
Ancestries Reported - Hungarian (%)
Ancestries Reported - Irish (%)
Ancestries Reported - Italian (%)
Ancestries Reported - Lithuanian (%)
Ancestries Reported - Norwegian (%)
Ancestries Reported - Polish (%)
Ancestries Reported - Portuguese (%)
Ancestries Reported - Russian (%)
Ancestries Reported - Scotch-Irish (%)
Ancestries Reported - Scottish (%)
Ancestries Reported - Slovak (%)
Ancestries Reported - Subsaharan African (%)
Ancestries Reported - Swedish (%)
Ancestries Reported - Swiss (%)
Ancestries Reported - Ukrainian (%)
Ancestries Reported - United States (%)
Ancestries Reported - Welsh (%)
Ancestries Reported - West Indian (%)
Ancestries Reported - Other (%)
Geographical mobility - Same house 1 year ago (%)
Geographical mobility - Same house 1 year ago (%) - White
Geographical mobility - Same house 1 year ago (%) - Black or African American
Geographical mobility - Same house 1 year ago (%) - Asian
Geographical mobility - Same house 1 year ago (%) - Hispanic or Latino
Geographical mobility - Same house 1 year ago (%) - American Indian and Alaska Native
Geographical mobility - Same house 1 year ago (%) - Multirace
Geographical mobility - Same house 1 year ago (%) - Other Race
Geographical mobility - Moved within same county (%)
Geographical mobility - Moved within same county (%) - White
Geographical mobility - Moved within same county (%) - Black or African American
Geographical mobility - Moved within same county (%) - Asian
Geographical mobility - Moved within same county (%) - Hispanic or Latino
Geographical mobility - Moved within same county (%) - American Indian and Alaska Native
Geographical mobility - Moved within same county (%) - Multirace
Geographical mobility - Moved within same county (%) - Other Race
Geographical mobility - Moved from different county within same state (%)
Geographical mobility - Moved from different county within same state (%) - White
Geographical mobility - Moved from different county within same state (%) - Black or African American
Geographical mobility - Moved from different county within same state (%) - Asian
Geographical mobility - Moved from different county within same state (%) - Hispanic or Latino
Geographical mobility - Moved from different county within same state (%) - American Indian and Alaska Native
Geographical mobility - Moved from different county within same state (%) - Multirace
Geographical mobility - Moved from different county within same state (%) - Other Race
Geographical mobility - Moved from different state (%)
Geographical mobility - Moved from different state (%) - White
Geographical mobility - Moved from different state (%) - Black or African American
Geographical mobility - Moved from different state (%) - Asian
Geographical mobility - Moved from different state (%) - Hispanic or Latino
Geographical mobility - Moved from different state (%) - American Indian and Alaska Native
Geographical mobility - Moved from different state (%) - Multirace
Geographical mobility - Moved from different state (%) - Other Race
Geographical mobility - Moved from abroad (%)
Geographical mobility - Moved from abroad (%) - White
Geographical mobility - Moved from abroad (%) - Black or African American
Geographical mobility - Moved from abroad (%) - Asian
Geographical mobility - Moved from abroad (%) - Hispanic or Latino
Geographical mobility - Moved from abroad (%) - American Indian and Alaska Native
Geographical mobility - Moved from abroad (%) - Multirace
Geographical mobility - Moved from abroad (%) - Other Race
Place of birth for the foreign-born population - Ireland (%)
Place of birth for the foreign-born population - Denmark (%)
Place of birth for the foreign-born population - Norway (%)
Place of birth for the foreign-born population - Sweden (%)
Place of birth for the foreign-born population - United Kingdom (%)
Place of birth for the foreign-born population - England (%)
Place of birth for the foreign-born population - Scotland (%)
Place of birth for the foreign-born population - Other Northern Europe (%)
Place of birth for the foreign-born population - Austria (%)
Place of birth for the foreign-born population - Belgium (%)
Place of birth for the foreign-born population - France (%)
Place of birth for the foreign-born population - Germany (%)
Place of birth for the foreign-born population - Netherlands (%)
Place of birth for the foreign-born population - Switzerland (%)
Place of birth for the foreign-born population - Other Western Europe (%)
Place of birth for the foreign-born population - Greece (%)
Place of birth for the foreign-born population - Italy (%)
Place of birth for the foreign-born population - Portugal (%)
Place of birth for the foreign-born population - Spain (%)
Place of birth for the foreign-born population - Other Southern Europe (%)
Place of birth for the foreign-born population - Albania (%)
Place of birth for the foreign-born population - Belarus (%)
Place of birth for the foreign-born population - Bosnia and Herzegovina (%)
Place of birth for the foreign-born population - Bulgaria (%)
Place of birth for the foreign-born population - Croatia (%)
Place of birth for the foreign-born population - Czechoslovakia (%)
Place of birth for the foreign-born population - Hungary (%)
Place of birth for the foreign-born population - Latvia (%)
Place of birth for the foreign-born population - Lithuania (%)
Place of birth for the foreign-born population - North Macedonia (Macedonia) (%)
Place of birth for the foreign-born population - Moldova (%)
Place of birth for the foreign-born population - Poland (%)
Place of birth for the foreign-born population - Romania (%)
Place of birth for the foreign-born population - Russia (%)
Place of birth for the foreign-born population - Serbia (%)
Place of birth for the foreign-born population - Ukraine (%)
Place of birth for the foreign-born population - Other Eastern Europe (%)
Place of birth for the foreign-born population - China (%)
Place of birth for the foreign-born population - Hong Kong (%)
Place of birth for the foreign-born population - Taiwan (%)
Place of birth for the foreign-born population - Japan (%)
Place of birth for the foreign-born population - Korea (%)
Place of birth for the foreign-born population - Other Eastern Asia (%)
Place of birth for the foreign-born population - Afghanistan (%)
Place of birth for the foreign-born population - Bangladesh (%)
Place of birth for the foreign-born population - India (%)
Place of birth for the foreign-born population - Iran (%)
Place of birth for the foreign-born population - Kazakhstan (%)
Place of birth for the foreign-born population - Nepal (%)
Place of birth for the foreign-born population - Pakistan (%)
Place of birth for the foreign-born population - Sri Lanka (%)
Place of birth for the foreign-born population - Uzbekistan (%)
Place of birth for the foreign-born population - Other South Central Asia (%)
Place of birth for the foreign-born population - Burma (%)
Place of birth for the foreign-born population - Cambodia (%)
Place of birth for the foreign-born population - Indonesia (%)
Place of birth for the foreign-born population - Laos (%)
Place of birth for the foreign-born population - Malaysia (%)
Place of birth for the foreign-born population - Philippines (%)
Place of birth for the foreign-born population - Singapore (%)
Place of birth for the foreign-born population - Thailand (%)
Place of birth for the foreign-born population - Vietnam (%)
Place of birth for the foreign-born population - Other South Eastern Asia (%)
Place of birth for the foreign-born population - Armenia (%)
Place of birth for the foreign-born population - Iraq (%)
Place of birth for the foreign-born population - Israel (%)
Place of birth for the foreign-born population - Jordan (%)
Place of birth for the foreign-born population - Kuwait (%)
Place of birth for the foreign-born population - Lebanon (%)
Place of birth for the foreign-born population - Saudi Arabia (%)
Place of birth for the foreign-born population - Syria (%)
Place of birth for the foreign-born population - Turkey (%)
Place of birth for the foreign-born population - Yemen (%)
Place of birth for the foreign-born population - Other Western Asia (%)
Place of birth for the foreign-born population - Eritrea (%)
Place of birth for the foreign-born population - Ethiopia (%)
Place of birth for the foreign-born population - Kenya (%)
Place of birth for the foreign-born population - Somalia (%)
Place of birth for the foreign-born population - Uganda (%)
Place of birth for the foreign-born population - Zimbabwe (%)
Place of birth for the foreign-born population - Other Eastern Africa (%)
Place of birth for the foreign-born population - Cameroon (%)
Place of birth for the foreign-born population - Congo (%)
Place of birth for the foreign-born population - Democratic Republic of Congo (Zaire) (%)
Place of birth for the foreign-born population - Other Middle Africa (%)
Place of birth for the foreign-born population - Egypt (%)
Place of birth for the foreign-born population - Morocco (%)
Place of birth for the foreign-born population - Sudan (%)
Place of birth for the foreign-born population - Other Northern Africa (%)
Place of birth for the foreign-born population - South Africa (%)
Place of birth for the foreign-born population - Other Southern Africa (%)
Place of birth for the foreign-born population - Cabo Verde (%)
Place of birth for the foreign-born population - Ghana (%)
Place of birth for the foreign-born population - Liberia (%)
Place of birth for the foreign-born population - Nigeria (%)
Place of birth for the foreign-born population - Senegal (%)
Place of birth for the foreign-born population - Sierra Leone (%)
Place of birth for the foreign-born population - Other Western Africa (%)
Place of birth for the foreign-born population - Australia (%)
Place of birth for the foreign-born population - New Zealand (%)
Place of birth for the foreign-born population - Fiji (%)
Place of birth for the foreign-born population - Micronesia (%)
Place of birth for the foreign-born population - Bahamas (%)
Place of birth for the foreign-born population - Barbados (%)
Place of birth for the foreign-born population - Cuba (%)
Place of birth for the foreign-born population - Dominica (%)
Place of birth for the foreign-born population - Dominican Republic (%)
Place of birth for the foreign-born population - Grenada (%)
Place of birth for the foreign-born population - Haiti (%)
Place of birth for the foreign-born population - Jamaica (%)
Place of birth for the foreign-born population - St. Vincent and the Grenadines (%)
Place of birth for the foreign-born population - Trinidad and Tobago (%)
Place of birth for the foreign-born population - West Indies (%)
Place of birth for the foreign-born population - Other Caribbean (%)
Place of birth for the foreign-born population - Belize (%)
Place of birth for the foreign-born population - Costa Rica (%)
Place of birth for the foreign-born population - El Salvador (%)
Place of birth for the foreign-born population - Guatemala (%)
Place of birth for the foreign-born population - Honduras (%)
Place of birth for the foreign-born population - Mexico (%)
Place of birth for the foreign-born population - Nicaragua (%)
Place of birth for the foreign-born population - Panama (%)
Place of birth for the foreign-born population - Other Central America (%)
Place of birth for the foreign-born population - Argentina (%)
Place of birth for the foreign-born population - Bolivia (%)
Place of birth for the foreign-born population - Brazil (%)
Place of birth for the foreign-born population - Chile (%)
Place of birth for the foreign-born population - Colombia (%)
Place of birth for the foreign-born population - Ecuador (%)
Place of birth for the foreign-born population - Guyana (%)
Place of birth for the foreign-born population - Peru (%)
Place of birth for the foreign-born population - Uruguay (%)
Place of birth for the foreign-born population - Venezuela (%)
Place of birth for the foreign-born population - Other South America (%)
Place of birth for the foreign-born population - Canada (%)
Place of birth for the foreign-born population - Other Northern America (%)
Place of birth for the foreign-born population - Other (%)
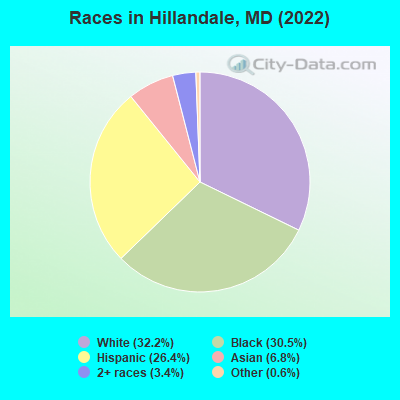
According to 2022 data, the most numerous races in Hillandale, MD are White alone (1,604 residents), Black alone (1,517 residents), and Hispanic (1,313 residents). 59.0% of Hillandale residents speak English at home. 35.7% of Hillandale, MD residents are foreign-born (20.0% born in Latin America, 6.5% born in Africa, 5.0% born in Asia), which is 55.2% greater than the foreign-born rate of 16.0% across the entire state of Maryland.
Race distribution in Hillandale
2000 2022
3,286,547 62.1% White alone 1,464,735 27.7% Black alone 227,916 4.3% Hispanic 209,738 4.0% Asian alone 82,946 1.6% Two or more races 13,312 0.3% American Indian alone 9,379 0.2% Other race alone 1,913 0.04% Native Hawaiian and Other
2,906,492 47.1% White alone 1,800,914 29.2% Black alone 705,842 11.4% Hispanic 401,818 6.5% Asian alone 291,317 4.7% Two or more races 46,930 0.8% Other race alone 8,930 0.1% American Indian alone 2,417 0.04% Native Hawaiian and Other
Income and house value in Hillandale Median household income in 2022 $142,476 White non-Hispanic householders$121,688 Black householders$193,240 Asian householders$137,213 Some other race householdersover $200,000 Two or more races householders$132,591 Hispanic or Latino race householdersMedian 2022 house value $522,795 White Non-Hispanic householders$472,888 Black or African American householders$613,610 American Indian or Alaska Native householders $511,341 Asian householders$578,157 Some other race householders$704,424 Two or more races householders$555,249 Hispanic or Latino householders
Median age by race in Hillandale
46.1 Median age for White residents49.0 44.1 51.0 Median age for Black or African American residents55.5 50.5 33.5 Median age for American Indian / Alaska Native residents32.1 11.0 54.4 Median age for Asian residents54.8 51.0 -763,333,332.6 Median age for Native Hawaiian / Pacific Islander residents-720,061,021.4 -760,942,760.2 29.6 Median age for Other race residents30.1 29.0 36.6 Median age for Two or more races residents34.5 44.0 49.6 Median age for White alone residents52.1 49.0 33.6 Median age for Hispanic or Latino residents34.2 31.2
Owner/renter occupied households by race in Hillandale
House owners and renters - White residents 576 89.0% Owner occupied71 11.0% Renter occupiedHouse owners and renters - Black or African American residents 476 94.4% Owner occupied28 5.6% Renter occupiedHouse owners and renters - American Indian / Alaska Native residents 57 100.0% Owner occupiedHouse owners and renters - Asian residents 83 100.0% Owner occupiedHouse owners and renters - Native Hawaiian / Pacific Islander residents 4 100.0% Owner occupiedHouse owners and renters - Other race residents 109 54.7% Owner occupied91 45.3% Renter occupiedHouse owners and renters - Two or more races residents 93 84.3% Owner occupied17 15.7% Renter occupiedHouse owners and renters - White alone residents 557 88.1% Owner occupied75 11.9% Renter occupiedHouse owners and renters - Hispanic or Latino residents 215 73.4% Owner occupied78 26.6% Renter occupied
Language usage in Hillandale
English speakers - Total 59.0% of residents of Hillandale speak English at home.
23.5% of residents speak Spanish at home 521 48.2% Speak English very well560 51.8% Speak English less than very well17.4% of residents speak other language at home 671 83.8% Speak English very well130 16.2% Speak English less than very well
English speakers - Born in the United States 90.9% of residents of Hillandale speak English at home.
7.8% of residents speak Spanish at home 101 85.6% Speak English very well17 14.4% Speak English less than very well0.8% of residents speak other language at home 12 100.0% Speak English very well
English speakers - Native, born elsewhere 88.0% of residents of Hillandale speak English at home.
3.9% of residents speak Spanish at home 13 100.0% Speak English very well2.4% of residents speak other language at home 8 100.0% Speak English very well
English speakers - Foreign-born 18.9% of residents of Hillandale speak English at home.
44.9% of residents speak Spanish at home 250 31.4% Speak English very well547 68.6% Speak English less than very well36.7% of residents speak other language at home 543 83.2% Speak English very well110 16.8% Speak English less than very well
White (Caucasian) - Speak only English Native:
94.8% (1,265)Foreign-born:
36.6% (70)
White (Caucasian) - Speak another language Native:
5.8% (78)Foreign-born:
66.8% (127)
Black or African American - Speak only English Native:
91.0% (894)Foreign-born:
29.9% (159)
Black or African American - Speak another language Native:
8.6% (84)Foreign-born:
68.1% (363)
American Indian / Alaska Native - Speak another language Native:
100.0% (63)Foreign-born:
100.0% (101)
Asian - Speak only English Native:
66.2% (61)Foreign-born:
18.3% (46)
Asian - Speak another language Native:
30.0% (28)Foreign-born:
82.0% (205)
Other race - Speak only English Native:
8.5% (18)Foreign-born:
4.4% (29)
Other race - Speak another language Native:
87.4% (184)Foreign-born:
95.6% (634)
Two or more races - Speak only English Native:
92.4% (133)Foreign-born:
12.7% (18)
Two or more races - Speak another language Native:
1.0% (1)Foreign-born:
87.3% (124)
White alone - Speak only English Native:
96.5% (1,270)Foreign-born:
46.6% (70)
White alone - Speak another language Native:
3.7% (49)Foreign-born:
51.1% (77)
Hispanic or Latino - Speak only English Native:
4.2% (13)Foreign-born:
3.2% (26)
Hispanic or Latino - Speak another language Native:
93.2% (282)Foreign-born:
96.9% (790)
Foreign-born residents in Hillandale 1,780 residents are foreign born (20.0% Latin America , 6.5% Africa , 5.0% Asia ).
This city:
35.7%Maryland:
15.7%
Marital status for residents in Hillandale Marital status - White (Caucasian) population 15 years and over
Males 20.9% Never married70.9% Now married1.0% Separated0.0% Widowed7.2% DivorcedFemales 21.2% Never married61.3% Now married0.0% Separated12.9% Widowed4.6% DivorcedWomen who gave birth in the past 12 months Now married:
100.0% (26)Unmarried:
0.0% (0)
Women who did not give birth in the past 12 months Now married:
63.0% (198)Unmarried:
37.0% (116)
Marital status - Black or African American population 15 years and over
Males 40.5% Never married43.1% Now married0.1% Separated0.0% Widowed16.3% DivorcedFemales 43.8% Never married38.4% Now married6.1% Separated2.0% Widowed9.7% DivorcedWomen who gave birth in the past 12 months Now married:
100.0% (14)Unmarried:
0.0% (0)
Women who did not give birth in the past 12 months Now married:
30.2% (123)Unmarried:
69.8% (283)
Marital status - American Indian / Alaska Native population 15 years and over
Males 0.0% Never married100.0% Now married0.0% Separated0.0% Widowed0.0% DivorcedFemales 0.0% Never married100.0% Now married0.0% Separated0.0% Widowed0.0% DivorcedWomen who did not give birth in the past 12 months Now married:
100.0% (57)Unmarried:
0.0% (0)
Marital status - Asian population 15 years and over
Males 33.9% Never married66.1% Now married0.0% Separated0.0% Widowed0.0% DivorcedFemales 22.8% Never married65.4% Now married5.1% Separated0.0% Widowed6.6% DivorcedWomen who did not give birth in the past 12 months Now married:
57.5% (42)Unmarried:
42.5% (31)
Marital status - Other race population 15 years and over
Males 59.9% Never married36.9% Now married3.1% Separated0.0% Widowed0.0% DivorcedFemales 16.2% Never married56.4% Now married0.0% Separated11.2% Widowed16.2% DivorcedWomen who gave birth in the past 12 months Now married:
100.0% (13)Unmarried:
0.0% (0)
Women who did not give birth in the past 12 months Now married:
60.1% (146)Unmarried:
39.9% (97)
Marital status - Two or more races population 15 years and over
Males 26.2% Never married68.3% Now married0.0% Separated0.0% Widowed5.6% DivorcedFemales 0.0% Never married100.0% Now married0.0% Separated0.0% Widowed0.0% DivorcedWomen who gave birth in the past 12 months Now married:
100.0% (14)Unmarried:
0.0% (0)
Women who did not give birth in the past 12 months Now married:
100.0% (51)Unmarried:
0.0% (0)
Marital status - White alone, not Hispanic / Latino population 15 years and over
Males 22.3% Never married71.0% Now married0.0% Separated0.0% Widowed6.7% DivorcedFemales 21.2% Never married59.8% Now married0.0% Separated14.1% Widowed5.0% DivorcedWomen who gave birth in the past 12 months Now married:
100.0% (28)Unmarried:
0.0% (0)
Women who did not give birth in the past 12 months Now married:
60.4% (173)Unmarried:
39.6% (114)
Marital status - Hispanic or Latino population 15 years and over
Males 43.2% Never married51.8% Now married3.4% Separated0.0% Widowed1.5% DivorcedFemales 14.4% Never married66.4% Now married0.0% Separated7.9% Widowed11.4% DivorcedWomen who gave birth in the past 12 months Now married:
100.0% (11)Unmarried:
0.0% (0)
Women who did not give birth in the past 12 months Now married:
71.4% (231)Unmarried:
28.6% (93)
Ancestries in Hillandale
116 4.3% Haitian96 3.6% English71 2.6% German60 2.2% Irish58 2.2% Ethiopian54 2.0% American52 1.9% Nigerian45 1.7% Greek41 1.5% European41 1.5% Jamaican37 1.4% Italian31 1.2% Yugoslavian30 1.1% Ukrainian29 1.1% French23 0.9% Ghanaian19 0.7% Polish18 0.7% Guyanese15 0.6% Scottish11 0.4% British10 0.4% Northern European9 0.3% Iranian7 0.3% Hungarian7 0.3% Trinidadian and Tobagonian4 0.1% Egyptian3 0.1% French Canadian1 0.04% Czech
Children Nativity (place of birth) in Hillandale
Children under 6 years - Living with two parents Both parents native 190 100.0% NativeBoth parents foreign-born 101 100.0% NativeOne native, one foreign-born parent 98 100.0% NativeChildren under 6 years - Living with one parent Native parent 20 100.0% NativeForeign-born parent 30 100.0% NativeChildren 6 to 17 years - Living with two parents Both parents native 184 100.0% Native0 0.0% Foreign-bornBoth parents foreign-born 155 82.8% Native32 17.2% Foreign-bornOne native, one foreign-born parent 13 100.0% NativeChildren 6 to 17 years - Living with one parent Foreign-born parent 113 57.9% Native83 42.1% Foreign-born
Grandparents responsible for own grandchildren in Hillandale
Grandparents (30 to 59 years) Other race 27 44.6% Responsible for grandchildren34 55.4% Not responsible for grandchildrenHispanic or Latino 47 61.3% Responsible for grandchildren30 38.7% Not responsible for grandchildren
Grandparents (60 years and over)