Races in Hays, Kansas (KS) Detailed Stats
Data:
Races - White alone (%)
Races - White alone (% change since 2000)
Races - Black alone (%)
Races - Black alone (% change since 2000)
Races - American Indian alone (%)
Races - American Indian alone (% change since 2000)
Races - Asian alone (%)
Races - Asian alone (% change since 2000)
Races - Hispanic (%)
Races - Hispanic (% change since 2000)
Races - Native Hawaiian and Other Pacific Islander alone (%)
Races - Native Hawaiian and Other Pacific Islander alone (% change since 2000)
Races - Two or more races(%)
Races - Two or more races(% change since 2000)
Races - Other race alone (%)
Races - Other race alone (% change since 2000)
Racial diversity
Place of birth - Born in state of residence (%)
Place of birth - Born in state of residence (%) - White
Place of birth - Born in state of residence (%) - Black or African American
Place of birth - Born in state of residence (%) - Asian
Place of birth - Born in state of residence (%) - Hispanic or Latino
Place of birth - Born in state of residence (%) - American Indian and Alaska Native
Place of birth - Born in state of residence (%) - Multirace
Place of birth - Born in state of residence (%) - Other Race
Place of birth - Born in other state (%)
Place of birth - Born in other state (%) - White
Place of birth - Born in other state (%) - Black or African American
Place of birth - Born in other state (%) - Asian
Place of birth - Born in other state (%) - Hispanic or Latino
Place of birth - Born in other state (%) - American Indian and Alaska Native
Place of birth - Born in other state (%) - Multirace
Place of birth - Born in other state (%) - Other Race
Place of birth - Native, outside of US (%)
Place of birth - Native, outside of US (%) - White
Place of birth - Native, outside of US (%) - Black or African American
Place of birth - Native, outside of US (%) - Asian
Place of birth - Native, outside of US (%) - Hispanic or Latino
Place of birth - Native, outside of US (%) - American Indian and Alaska Native
Place of birth - Native, outside of US (%) - Multirace
Place of birth - Native, outside of US (%) - Other Race
Place of birth - Foreign born (%)
Place of birth - Foreign born (%) - White
Place of birth - Foreign born (%) - Black or African American
Place of birth - Foreign born (%) - Asian
Place of birth - Foreign born (%) - Hispanic or Latino
Place of birth - Foreign born (%) - American Indian and Alaska Native
Place of birth - Foreign born (%) - Multirace
Place of birth - Foreign born (%) - Other Race
Residents speaking English at home (%)
Residents speaking English at home - Born in the United States (%)
Residents speaking English at home - Native, born elsewhere (%)
Residents speaking English at home - Foreign born (%)
Residents speaking Spanish at home (%)
Residents speaking Spanish at home - Born in the United States (%)
Residents speaking Spanish at home - Native, born elsewhere (%)
Residents speaking Spanish at home - Foreign born (%)
Residents speaking other language at home (%)
Residents speaking other language at home - Born in the United States (%)
Residents speaking other language at home - Native, born elsewhere (%)
Residents speaking other language at home - Foreign born (%)
Marital status - Never married (%)
Marital status - Now married (%)
Marital status - Separated (%)
Marital status - Widowed (%)
Marital status - Divorced (%)
Ancestries Reported - Arab (%)
Ancestries Reported - Czech (%)
Ancestries Reported - Danish (%)
Ancestries Reported - Dutch (%)
Ancestries Reported - English (%)
Ancestries Reported - French (%)
Ancestries Reported - French Canadian (%)
Ancestries Reported - German (%)
Ancestries Reported - Greek (%)
Ancestries Reported - Hungarian (%)
Ancestries Reported - Irish (%)
Ancestries Reported - Italian (%)
Ancestries Reported - Lithuanian (%)
Ancestries Reported - Norwegian (%)
Ancestries Reported - Polish (%)
Ancestries Reported - Portuguese (%)
Ancestries Reported - Russian (%)
Ancestries Reported - Scotch-Irish (%)
Ancestries Reported - Scottish (%)
Ancestries Reported - Slovak (%)
Ancestries Reported - Subsaharan African (%)
Ancestries Reported - Swedish (%)
Ancestries Reported - Swiss (%)
Ancestries Reported - Ukrainian (%)
Ancestries Reported - United States (%)
Ancestries Reported - Welsh (%)
Ancestries Reported - West Indian (%)
Ancestries Reported - Other (%)
Geographical mobility - Same house 1 year ago (%)
Geographical mobility - Same house 1 year ago (%) - White
Geographical mobility - Same house 1 year ago (%) - Black or African American
Geographical mobility - Same house 1 year ago (%) - Asian
Geographical mobility - Same house 1 year ago (%) - Hispanic or Latino
Geographical mobility - Same house 1 year ago (%) - American Indian and Alaska Native
Geographical mobility - Same house 1 year ago (%) - Multirace
Geographical mobility - Same house 1 year ago (%) - Other Race
Geographical mobility - Moved within same county (%)
Geographical mobility - Moved within same county (%) - White
Geographical mobility - Moved within same county (%) - Black or African American
Geographical mobility - Moved within same county (%) - Asian
Geographical mobility - Moved within same county (%) - Hispanic or Latino
Geographical mobility - Moved within same county (%) - American Indian and Alaska Native
Geographical mobility - Moved within same county (%) - Multirace
Geographical mobility - Moved within same county (%) - Other Race
Geographical mobility - Moved from different county within same state (%)
Geographical mobility - Moved from different county within same state (%) - White
Geographical mobility - Moved from different county within same state (%) - Black or African American
Geographical mobility - Moved from different county within same state (%) - Asian
Geographical mobility - Moved from different county within same state (%) - Hispanic or Latino
Geographical mobility - Moved from different county within same state (%) - American Indian and Alaska Native
Geographical mobility - Moved from different county within same state (%) - Multirace
Geographical mobility - Moved from different county within same state (%) - Other Race
Geographical mobility - Moved from different state (%)
Geographical mobility - Moved from different state (%) - White
Geographical mobility - Moved from different state (%) - Black or African American
Geographical mobility - Moved from different state (%) - Asian
Geographical mobility - Moved from different state (%) - Hispanic or Latino
Geographical mobility - Moved from different state (%) - American Indian and Alaska Native
Geographical mobility - Moved from different state (%) - Multirace
Geographical mobility - Moved from different state (%) - Other Race
Geographical mobility - Moved from abroad (%)
Geographical mobility - Moved from abroad (%) - White
Geographical mobility - Moved from abroad (%) - Black or African American
Geographical mobility - Moved from abroad (%) - Asian
Geographical mobility - Moved from abroad (%) - Hispanic or Latino
Geographical mobility - Moved from abroad (%) - American Indian and Alaska Native
Geographical mobility - Moved from abroad (%) - Multirace
Geographical mobility - Moved from abroad (%) - Other Race
Place of birth for the foreign-born population - Ireland (%)
Place of birth for the foreign-born population - Denmark (%)
Place of birth for the foreign-born population - Norway (%)
Place of birth for the foreign-born population - Sweden (%)
Place of birth for the foreign-born population - United Kingdom (%)
Place of birth for the foreign-born population - England (%)
Place of birth for the foreign-born population - Scotland (%)
Place of birth for the foreign-born population - Other Northern Europe (%)
Place of birth for the foreign-born population - Austria (%)
Place of birth for the foreign-born population - Belgium (%)
Place of birth for the foreign-born population - France (%)
Place of birth for the foreign-born population - Germany (%)
Place of birth for the foreign-born population - Netherlands (%)
Place of birth for the foreign-born population - Switzerland (%)
Place of birth for the foreign-born population - Other Western Europe (%)
Place of birth for the foreign-born population - Greece (%)
Place of birth for the foreign-born population - Italy (%)
Place of birth for the foreign-born population - Portugal (%)
Place of birth for the foreign-born population - Spain (%)
Place of birth for the foreign-born population - Other Southern Europe (%)
Place of birth for the foreign-born population - Albania (%)
Place of birth for the foreign-born population - Belarus (%)
Place of birth for the foreign-born population - Bosnia and Herzegovina (%)
Place of birth for the foreign-born population - Bulgaria (%)
Place of birth for the foreign-born population - Croatia (%)
Place of birth for the foreign-born population - Czechoslovakia (%)
Place of birth for the foreign-born population - Hungary (%)
Place of birth for the foreign-born population - Latvia (%)
Place of birth for the foreign-born population - Lithuania (%)
Place of birth for the foreign-born population - North Macedonia (Macedonia) (%)
Place of birth for the foreign-born population - Moldova (%)
Place of birth for the foreign-born population - Poland (%)
Place of birth for the foreign-born population - Romania (%)
Place of birth for the foreign-born population - Russia (%)
Place of birth for the foreign-born population - Serbia (%)
Place of birth for the foreign-born population - Ukraine (%)
Place of birth for the foreign-born population - Other Eastern Europe (%)
Place of birth for the foreign-born population - China (%)
Place of birth for the foreign-born population - Hong Kong (%)
Place of birth for the foreign-born population - Taiwan (%)
Place of birth for the foreign-born population - Japan (%)
Place of birth for the foreign-born population - Korea (%)
Place of birth for the foreign-born population - Other Eastern Asia (%)
Place of birth for the foreign-born population - Afghanistan (%)
Place of birth for the foreign-born population - Bangladesh (%)
Place of birth for the foreign-born population - India (%)
Place of birth for the foreign-born population - Iran (%)
Place of birth for the foreign-born population - Kazakhstan (%)
Place of birth for the foreign-born population - Nepal (%)
Place of birth for the foreign-born population - Pakistan (%)
Place of birth for the foreign-born population - Sri Lanka (%)
Place of birth for the foreign-born population - Uzbekistan (%)
Place of birth for the foreign-born population - Other South Central Asia (%)
Place of birth for the foreign-born population - Burma (%)
Place of birth for the foreign-born population - Cambodia (%)
Place of birth for the foreign-born population - Indonesia (%)
Place of birth for the foreign-born population - Laos (%)
Place of birth for the foreign-born population - Malaysia (%)
Place of birth for the foreign-born population - Philippines (%)
Place of birth for the foreign-born population - Singapore (%)
Place of birth for the foreign-born population - Thailand (%)
Place of birth for the foreign-born population - Vietnam (%)
Place of birth for the foreign-born population - Other South Eastern Asia (%)
Place of birth for the foreign-born population - Armenia (%)
Place of birth for the foreign-born population - Iraq (%)
Place of birth for the foreign-born population - Israel (%)
Place of birth for the foreign-born population - Jordan (%)
Place of birth for the foreign-born population - Kuwait (%)
Place of birth for the foreign-born population - Lebanon (%)
Place of birth for the foreign-born population - Saudi Arabia (%)
Place of birth for the foreign-born population - Syria (%)
Place of birth for the foreign-born population - Turkey (%)
Place of birth for the foreign-born population - Yemen (%)
Place of birth for the foreign-born population - Other Western Asia (%)
Place of birth for the foreign-born population - Eritrea (%)
Place of birth for the foreign-born population - Ethiopia (%)
Place of birth for the foreign-born population - Kenya (%)
Place of birth for the foreign-born population - Somalia (%)
Place of birth for the foreign-born population - Uganda (%)
Place of birth for the foreign-born population - Zimbabwe (%)
Place of birth for the foreign-born population - Other Eastern Africa (%)
Place of birth for the foreign-born population - Cameroon (%)
Place of birth for the foreign-born population - Congo (%)
Place of birth for the foreign-born population - Democratic Republic of Congo (Zaire) (%)
Place of birth for the foreign-born population - Other Middle Africa (%)
Place of birth for the foreign-born population - Egypt (%)
Place of birth for the foreign-born population - Morocco (%)
Place of birth for the foreign-born population - Sudan (%)
Place of birth for the foreign-born population - Other Northern Africa (%)
Place of birth for the foreign-born population - South Africa (%)
Place of birth for the foreign-born population - Other Southern Africa (%)
Place of birth for the foreign-born population - Cabo Verde (%)
Place of birth for the foreign-born population - Ghana (%)
Place of birth for the foreign-born population - Liberia (%)
Place of birth for the foreign-born population - Nigeria (%)
Place of birth for the foreign-born population - Senegal (%)
Place of birth for the foreign-born population - Sierra Leone (%)
Place of birth for the foreign-born population - Other Western Africa (%)
Place of birth for the foreign-born population - Australia (%)
Place of birth for the foreign-born population - New Zealand (%)
Place of birth for the foreign-born population - Fiji (%)
Place of birth for the foreign-born population - Micronesia (%)
Place of birth for the foreign-born population - Bahamas (%)
Place of birth for the foreign-born population - Barbados (%)
Place of birth for the foreign-born population - Cuba (%)
Place of birth for the foreign-born population - Dominica (%)
Place of birth for the foreign-born population - Dominican Republic (%)
Place of birth for the foreign-born population - Grenada (%)
Place of birth for the foreign-born population - Haiti (%)
Place of birth for the foreign-born population - Jamaica (%)
Place of birth for the foreign-born population - St. Vincent and the Grenadines (%)
Place of birth for the foreign-born population - Trinidad and Tobago (%)
Place of birth for the foreign-born population - West Indies (%)
Place of birth for the foreign-born population - Other Caribbean (%)
Place of birth for the foreign-born population - Belize (%)
Place of birth for the foreign-born population - Costa Rica (%)
Place of birth for the foreign-born population - El Salvador (%)
Place of birth for the foreign-born population - Guatemala (%)
Place of birth for the foreign-born population - Honduras (%)
Place of birth for the foreign-born population - Mexico (%)
Place of birth for the foreign-born population - Nicaragua (%)
Place of birth for the foreign-born population - Panama (%)
Place of birth for the foreign-born population - Other Central America (%)
Place of birth for the foreign-born population - Argentina (%)
Place of birth for the foreign-born population - Bolivia (%)
Place of birth for the foreign-born population - Brazil (%)
Place of birth for the foreign-born population - Chile (%)
Place of birth for the foreign-born population - Colombia (%)
Place of birth for the foreign-born population - Ecuador (%)
Place of birth for the foreign-born population - Guyana (%)
Place of birth for the foreign-born population - Peru (%)
Place of birth for the foreign-born population - Uruguay (%)
Place of birth for the foreign-born population - Venezuela (%)
Place of birth for the foreign-born population - Other South America (%)
Place of birth for the foreign-born population - Canada (%)
Place of birth for the foreign-born population - Other Northern America (%)
Place of birth for the foreign-born population - Other (%)
Latest news about races in Hays, KS collected exclusively by city-data.com from local newspapers, TV, and radio stations
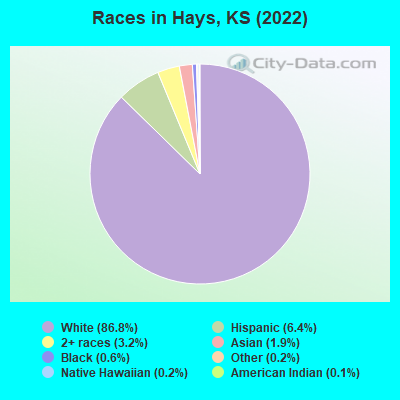
According to 2022 data, the most numerous races in Hays, KS are White alone (18,338 residents), Hispanic (1,360 residents), and Black alone (128 residents). 93.7% of Hays residents speak English at home. 3.0% of Hays, KS residents are foreign-born (1.4% born in Asia, 1.2% born in Latin America), which is 136.9% less than the foreign-born rate of 7.0% across the entire state of Kansas.
Race distribution in Hays
2000 2022
2,233,997 83.1% White alone 188,252 7.0% Hispanic 151,407 5.6% Black alone 46,301 1.7% Asian alone 42,508 1.6% Two or more races 22,322 0.8% American Indian alone 2,477 0.09% Other race alone 1,154 0.04% Native Hawaiian and Other
2,147,943 73.1% White alone 381,746 13.0% Hispanic 147,666 5.0% Black alone 145,362 4.9% Two or more races 85,085 2.9% Asian alone 13,263 0.5% Other race alone 12,065 0.4% American Indian alone 4,020 0.1% Native Hawaiian and Other
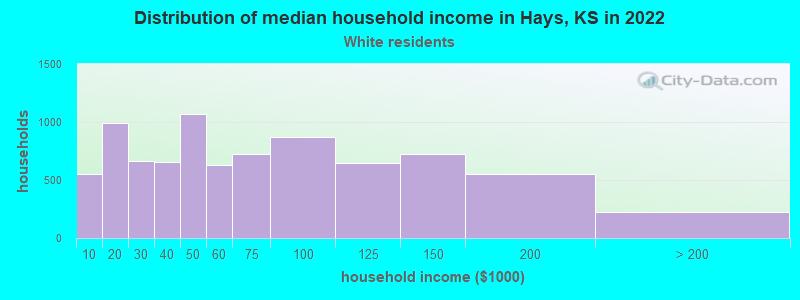
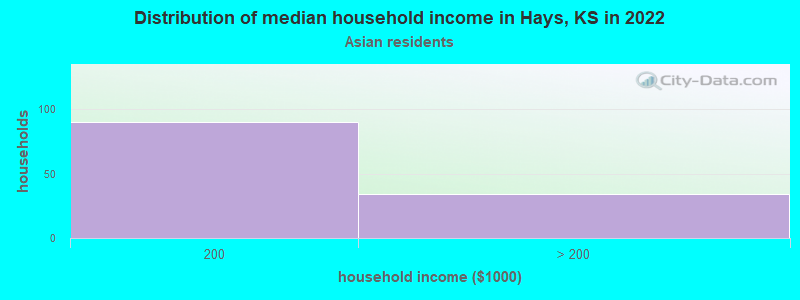
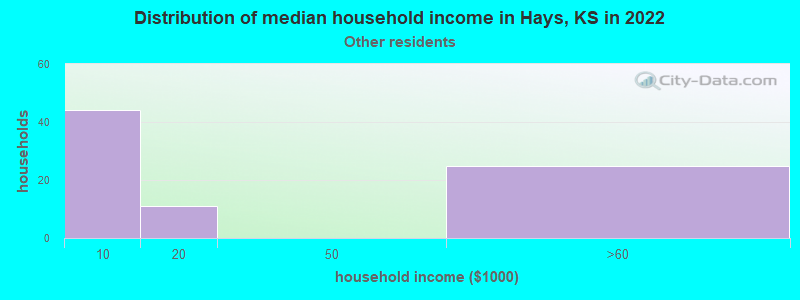
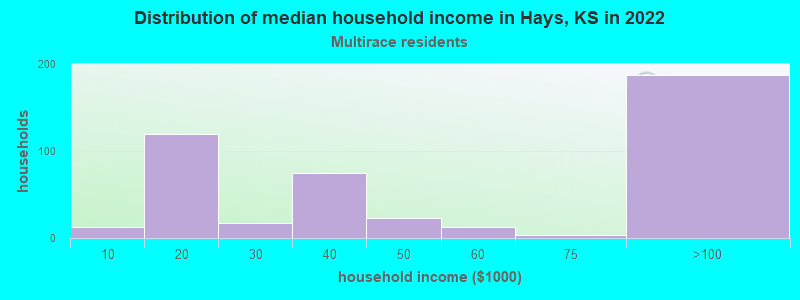
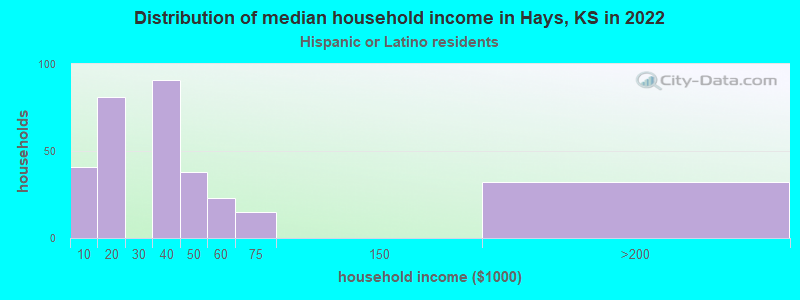
Income and house value in Hays Median household income in 2022 $54,507 White non-Hispanic householders$163,687 Asian householders$38,405 Two or more races householders$36,528 Hispanic or Latino race householdersMedian 2022 house value $235,810 White Non-Hispanic householders$219,298 Black or African American householders $127,451 Asian householders$73,787 Some other race householders$354,747 Two or more races householders$122,549 Hispanic or Latino householders
Median age by race in Hays
32.1 Median age for White residents31.6 32.4 24.9 Median age for Black or African American residents24.6 27.3 29.5 Median age for American Indian / Alaska Native residents30.9 32.9 27.1 Median age for Asian residents34.2 25.5 -627,039,626.4 Median age for Native Hawaiian / Pacific Islander residents-669,240,668.6 -641,269,840.6 21.5 Median age for Other race residents19.8 22.1 25.9 Median age for Two or more races residents25.0 26.3 32.2 Median age for White alone residents31.1 34.2 22.2 Median age for Hispanic or Latino residents26.9 20.6
Owner/renter occupied households by race in Hays
House owners and renters - White residents 4,745 58.3% Owner occupied3,397 41.7% Renter occupiedHouse owners and renters - American Indian / Alaska Native residents 6 62.9% Owner occupied4 37.1% Renter occupiedHouse owners and renters - Asian residents 98 100.0% Owner occupiedHouse owners and renters - Other race residents 56 61.6% Owner occupied35 38.4% Renter occupiedHouse owners and renters - Two or more races residents 199 42.8% Owner occupied266 57.2% Renter occupiedHouse owners and renters - White alone residents 4,817 58.8% Owner occupied3,375 41.2% Renter occupiedHouse owners and renters - Hispanic or Latino residents 65 19.9% Owner occupied264 80.1% Renter occupied
Language usage in Hays
English speakers - Total 93.7% of residents of Hays speak English at home.
4.2% of residents speak Spanish at home 740 86.9% Speak English very well112 13.1% Speak English less than very well2.1% of residents speak other language at home 331 78.3% Speak English very well92 21.7% Speak English less than very well
English speakers - Born in the United States 92.7% of residents of Hays speak English at home.
7.3% of residents speak Spanish at home 315 99.4% Speak English very well2 0.6% Speak English less than very well0.1% of residents speak other language at home 3 100.0% Speak English very well
English speakers - Native, born elsewhere 45.8% of residents of Hays speak English at home.
59.0% of residents speak Spanish at home 49 100.0% Speak English less than very well
English speakers - Foreign-born 15.7% of residents of Hays speak English at home.
34.7% of residents speak Spanish at home 160 75.1% Speak English very well53 24.9% Speak English less than very well50.1% of residents speak other language at home 211 68.7% Speak English very well96 31.3% Speak English less than very well
White (Caucasian) - Speak only English Native:
99.7% (17,496)Foreign-born:
22.9% (26)
White (Caucasian) - Speak another language Native:
1.0% (171)Foreign-born:
73.8% (84)
Asian - Speak only English Native:
39.6% (37)Foreign-born:
13.9% (36)
Asian - Speak another language Native:
54.9% (51)Foreign-born:
86.1% (224)
Other race - Speak only English Native:
31.2% (123)Foreign-born:
54.7% (39)
Other race - Speak another language Native:
65.7% (259)Foreign-born:
61.8% (45)
Two or more races - Speak another language Native:
34.1% (373)Foreign-born:
100.0% (72)
White alone - Speak only English Native:
99.2% (17,339)Foreign-born:
39.8% (28)
White alone - Speak another language Native:
0.9% (153)Foreign-born:
60.4% (42)
Hispanic or Latino - Speak only English Native:
44.9% (442)Foreign-born:
12.2% (28)
Hispanic or Latino - Speak another language Native:
55.0% (542)Foreign-born:
88.9% (208)
Foreign-born residents in Hays 624 residents are foreign born (1.4% Asia , 1.2% Latin America ).
This city:
3.0%Kansas:
7.1%
Marital status for residents in Hays Marital status - White (Caucasian) population 15 years and over
Males 47.6% Never married43.3% Now married0.0% Separated2.5% Widowed6.6% DivorcedFemales 34.5% Never married46.2% Now married0.3% Separated9.8% Widowed9.1% DivorcedWomen who gave birth in the past 12 months Now married:
69.1% (163)Unmarried:
30.9% (73)
Women who did not give birth in the past 12 months Now married:
38.4% (1,729)Unmarried:
61.6% (2,775)
Marital status - Black or African American population 15 years and over
Males 66.3% Never married33.7% Now married0.0% Separated0.0% Widowed0.0% DivorcedFemales 100.0% Never married0.0% Now married0.0% Separated0.0% Widowed0.0% DivorcedWomen who did not give birth in the past 12 months Now married:
0.0% (0)Unmarried:
100.0% (24)
Marital status - American Indian / Alaska Native population 15 years and over
Males 33.3% Never married66.7% Now married0.0% Separated0.0% Widowed0.0% DivorcedFemales 50.0% Never married18.8% Now married0.0% Separated0.0% Widowed31.3% DivorcedWomen who did not give birth in the past 12 months Now married:
27.3% (3)Unmarried:
72.7% (9)
Marital status - Asian population 15 years and over
Males 15.7% Never married78.3% Now married6.1% Separated0.0% Widowed0.0% DivorcedFemales 45.6% Never married54.4% Now married0.0% Separated0.0% Widowed0.0% DivorcedWomen who did not give birth in the past 12 months Now married:
49.5% (91)Unmarried:
50.5% (93)
Marital status - Other race population 15 years and over
Males 72.8% Never married27.2% Now married0.0% Separated0.0% Widowed0.0% DivorcedFemales 50.3% Never married35.1% Now married9.3% Separated0.0% Widowed5.3% DivorcedWomen who did not give birth in the past 12 months Now married:
44.4% (84)Unmarried:
55.6% (106)
Marital status - Two or more races population 15 years and over
Males 67.7% Never married26.9% Now married0.0% Separated0.0% Widowed5.4% DivorcedFemales 25.8% Never married55.5% Now married0.0% Separated7.4% Widowed11.3% DivorcedWomen who gave birth in the past 12 months Now married:
100.0% (25)Unmarried:
0.0% (0)
Women who did not give birth in the past 12 months Now married:
58.8% (168)Unmarried:
41.2% (118)
Marital status - White alone, not Hispanic / Latino population 15 years and over
Males 47.7% Never married43.1% Now married0.0% Separated2.5% Widowed6.7% DivorcedFemales 33.8% Never married46.8% Now married0.3% Separated10.0% Widowed9.0% DivorcedWomen who gave birth in the past 12 months Now married:
69.1% (169)Unmarried:
30.9% (76)
Women who did not give birth in the past 12 months Now married:
39.1% (1,747)Unmarried:
60.9% (2,724)
Marital status - Hispanic or Latino population 15 years and over
Males 58.6% Never married36.6% Now married0.0% Separated0.0% Widowed4.8% DivorcedFemales 56.1% Never married32.5% Now married0.0% Separated3.3% Widowed8.1% DivorcedWomen who gave birth in the past 12 months Now married:
100.0% (20)Unmarried:
0.0% (0)
Women who did not give birth in the past 12 months Now married:
26.0% (100)Unmarried:
74.0% (285)
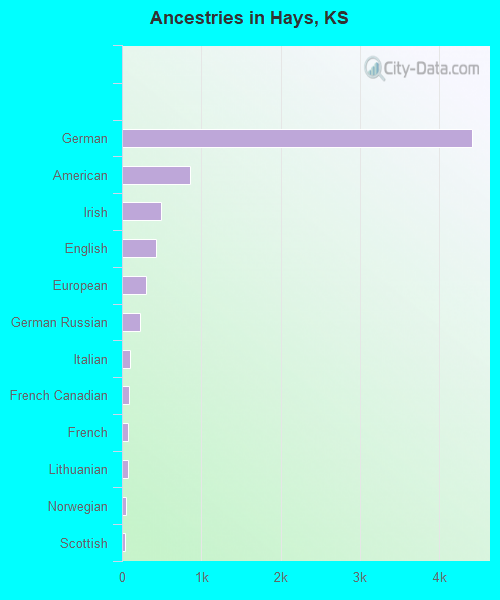
Ancestries in Hays
4,408 49.7% German858 9.7% American488 5.5% Irish423 4.8% English302 3.4% European233 2.6% German Russian105 1.2% Italian87 1.0% French Canadian77 0.9% French75 0.8% Lithuanian48 0.5% Norwegian42 0.5% Scottish39 0.4% Northern European39 0.4% Pennsylvania German26 0.3% Eastern European25 0.3% Scotch-Irish21 0.2% Swedish14 0.2% Dutch12 0.1% Polish8 0.09% Iranian8 0.09% Scandinavian8 0.09% Sudanese7 0.08% Canadian5 0.06% Russian4 0.05% Turkish2 0.02% Senegalese
Geographical mobility in Hays Same house 1 year ago 13,690 75.0% White (Caucasian)83 64.8% Black or African American29 77.2% American Indian / Alaska Native345 83.9% Asian20 100.0% Native Hawaiian / Pacific Islander356 78.9% Other race769 60.7% Two or more races13,611 74.7% White alone, not Hispanic / Latino1,027 76.4% Hispanic or LatinoMoved within same county 2,477 13.6% White / Caucasian9 6.7% Black or African American4 11.8% American Indian / Alaska Native24 5.4% Other race223 17.6% Two or more races2,554 14.0% White alone, not Hispanic / Latino58 4.3% Hispanic or LatinoMoved within same state 1,271 7.0% White / Caucasian4 2.8% Black or African American2 6.3% American Indian / Alaska Native12 2.8% Asian39 8.7% Other race194 15.3% Two or more races1,235 6.8% White alone, not Hispanic / Latino203 15.1% Hispanic or LatinoMoved from different state 643 3.5% White / Caucasian2 1.3% Black or African American39 9.4% Asian10 2.2% Other race54 4.3% Two or more races643 3.5% White alone, not Hispanic / Latino37 2.7% Hispanic or LatinoMoved from abroad 2 0.0% White29 22.1% Black or African American16 3.9% Asian2 0.0% White alone, not Hispanic / Latino
Children Nativity (place of birth) in Hays
Children under 6 years - Living with two parents Both parents native 887 100.0% NativeBoth parents foreign-born 78 100.0% NativeOne native, one foreign-born parent 116 100.0% NativeChildren under 6 years - Living with one parent Native parent 159 100.0% NativeChildren 6 to 17 years - Living with two parents Both parents native 1,888 100.0% NativeBoth parents foreign-born 8 100.0% NativeOne native, one foreign-born parent 107 100.0% NativeChildren 6 to 17 years - Living with one parent Native parent 617 100.0% NativeForeign-born parent 18 50.2% Native18 49.8% Foreign-born
Grandparents responsible for own grandchildren in Hays
Grandparents (30 to 59 years) White / Caucasian 52 60.0% Responsible for grandchildren35 40.0% Not responsible for grandchildrenWhite alone, not Hispanic / Latino 55 59.4% Responsible for grandchildren38 40.6% Not responsible for grandchildrenGrandparents (60 years and over) White / Caucasian 15 41.1% Responsible for grandchildren21 58.9% Not responsible for grandchildrenWhite alone, not Hispanic / Latino 15 39.5% Responsible for grandchildren23 60.5% Not responsible for grandchildren