Races in Havre de Grace, Maryland (MD) Detailed Stats
Ancestries, Foreign-born residents, place of birth
Settings
X


Recent posts about races in Havre de Grace, Maryland on our local forum with over 2,400,000 registered users:

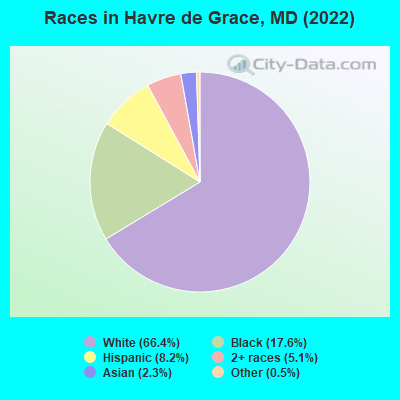
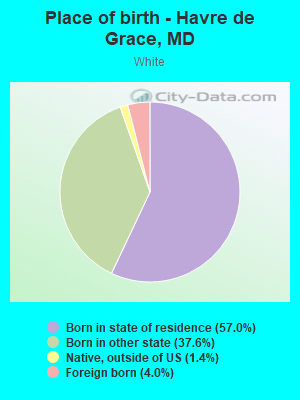
According to 2022 data, the most numerous races in Havre de Grace, MD are White alone (9,900 residents), Black alone (2,621 residents), and Hispanic (1,219 residents). 94.6% of Havre de Grace residents speak English at home. 6.3% of Havre de Grace, MD residents are foreign-born (2.4% born in Latin America, 1.8% born in Europe, 1.3% born in Asia), which is 153.9% less than the foreign-born rate of 16.0% across the entire state of Maryland.
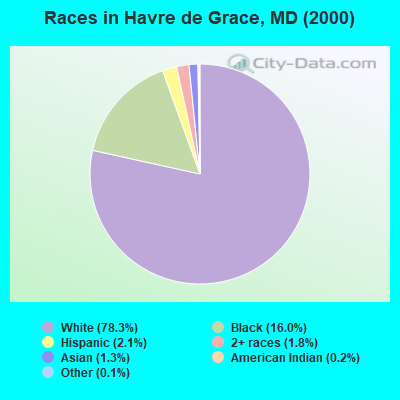
Race distribution in Havre de Grace
2000
2022

- 8,87578.3%White alone
- 1,81616.0%Black alone
- 2412.1%Hispanic
- 2061.8%Two or more races
- 1461.3%Asian alone
- 230.2%American Indian alone
- 140.1%Other race alone
- 100.09%Native Hawaiian and Other
Pacific Islander alone
-
- 9,90066.4%White alone
- 2,62117.6%Black alone
- 1,2198.2%Hispanic
- 7595.1%Two or more races
- 3372.3%Asian alone
- 750.5%Other race alone
- 110.07%American Indian alone
2000
2022
-
- 3,286,54762.1%White alone
- 1,464,73527.7%Black alone
- 227,9164.3%Hispanic
- 209,7384.0%Asian alone
- 82,9461.6%Two or more races
- 13,3120.3%American Indian alone
- 9,3790.2%Other race alone
- 1,9130.04%Native Hawaiian and Other
Pacific Islander alone

-
- 2,906,49247.1%White alone
- 1,800,91429.2%Black alone
- 705,84211.4%Hispanic
- 401,8186.5%Asian alone
- 291,3174.7%Two or more races
- 46,9300.8%Other race alone
- 8,9300.1%American Indian alone
- 2,4170.04%Native Hawaiian and Other
Pacific Islander alone

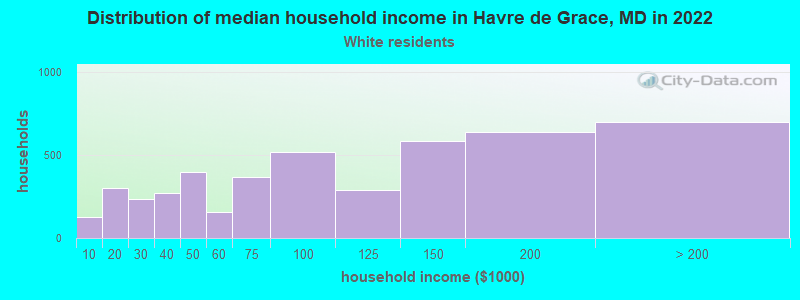
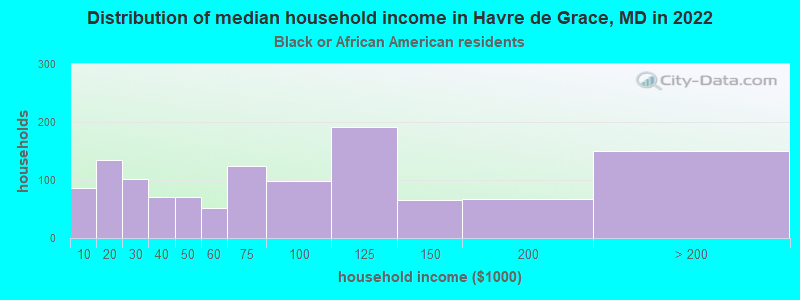
Income and house value in Havre de Grace
- Median household income in 2022
- $100,951White non-Hispanic householders
- $82,008Black householders
- $83,846Asian householders
- $50,147Some other race householders
- $91,261Two or more races householders
- $43,529Hispanic or Latino race householders
- Median 2022 house value
- $364,004White Non-Hispanic householders
- $329,761Black or African American householders
- $353,069American Indian or Alaska Native householders
- $256,385Asian householders
- $467,594Some other race householders
- $329,761Two or more races householders
- $359,687Hispanic or Latino householders
Household income for White non-Hispanic householders
Household income for Black householders
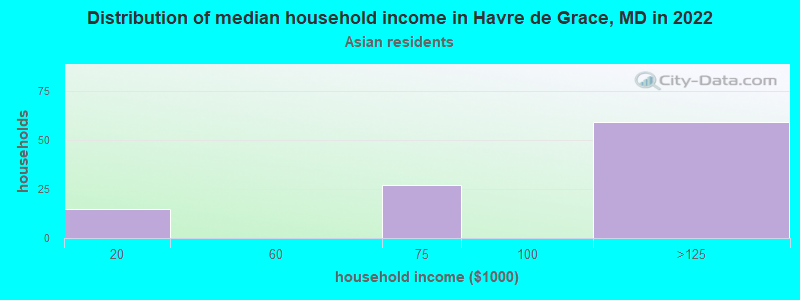
Household income for Asian householders
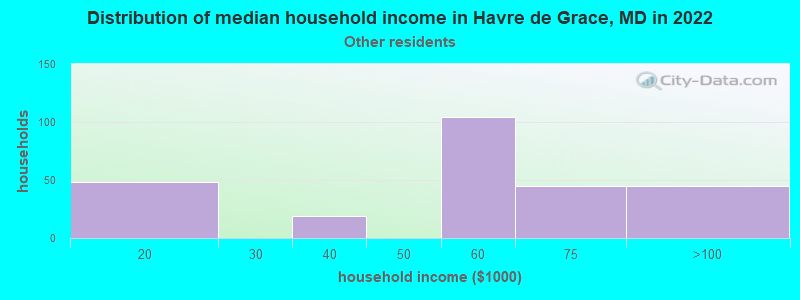
Household income for Some other race householders
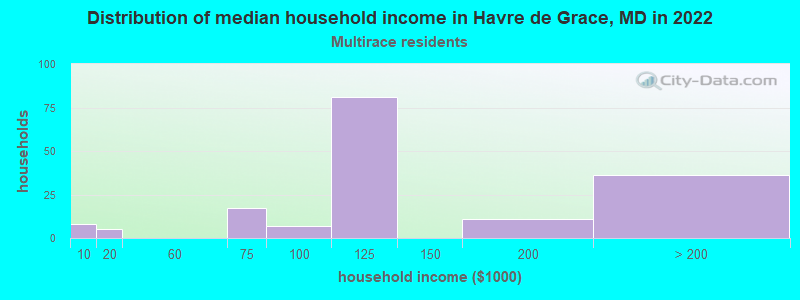
Household income for Two or more races householders
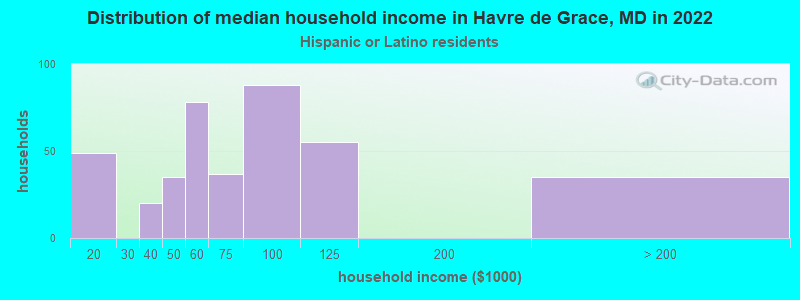
Household income for Hispanic or Latino race householders
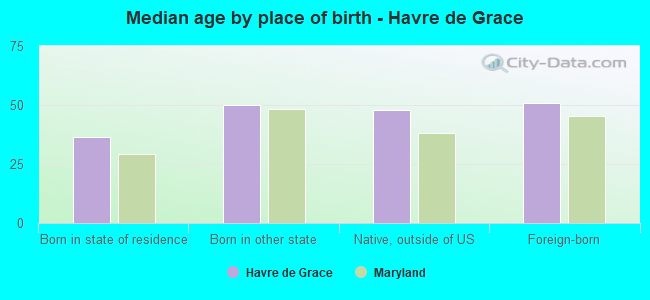
Median age by race in Havre de Grace
- 47.0Median age for White residents
- 44.6Males
- 50.1Females
- 49.1Median age for Black or African American residents
- 47.2Males
- 46.0Females
- -647,863,247.2Median age for American Indian / Alaska Native residents
- -642,487,046.0Males
- -676,818,950.3Females
- 52.0Median age for Asian residents
- 70.5Males
- 50.2Females
- -763,333,332.6Median age for Native Hawaiian / Pacific Islander residents
- -666,666,666.0Males
- -760,942,760.2Females
- 20.1Median age for Other race residents
- 23.5Males
- 20.2Females
- 20.3Median age for Two or more races residents
- 17.3Males
- 19.8Females
- 47.3Median age for White alone residents
- 45.1Males
- 50.4Females
- 26.2Median age for Hispanic or Latino residents
- 24.6Males
- 30.2Females
Owner/renter occupied households by race in Havre de Grace
- House owners and renters - White residents
- 3,27472.2%Owner occupied
- 1,25827.8%Renter occupied
- House owners and renters - Black or African American residents
- 77167.2%Owner occupied
- 37632.8%Renter occupied
- House owners and renters - Asian residents
- 8772.0%Owner occupied
- 3428.0%Renter occupied
- House owners and renters - Other race residents
- 11452.7%Owner occupied
- 10247.3%Renter occupied
- House owners and renters - Two or more races residents
- 12763.9%Owner occupied
- 7236.1%Renter occupied
- House owners and renters - White alone residents
- 3,25172.5%Owner occupied
- 1,23527.5%Renter occupied
- House owners and renters - Hispanic or Latino residents
- 24762.0%Owner occupied
- 15238.0%Renter occupied
Language usage in Havre de Grace
- English speakers - Total
- 94.6% of residents of Havre de Grace speak English at home.
- 2.8% of residents speak Spanish at home
- 15839.6%Speak English very well
- 24160.4%Speak English less than very well
- 2.5% of residents speak other language at home
- 23565.6%Speak English very well
- 12334.4%Speak English less than very well
- English speakers - Born in the United States
- 98.5% of residents of Havre de Grace speak English at home.
- 0.4% of residents speak Spanish at home
- 22100.0%Speak English very well
- 0.8% of residents speak other language at home
- 4295.5%Speak English very well
- 24.5%Speak English less than very well
- English speakers - Native, born elsewhere
- 61.5% of residents of Havre de Grace speak English at home.
- 47.4% of residents speak Spanish at home
- 7146.1%Speak English very well
- 8353.9%Speak English less than very well
- 4.9% of residents speak other language at home
- 16100.0%Speak English very well
- English speakers - Foreign-born
- 59.4% of residents of Havre de Grace speak English at home.
- 16.8% of residents speak Spanish at home
- 5430.5%Speak English very well
- 12369.5%Speak English less than very well
- 26.6% of residents speak other language at home
- 16558.9%Speak English very well
- 11541.1%Speak English less than very well
White (Caucasian) - Speak only English
| Native: | 99.0% (9,200) |
| Foreign-born: | 64.5% (255) |
White (Caucasian) - Speak another language
| Native: | 1.0% (90) |
| Foreign-born: | 40.1% (159) |
Black or African American - Speak only English
| Native: | 100.0% (2,606) |
| Foreign-born: | 81.3% (71) |
Asian - Speak another language
| Native: | 94.0% (5) |
| Foreign-born: | 42.9% (147) |
Other race - Speak only English
| Native: | 69.4% (267) |
| Foreign-born: | 29.5% (70) |
Other race - Speak another language
| Native: | 32.1% (124) |
| Foreign-born: | 72.6% (172) |
Two or more races - Speak another language
| Native: | 6.1% (62) |
| Foreign-born: | 94.1% (23) |
White alone - Speak only English
| Native: | 98.8% (9,036) |
| Foreign-born: | 68.2% (298) |
White alone - Speak another language
| Native: | 0.9% (87) |
| Foreign-born: | 38.2% (167) |
Hispanic or Latino - Speak only English
| Native: | 86.5% (821) |
| Foreign-born: | 11.6% (23) |
Hispanic or Latino - Speak another language
| Native: | 18.5% (176) |
| Foreign-born: | 85.0% (166) |
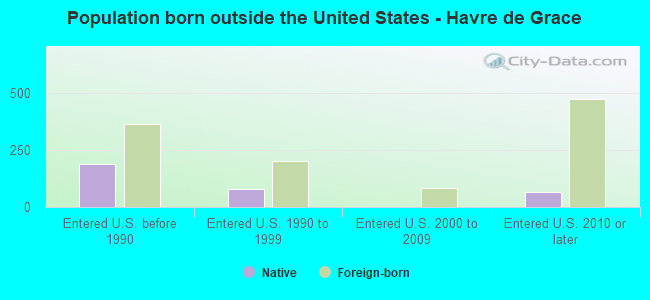
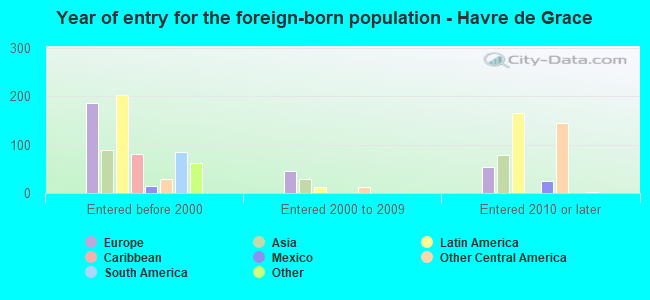
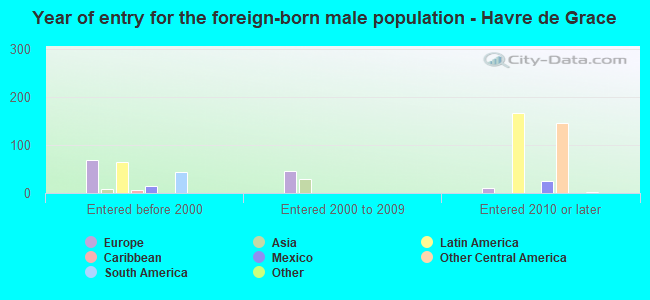
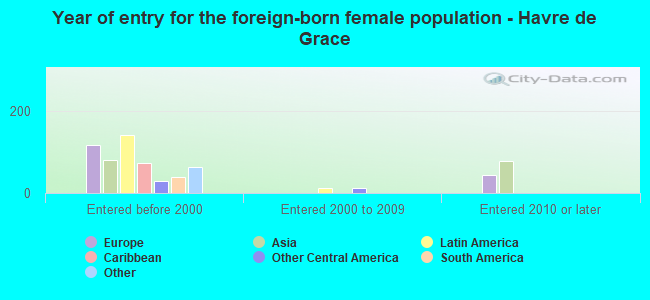
Foreign-born residents in Havre de Grace
939 residents are foreign born (2.4% Latin America, 1.8% Europe, 1.3% Asia).
| This city: | 6.3% |
| Maryland: | 15.7% |
Marital status for residents in Havre de Grace
Marital status - White (Caucasian) population 15 years and over
- Males
- 31.5%Never married
- 52.9%Now married
- 1.7%Separated
- 1.4%Widowed
- 12.5%Divorced
- Females
- 22.1%Never married
- 51.6%Now married
- 0.6%Separated
- 12.7%Widowed
- 13.0%Divorced
Women who gave birth in the past 12 months
| Now married: | 80.2% (89) |
| Unmarried: | 19.8% (22) |
Women who did not give birth in the past 12 months
| Now married: | 49.9% (889) |
| Unmarried: | 50.1% (892) |
Marital status - Black or African American population 15 years and over
- Males
- 24.1%Never married
- 55.4%Now married
- 6.7%Separated
- 6.9%Widowed
- 6.8%Divorced
- Females
- 31.0%Never married
- 31.4%Now married
- 0.8%Separated
- 18.7%Widowed
- 18.2%Divorced
Women who did not give birth in the past 12 months
| Now married: | 22.6% (155) |
| Unmarried: | 77.4% (531) |
Marital status - Asian population 15 years and over
- Males
- 0.0%Never married
- 100.0%Now married
- 0.0%Separated
- 0.0%Widowed
- 0.0%Divorced
- Females
- 0.5%Never married
- 54.5%Now married
- 19.6%Separated
- 20.6%Widowed
- 4.8%Divorced
Women who did not give birth in the past 12 months
| Now married: | 94.7% (89) |
| Unmarried: | 5.3% (5) |
Marital status - Other race population 15 years and over
- Males
- 93.0%Never married
- 7.0%Now married
- 0.0%Separated
- 0.0%Widowed
- 0.0%Divorced
- Females
- 35.1%Never married
- 41.5%Now married
- 0.0%Separated
- 0.0%Widowed
- 23.4%Divorced
Women who did not give birth in the past 12 months
| Now married: | 12.3% (16) |
| Unmarried: | 87.7% (117) |
Marital status - Two or more races population 15 years and over
- Males
- 27.0%Never married
- 49.5%Now married
- 0.0%Separated
- 0.0%Widowed
- 23.4%Divorced
- Females
- 65.9%Never married
- 15.1%Now married
- 0.0%Separated
- 0.0%Widowed
- 19.0%Divorced
Women who did not give birth in the past 12 months
| Now married: | 12.3% (53) |
| Unmarried: | 87.7% (377) |
Marital status - White alone, not Hispanic / Latino population 15 years and over
- Males
- 31.7%Never married
- 52.6%Now married
- 1.7%Separated
- 1.4%Widowed
- 12.6%Divorced
- Females
- 21.8%Never married
- 51.5%Now married
- 0.6%Separated
- 13.1%Widowed
- 13.0%Divorced
Women who gave birth in the past 12 months
| Now married: | 80.2% (90) |
| Unmarried: | 19.8% (22) |
Women who did not give birth in the past 12 months
| Now married: | 49.6% (853) |
| Unmarried: | 50.4% (865) |
Marital status - Hispanic or Latino population 15 years and over
- Males
- 66.7%Never married
- 24.8%Now married
- 0.0%Separated
- 0.0%Widowed
- 8.5%Divorced
- Females
- 24.9%Never married
- 41.4%Now married
- 0.0%Separated
- 0.0%Widowed
- 33.7%Divorced
Women who did not give birth in the past 12 months
| Now married: | 35.8% (140) |
| Unmarried: | 64.2% (252) |
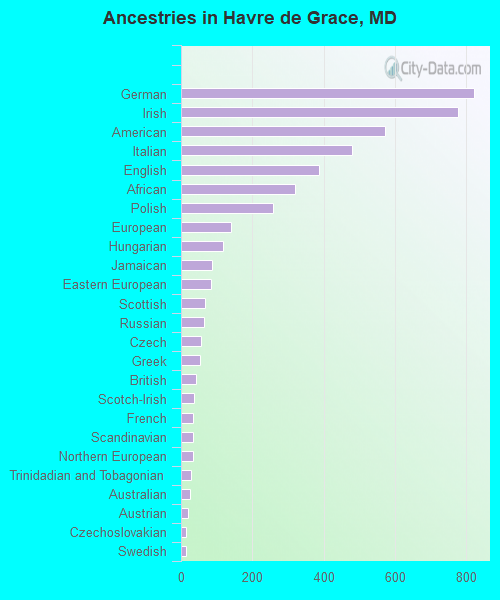
Ancestries in Havre de Grace

- 82311.4%German
- 77810.8%Irish
- 5737.9%American
- 4796.6%Italian
- 3865.4%English
- 3204.4%African
- 2593.6%Polish
- 1391.9%European
- 1181.6%Hungarian
- 871.2%Jamaican
- 841.2%Eastern European
- 680.9%Scottish
- 640.9%Russian
- 560.8%Czech
- 530.7%Greek
- 410.6%British
- 360.5%Scotch-Irish
- 340.5%French
- 340.5%Scandinavian
- 330.5%Northern European
- 270.4%Trinidadian and Tobagonian
- 240.3%Australian
- 190.3%Austrian
- 150.2%Czechoslovakian
- 130.2%Swedish
- 100.1%British West Indian
- 80.1%Lithuanian
- 80.1%Romanian
- 60.08%Lebanese
- 60.08%Danish
- 60.08%Serbian
- 50.07%Icelander
- 40.06%Finnish
- 20.03%Ukrainian
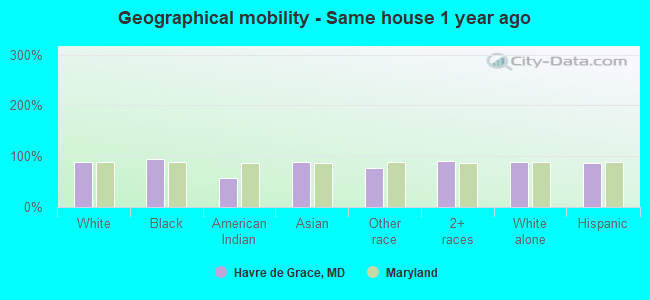
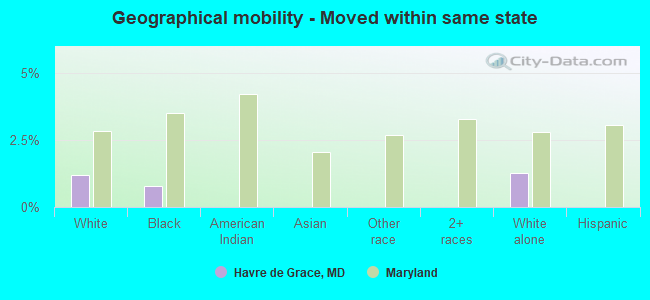
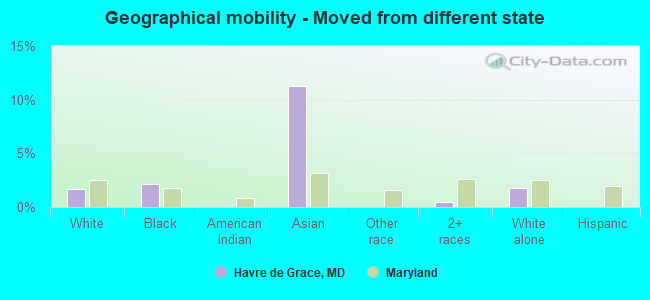
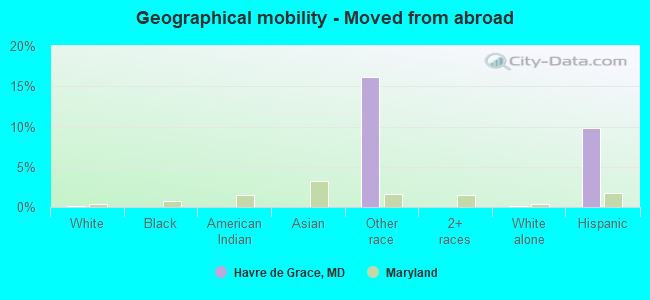
Geographical mobility in Havre de Grace

- Same house 1 year ago
- 8,90088.7%White (Caucasian)
- 2,50894.4%Black or African American
- 2257.1%American Indian / Alaska Native
- 26887.8%Asian
- 57677.1%Other race
- 94591.1%Two or more races
- 8,73188.4%White alone, not Hispanic / Latino
- 1,02186.7%Hispanic or Latino
-
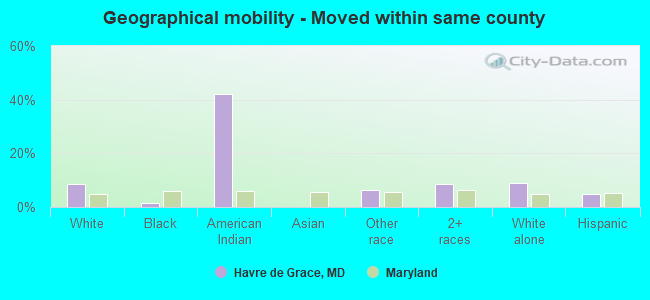
- Moved within same county
- 8598.6%White / Caucasian
- 411.5%Black or African American
- 1641.9%American Indian / Alaska Native
- 476.3%Other race
- 888.5%Two or more races
- 8798.9%White alone, not Hispanic / Latino
- 595.0%Hispanic or Latino
-
- Moved within same state
- 1201.2%White / Caucasian
- 210.8%Black or African American
- 1231.2%White alone, not Hispanic / Latino
-
- Moved from different state
- 1691.7%White / Caucasian
- 582.2%Black or African American
- 3411.2%Asian
- 50.5%Two or more races
- 1751.8%White alone, not Hispanic / Latino
-
- Moved from abroad
- 130.1%White
- 12116.2%Other race
- 140.1%White alone, not Hispanic / Latino
- 1159.8%Hispanic or Latino
Children Nativity (place of birth) in Havre de Grace
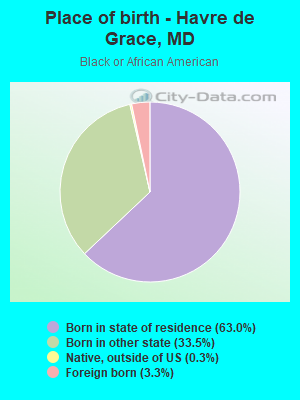
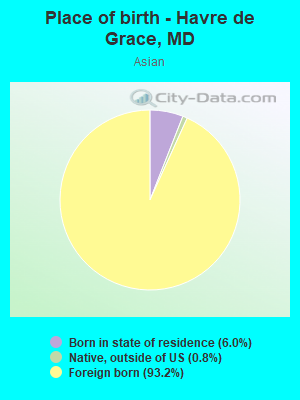
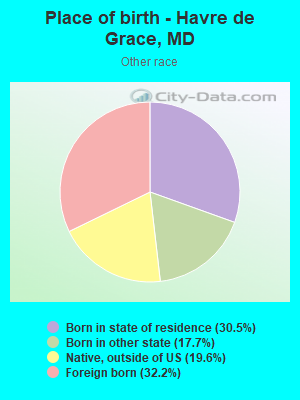
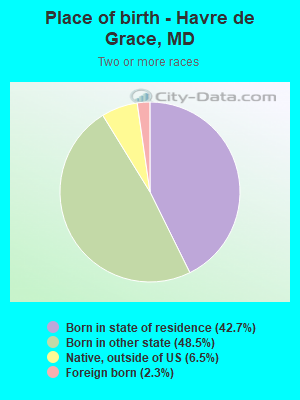
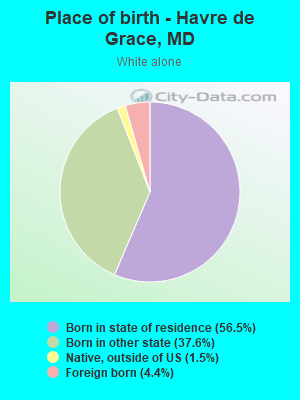
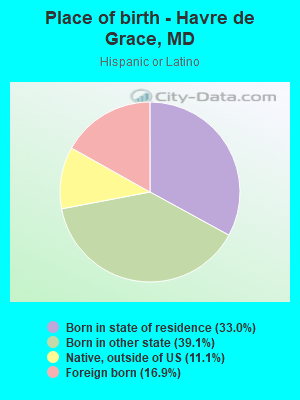
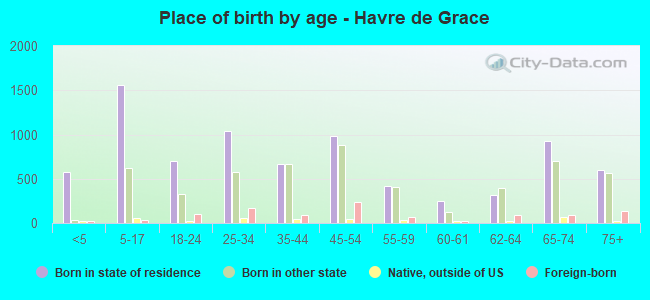
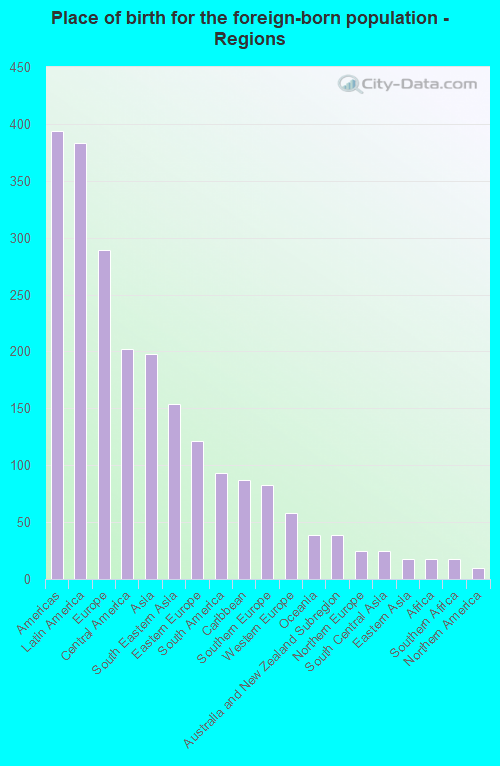
Place of birth for residents in Havre de Grace
![Place of birth for the foreign-born population - Regions]()
- 394Americas
- 383Latin America
- 289Europe
- 202Central America
- 198Asia
- 154South Eastern Asia
- 121Eastern Europe
- 93South America
- 87Caribbean
- 83Southern Europe
- 58Western Europe
- 39Oceania
- 39Australia and New Zealand Subregion
- 25Northern Europe
- 25South Central Asia
- 18Eastern Asia
- 18Africa
- 18Southern Africa
- 10Northern America
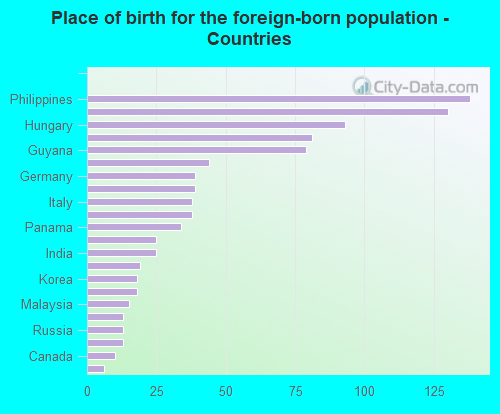
![Place of birth for the foreign-born population - Countries]()
- 138Philippines
- 130Guatemala
- 93Hungary
- 81Bahamas
- 79Guyana
- 44Greece
- 39Germany
- 39Australia
- 38Italy
- 38Mexico
- 34Panama
- 25England
- 25India
- 19Austria
- 18Korea
- 18South Africa
- 15Malaysia
- 13Czechoslovakia
- 13Russia
- 13Chile
- 10Canada
- 6Jamaica
Grandparents responsible for own grandchildren in Havre de Grace
Zip codes: 21078.