Races in Hasbrouck Heights, New Jersey (NJ) Detailed Stats
Data:
Races - White alone (%)
Races - White alone (% change since 2000)
Races - Black alone (%)
Races - Black alone (% change since 2000)
Races - American Indian alone (%)
Races - American Indian alone (% change since 2000)
Races - Asian alone (%)
Races - Asian alone (% change since 2000)
Races - Hispanic (%)
Races - Hispanic (% change since 2000)
Races - Native Hawaiian and Other Pacific Islander alone (%)
Races - Native Hawaiian and Other Pacific Islander alone (% change since 2000)
Races - Two or more races(%)
Races - Two or more races(% change since 2000)
Races - Other race alone (%)
Races - Other race alone (% change since 2000)
Racial diversity
Place of birth - Born in state of residence (%)
Place of birth - Born in state of residence (%) - White
Place of birth - Born in state of residence (%) - Black or African American
Place of birth - Born in state of residence (%) - Asian
Place of birth - Born in state of residence (%) - Hispanic or Latino
Place of birth - Born in state of residence (%) - American Indian and Alaska Native
Place of birth - Born in state of residence (%) - Multirace
Place of birth - Born in state of residence (%) - Other Race
Place of birth - Born in other state (%)
Place of birth - Born in other state (%) - White
Place of birth - Born in other state (%) - Black or African American
Place of birth - Born in other state (%) - Asian
Place of birth - Born in other state (%) - Hispanic or Latino
Place of birth - Born in other state (%) - American Indian and Alaska Native
Place of birth - Born in other state (%) - Multirace
Place of birth - Born in other state (%) - Other Race
Place of birth - Native, outside of US (%)
Place of birth - Native, outside of US (%) - White
Place of birth - Native, outside of US (%) - Black or African American
Place of birth - Native, outside of US (%) - Asian
Place of birth - Native, outside of US (%) - Hispanic or Latino
Place of birth - Native, outside of US (%) - American Indian and Alaska Native
Place of birth - Native, outside of US (%) - Multirace
Place of birth - Native, outside of US (%) - Other Race
Place of birth - Foreign born (%)
Place of birth - Foreign born (%) - White
Place of birth - Foreign born (%) - Black or African American
Place of birth - Foreign born (%) - Asian
Place of birth - Foreign born (%) - Hispanic or Latino
Place of birth - Foreign born (%) - American Indian and Alaska Native
Place of birth - Foreign born (%) - Multirace
Place of birth - Foreign born (%) - Other Race
Residents speaking English at home (%)
Residents speaking English at home - Born in the United States (%)
Residents speaking English at home - Native, born elsewhere (%)
Residents speaking English at home - Foreign born (%)
Residents speaking Spanish at home (%)
Residents speaking Spanish at home - Born in the United States (%)
Residents speaking Spanish at home - Native, born elsewhere (%)
Residents speaking Spanish at home - Foreign born (%)
Residents speaking other language at home (%)
Residents speaking other language at home - Born in the United States (%)
Residents speaking other language at home - Native, born elsewhere (%)
Residents speaking other language at home - Foreign born (%)
Marital status - Never married (%)
Marital status - Now married (%)
Marital status - Separated (%)
Marital status - Widowed (%)
Marital status - Divorced (%)
Ancestries Reported - Arab (%)
Ancestries Reported - Czech (%)
Ancestries Reported - Danish (%)
Ancestries Reported - Dutch (%)
Ancestries Reported - English (%)
Ancestries Reported - French (%)
Ancestries Reported - French Canadian (%)
Ancestries Reported - German (%)
Ancestries Reported - Greek (%)
Ancestries Reported - Hungarian (%)
Ancestries Reported - Irish (%)
Ancestries Reported - Italian (%)
Ancestries Reported - Lithuanian (%)
Ancestries Reported - Norwegian (%)
Ancestries Reported - Polish (%)
Ancestries Reported - Portuguese (%)
Ancestries Reported - Russian (%)
Ancestries Reported - Scotch-Irish (%)
Ancestries Reported - Scottish (%)
Ancestries Reported - Slovak (%)
Ancestries Reported - Subsaharan African (%)
Ancestries Reported - Swedish (%)
Ancestries Reported - Swiss (%)
Ancestries Reported - Ukrainian (%)
Ancestries Reported - United States (%)
Ancestries Reported - Welsh (%)
Ancestries Reported - West Indian (%)
Ancestries Reported - Other (%)
Geographical mobility - Same house 1 year ago (%)
Geographical mobility - Same house 1 year ago (%) - White
Geographical mobility - Same house 1 year ago (%) - Black or African American
Geographical mobility - Same house 1 year ago (%) - Asian
Geographical mobility - Same house 1 year ago (%) - Hispanic or Latino
Geographical mobility - Same house 1 year ago (%) - American Indian and Alaska Native
Geographical mobility - Same house 1 year ago (%) - Multirace
Geographical mobility - Same house 1 year ago (%) - Other Race
Geographical mobility - Moved within same county (%)
Geographical mobility - Moved within same county (%) - White
Geographical mobility - Moved within same county (%) - Black or African American
Geographical mobility - Moved within same county (%) - Asian
Geographical mobility - Moved within same county (%) - Hispanic or Latino
Geographical mobility - Moved within same county (%) - American Indian and Alaska Native
Geographical mobility - Moved within same county (%) - Multirace
Geographical mobility - Moved within same county (%) - Other Race
Geographical mobility - Moved from different county within same state (%)
Geographical mobility - Moved from different county within same state (%) - White
Geographical mobility - Moved from different county within same state (%) - Black or African American
Geographical mobility - Moved from different county within same state (%) - Asian
Geographical mobility - Moved from different county within same state (%) - Hispanic or Latino
Geographical mobility - Moved from different county within same state (%) - American Indian and Alaska Native
Geographical mobility - Moved from different county within same state (%) - Multirace
Geographical mobility - Moved from different county within same state (%) - Other Race
Geographical mobility - Moved from different state (%)
Geographical mobility - Moved from different state (%) - White
Geographical mobility - Moved from different state (%) - Black or African American
Geographical mobility - Moved from different state (%) - Asian
Geographical mobility - Moved from different state (%) - Hispanic or Latino
Geographical mobility - Moved from different state (%) - American Indian and Alaska Native
Geographical mobility - Moved from different state (%) - Multirace
Geographical mobility - Moved from different state (%) - Other Race
Geographical mobility - Moved from abroad (%)
Geographical mobility - Moved from abroad (%) - White
Geographical mobility - Moved from abroad (%) - Black or African American
Geographical mobility - Moved from abroad (%) - Asian
Geographical mobility - Moved from abroad (%) - Hispanic or Latino
Geographical mobility - Moved from abroad (%) - American Indian and Alaska Native
Geographical mobility - Moved from abroad (%) - Multirace
Geographical mobility - Moved from abroad (%) - Other Race
Place of birth for the foreign-born population - Ireland (%)
Place of birth for the foreign-born population - Denmark (%)
Place of birth for the foreign-born population - Norway (%)
Place of birth for the foreign-born population - Sweden (%)
Place of birth for the foreign-born population - United Kingdom (%)
Place of birth for the foreign-born population - England (%)
Place of birth for the foreign-born population - Scotland (%)
Place of birth for the foreign-born population - Other Northern Europe (%)
Place of birth for the foreign-born population - Austria (%)
Place of birth for the foreign-born population - Belgium (%)
Place of birth for the foreign-born population - France (%)
Place of birth for the foreign-born population - Germany (%)
Place of birth for the foreign-born population - Netherlands (%)
Place of birth for the foreign-born population - Switzerland (%)
Place of birth for the foreign-born population - Other Western Europe (%)
Place of birth for the foreign-born population - Greece (%)
Place of birth for the foreign-born population - Italy (%)
Place of birth for the foreign-born population - Portugal (%)
Place of birth for the foreign-born population - Spain (%)
Place of birth for the foreign-born population - Other Southern Europe (%)
Place of birth for the foreign-born population - Albania (%)
Place of birth for the foreign-born population - Belarus (%)
Place of birth for the foreign-born population - Bosnia and Herzegovina (%)
Place of birth for the foreign-born population - Bulgaria (%)
Place of birth for the foreign-born population - Croatia (%)
Place of birth for the foreign-born population - Czechoslovakia (%)
Place of birth for the foreign-born population - Hungary (%)
Place of birth for the foreign-born population - Latvia (%)
Place of birth for the foreign-born population - Lithuania (%)
Place of birth for the foreign-born population - North Macedonia (Macedonia) (%)
Place of birth for the foreign-born population - Moldova (%)
Place of birth for the foreign-born population - Poland (%)
Place of birth for the foreign-born population - Romania (%)
Place of birth for the foreign-born population - Russia (%)
Place of birth for the foreign-born population - Serbia (%)
Place of birth for the foreign-born population - Ukraine (%)
Place of birth for the foreign-born population - Other Eastern Europe (%)
Place of birth for the foreign-born population - China (%)
Place of birth for the foreign-born population - Hong Kong (%)
Place of birth for the foreign-born population - Taiwan (%)
Place of birth for the foreign-born population - Japan (%)
Place of birth for the foreign-born population - Korea (%)
Place of birth for the foreign-born population - Other Eastern Asia (%)
Place of birth for the foreign-born population - Afghanistan (%)
Place of birth for the foreign-born population - Bangladesh (%)
Place of birth for the foreign-born population - India (%)
Place of birth for the foreign-born population - Iran (%)
Place of birth for the foreign-born population - Kazakhstan (%)
Place of birth for the foreign-born population - Nepal (%)
Place of birth for the foreign-born population - Pakistan (%)
Place of birth for the foreign-born population - Sri Lanka (%)
Place of birth for the foreign-born population - Uzbekistan (%)
Place of birth for the foreign-born population - Other South Central Asia (%)
Place of birth for the foreign-born population - Burma (%)
Place of birth for the foreign-born population - Cambodia (%)
Place of birth for the foreign-born population - Indonesia (%)
Place of birth for the foreign-born population - Laos (%)
Place of birth for the foreign-born population - Malaysia (%)
Place of birth for the foreign-born population - Philippines (%)
Place of birth for the foreign-born population - Singapore (%)
Place of birth for the foreign-born population - Thailand (%)
Place of birth for the foreign-born population - Vietnam (%)
Place of birth for the foreign-born population - Other South Eastern Asia (%)
Place of birth for the foreign-born population - Armenia (%)
Place of birth for the foreign-born population - Iraq (%)
Place of birth for the foreign-born population - Israel (%)
Place of birth for the foreign-born population - Jordan (%)
Place of birth for the foreign-born population - Kuwait (%)
Place of birth for the foreign-born population - Lebanon (%)
Place of birth for the foreign-born population - Saudi Arabia (%)
Place of birth for the foreign-born population - Syria (%)
Place of birth for the foreign-born population - Turkey (%)
Place of birth for the foreign-born population - Yemen (%)
Place of birth for the foreign-born population - Other Western Asia (%)
Place of birth for the foreign-born population - Eritrea (%)
Place of birth for the foreign-born population - Ethiopia (%)
Place of birth for the foreign-born population - Kenya (%)
Place of birth for the foreign-born population - Somalia (%)
Place of birth for the foreign-born population - Uganda (%)
Place of birth for the foreign-born population - Zimbabwe (%)
Place of birth for the foreign-born population - Other Eastern Africa (%)
Place of birth for the foreign-born population - Cameroon (%)
Place of birth for the foreign-born population - Congo (%)
Place of birth for the foreign-born population - Democratic Republic of Congo (Zaire) (%)
Place of birth for the foreign-born population - Other Middle Africa (%)
Place of birth for the foreign-born population - Egypt (%)
Place of birth for the foreign-born population - Morocco (%)
Place of birth for the foreign-born population - Sudan (%)
Place of birth for the foreign-born population - Other Northern Africa (%)
Place of birth for the foreign-born population - South Africa (%)
Place of birth for the foreign-born population - Other Southern Africa (%)
Place of birth for the foreign-born population - Cabo Verde (%)
Place of birth for the foreign-born population - Ghana (%)
Place of birth for the foreign-born population - Liberia (%)
Place of birth for the foreign-born population - Nigeria (%)
Place of birth for the foreign-born population - Senegal (%)
Place of birth for the foreign-born population - Sierra Leone (%)
Place of birth for the foreign-born population - Other Western Africa (%)
Place of birth for the foreign-born population - Australia (%)
Place of birth for the foreign-born population - New Zealand (%)
Place of birth for the foreign-born population - Fiji (%)
Place of birth for the foreign-born population - Micronesia (%)
Place of birth for the foreign-born population - Bahamas (%)
Place of birth for the foreign-born population - Barbados (%)
Place of birth for the foreign-born population - Cuba (%)
Place of birth for the foreign-born population - Dominica (%)
Place of birth for the foreign-born population - Dominican Republic (%)
Place of birth for the foreign-born population - Grenada (%)
Place of birth for the foreign-born population - Haiti (%)
Place of birth for the foreign-born population - Jamaica (%)
Place of birth for the foreign-born population - St. Vincent and the Grenadines (%)
Place of birth for the foreign-born population - Trinidad and Tobago (%)
Place of birth for the foreign-born population - West Indies (%)
Place of birth for the foreign-born population - Other Caribbean (%)
Place of birth for the foreign-born population - Belize (%)
Place of birth for the foreign-born population - Costa Rica (%)
Place of birth for the foreign-born population - El Salvador (%)
Place of birth for the foreign-born population - Guatemala (%)
Place of birth for the foreign-born population - Honduras (%)
Place of birth for the foreign-born population - Mexico (%)
Place of birth for the foreign-born population - Nicaragua (%)
Place of birth for the foreign-born population - Panama (%)
Place of birth for the foreign-born population - Other Central America (%)
Place of birth for the foreign-born population - Argentina (%)
Place of birth for the foreign-born population - Bolivia (%)
Place of birth for the foreign-born population - Brazil (%)
Place of birth for the foreign-born population - Chile (%)
Place of birth for the foreign-born population - Colombia (%)
Place of birth for the foreign-born population - Ecuador (%)
Place of birth for the foreign-born population - Guyana (%)
Place of birth for the foreign-born population - Peru (%)
Place of birth for the foreign-born population - Uruguay (%)
Place of birth for the foreign-born population - Venezuela (%)
Place of birth for the foreign-born population - Other South America (%)
Place of birth for the foreign-born population - Canada (%)
Place of birth for the foreign-born population - Other Northern America (%)
Place of birth for the foreign-born population - Other (%)
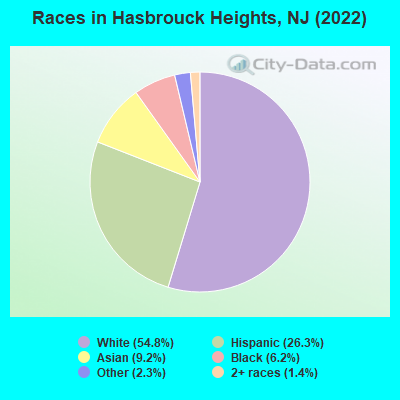
According to 2022 data, the most numerous races in Hasbrouck Heights, NJ are White alone (6,617 residents), Hispanic (3,171 residents), and Black alone (753 residents). 62.1% of Hasbrouck Heights residents speak English at home. 29.0% of Hasbrouck Heights, NJ residents are foreign-born (12.9% born in Latin America, 8.4% born in Asia, 6.2% born in Europe), which is 20.6% greater than the foreign-born rate of 23.0% across the entire state of New Jersey.
Race distribution in Hasbrouck Heights
2000 2022
5,557,209 66.0% White alone 1,117,191 13.3% Hispanic 1,096,171 13.0% Black alone 477,012 5.7% Asian alone 133,689 1.6% Two or more races 19,565 0.2% Other race alone 11,338 0.1% American Indian alone 2,175 0.03% Native Hawaiian and Other
4,766,476 51.5% White alone 2,028,470 21.9% Hispanic 1,111,632 12.0% Black alone 923,546 10.0% Asian alone 332,237 3.6% Two or more races 89,847 1.0% Other race alone 8,557 0.09% American Indian alone 934 0.01% Native Hawaiian and Other
Income and house value in Hasbrouck Heights Median household income in 2022 $115,326 White non-Hispanic householders$47,375 Black householders$149,802 Asian householders$190,955 Some other race householders$75,787 Hispanic or Latino race householdersMedian 2022 house value $498,451 White Non-Hispanic householders$641,432 Black or African American householders$476,292 American Indian or Alaska Native householders $559,096 Asian householders$589,651 Some other race householders$712,806 Two or more races householders$531,805 Hispanic or Latino householders
Median age by race in Hasbrouck Heights
47.8 Median age for White residents44.0 52.6 18.4 Median age for Black or African American residents10.2 40.0 -766,197,182.3 Median age for American Indian / Alaska Native residents-686,322,685.6 -753,722,794.2 45.8 Median age for Asian residents42.5 49.0 -510,460,250.5 Median age for Native Hawaiian / Pacific Islander residents-514,767,932.0 -713,070,378.3 36.1 Median age for Other race residents41.5 35.6 28.2 Median age for Two or more races residents37.1 18.6 50.3 Median age for White alone residents43.8 54.6 37.1 Median age for Hispanic or Latino residents35.8 37.3
Owner/renter occupied households by race in Hasbrouck Heights
House owners and renters - White residents 2,479 79.2% Owner occupied651 20.8% Renter occupiedHouse owners and renters - Black or African American residents 185 100.0% Renter occupiedHouse owners and renters - Asian residents 284 85.3% Owner occupied49 14.7% Renter occupiedHouse owners and renters - Other race residents 204 78.0% Owner occupied58 22.0% Renter occupiedHouse owners and renters - Two or more races residents 57 19.4% Owner occupied236 80.6% Renter occupiedHouse owners and renters - White alone residents 2,331 83.4% Owner occupied464 16.6% Renter occupiedHouse owners and renters - Hispanic or Latino residents 423 47.6% Owner occupied465 52.4% Renter occupied
Language usage in Hasbrouck Heights
English speakers - Total 62.1% of residents of Hasbrouck Heights speak English at home.
20.0% of residents speak Spanish at home 1,209 52.5% Speak English very well1,092 47.5% Speak English less than very well17.9% of residents speak other language at home 1,810 87.8% Speak English very well252 12.2% Speak English less than very well
English speakers - Born in the United States 87.9% of residents of Hasbrouck Heights speak English at home.
3.5% of residents speak Spanish at home 62 100.0% Speak English very well6.9% of residents speak other language at home 122 100.0% Speak English very well
English speakers - Native, born elsewhere 19.8% of residents of Hasbrouck Heights speak English at home.
65.7% of residents speak Spanish at home 82 39.2% Speak English very well127 60.8% Speak English less than very well13.8% of residents speak other language at home 44 100.0% Speak English very well
English speakers - Foreign-born 13.5% of residents of Hasbrouck Heights speak English at home.
41.9% of residents speak Spanish at home 550 38.0% Speak English very well896 62.0% Speak English less than very well45.1% of residents speak other language at home 1,352 86.8% Speak English very well205 13.2% Speak English less than very well
White (Caucasian) - Speak only English Native:
91.6% (5,533)Foreign-born:
10.7% (153)
White (Caucasian) - Speak another language Native:
8.8% (533)Foreign-born:
86.7% (1,235)
Black or African American - Speak only English Native:
95.2% (407)Foreign-born:
85.8% (130)
Black or African American - Speak another language Native:
4.7% (20)Foreign-born:
18.8% (29)
Asian - Speak only English Native:
43.4% (121)Foreign-born:
16.0% (128)
Asian - Speak another language Native:
56.5% (158)Foreign-born:
83.8% (670)
Other race - Speak another language Native:
33.8% (161)Foreign-born:
100.0% (384)
Two or more races - Speak only English Native:
45.6% (319)Foreign-born:
12.5% (49)
Two or more races - Speak another language Native:
56.0% (391)Foreign-born:
87.4% (340)
White alone - Speak only English Native:
96.0% (5,381)Foreign-born:
15.3% (130)
White alone - Speak another language Native:
4.2% (237)Foreign-born:
84.9% (721)
Hispanic or Latino - Speak only English Native:
43.0% (651)Foreign-born:
4.9% (76)
Hispanic or Latino - Speak another language Native:
56.1% (850)Foreign-born:
94.4% (1,442)
Foreign-born residents in Hasbrouck Heights 3,500 residents are foreign born (12.9% Latin America , 8.4% Asia , 6.2% Europe ).
This city:
29.0%New Jersey:
23.2%
Marital status for residents in Hasbrouck Heights Marital status - White (Caucasian) population 15 years and over
Males 38.4% Never married51.9% Now married0.7% Separated4.2% Widowed4.8% DivorcedFemales 33.7% Never married44.8% Now married0.6% Separated14.0% Widowed7.0% DivorcedWomen who gave birth in the past 12 months Now married:
77.0% (63)Unmarried:
23.0% (19)
Women who did not give birth in the past 12 months Now married:
38.3% (585)Unmarried:
61.7% (941)
Marital status - Black or African American population 15 years and over
Males 68.8% Never married19.4% Now married0.0% Separated11.0% Widowed0.8% DivorcedFemales 51.5% Never married0.0% Now married48.5% Separated0.0% Widowed0.0% DivorcedWomen who did not give birth in the past 12 months Now married:
29.3% (53)Unmarried:
70.7% (127)
Marital status - Asian population 15 years and over
Males 37.4% Never married62.6% Now married0.0% Separated0.0% Widowed0.0% DivorcedFemales 30.5% Never married67.7% Now married0.0% Separated1.8% Widowed0.0% DivorcedWomen who did not give birth in the past 12 months Now married:
53.0% (131)Unmarried:
47.0% (116)
Marital status - Other race population 15 years and over
Males 22.0% Never married66.4% Now married0.0% Separated11.7% Widowed0.0% DivorcedFemales 10.6% Never married89.4% Now married0.0% Separated0.0% Widowed0.0% DivorcedWomen who did not give birth in the past 12 months Now married:
89.4% (194)Unmarried:
10.6% (23)
Marital status - Two or more races population 15 years and over
Males 32.5% Never married47.9% Now married0.0% Separated6.5% Widowed13.0% DivorcedFemales 20.3% Never married60.8% Now married0.0% Separated0.0% Widowed18.9% DivorcedWomen who did not give birth in the past 12 months Now married:
71.4% (109)Unmarried:
28.6% (44)
Marital status - White alone, not Hispanic / Latino population 15 years and over
Males 38.6% Never married51.3% Now married0.8% Separated3.3% Widowed6.0% DivorcedFemales 27.9% Never married46.5% Now married0.7% Separated16.2% Widowed8.7% DivorcedWomen who gave birth in the past 12 months Now married:
77.0% (73)Unmarried:
23.0% (22)
Women who did not give birth in the past 12 months Now married:
39.3% (472)Unmarried:
60.7% (729)
Marital status - Hispanic or Latino population 15 years and over
Males 29.1% Never married58.3% Now married0.0% Separated8.9% Widowed3.7% DivorcedFemales 47.3% Never married46.4% Now married0.0% Separated3.8% Widowed2.6% DivorcedWomen who did not give birth in the past 12 months Now married:
44.9% (356)Unmarried:
55.1% (436)
Ancestries in Hasbrouck Heights
1,472 21.7% Italian550 8.1% Irish329 4.8% American282 4.2% Jamaican247 3.6% German185 2.7% Polish158 2.3% Jordanian81 1.2% Ukrainian78 1.1% Czech76 1.1% Armenian53 0.8% Slovak43 0.6% African39 0.6% Lebanese38 0.6% Eastern European38 0.6% English38 0.6% Portuguese37 0.5% Egyptian25 0.4% Latvian22 0.3% Canadian20 0.3% Finnish16 0.2% Dutch14 0.2% Scandinavian12 0.2% European10 0.1% Scotch-Irish9 0.1% Scottish
Children Nativity (place of birth) in Hasbrouck Heights
Children under 6 years - Living with two parents Both parents native 150 100.0% NativeBoth parents foreign-born 150 75.7% Native48 24.3% Foreign-bornOne native, one foreign-born parent 82 100.0% NativeChildren under 6 years - Living with one parent Native parent 34 100.0% NativeForeign-born parent 163 100.0% NativeChildren 6 to 17 years - Living with two parents Both parents native 760 96.7% Native26 3.3% Foreign-bornBoth parents foreign-born 278 69.1% Native124 30.9% Foreign-bornOne native, one foreign-born parent 128 86.9% Native19 13.1% Foreign-bornChildren 6 to 17 years - Living with one parent Native parent 200 83.7% Native39 16.3% Foreign-bornForeign-born parent 160 74.7% Native54 25.3% Foreign-born
Grandparents responsible for own grandchildren in Hasbrouck Heights
Grandparents (30 to 59 years) White / Caucasian 48 100.0% Not responsible for grandchildrenWhite alone, not Hispanic / Latino 58 100.0% Not responsible for grandchildrenGrandparents (60 years and over) White / Caucasian 50 35.5% Responsible for grandchildren91 64.5% Not responsible for grandchildrenWhite alone, not Hispanic / Latino 69 86.4% Responsible for grandchildren11 13.6% Not responsible for grandchildren