Races in Harvey, Illinois (IL) Detailed Stats
Data:
Races - White alone (%)
Races - White alone (% change since 2000)
Races - Black alone (%)
Races - Black alone (% change since 2000)
Races - American Indian alone (%)
Races - American Indian alone (% change since 2000)
Races - Asian alone (%)
Races - Asian alone (% change since 2000)
Races - Hispanic (%)
Races - Hispanic (% change since 2000)
Races - Native Hawaiian and Other Pacific Islander alone (%)
Races - Native Hawaiian and Other Pacific Islander alone (% change since 2000)
Races - Two or more races(%)
Races - Two or more races(% change since 2000)
Races - Other race alone (%)
Races - Other race alone (% change since 2000)
Racial diversity
Place of birth - Born in state of residence (%)
Place of birth - Born in state of residence (%) - White
Place of birth - Born in state of residence (%) - Black or African American
Place of birth - Born in state of residence (%) - Asian
Place of birth - Born in state of residence (%) - Hispanic or Latino
Place of birth - Born in state of residence (%) - American Indian and Alaska Native
Place of birth - Born in state of residence (%) - Multirace
Place of birth - Born in state of residence (%) - Other Race
Place of birth - Born in other state (%)
Place of birth - Born in other state (%) - White
Place of birth - Born in other state (%) - Black or African American
Place of birth - Born in other state (%) - Asian
Place of birth - Born in other state (%) - Hispanic or Latino
Place of birth - Born in other state (%) - American Indian and Alaska Native
Place of birth - Born in other state (%) - Multirace
Place of birth - Born in other state (%) - Other Race
Place of birth - Native, outside of US (%)
Place of birth - Native, outside of US (%) - White
Place of birth - Native, outside of US (%) - Black or African American
Place of birth - Native, outside of US (%) - Asian
Place of birth - Native, outside of US (%) - Hispanic or Latino
Place of birth - Native, outside of US (%) - American Indian and Alaska Native
Place of birth - Native, outside of US (%) - Multirace
Place of birth - Native, outside of US (%) - Other Race
Place of birth - Foreign born (%)
Place of birth - Foreign born (%) - White
Place of birth - Foreign born (%) - Black or African American
Place of birth - Foreign born (%) - Asian
Place of birth - Foreign born (%) - Hispanic or Latino
Place of birth - Foreign born (%) - American Indian and Alaska Native
Place of birth - Foreign born (%) - Multirace
Place of birth - Foreign born (%) - Other Race
Residents speaking English at home (%)
Residents speaking English at home - Born in the United States (%)
Residents speaking English at home - Native, born elsewhere (%)
Residents speaking English at home - Foreign born (%)
Residents speaking Spanish at home (%)
Residents speaking Spanish at home - Born in the United States (%)
Residents speaking Spanish at home - Native, born elsewhere (%)
Residents speaking Spanish at home - Foreign born (%)
Residents speaking other language at home (%)
Residents speaking other language at home - Born in the United States (%)
Residents speaking other language at home - Native, born elsewhere (%)
Residents speaking other language at home - Foreign born (%)
Marital status - Never married (%)
Marital status - Now married (%)
Marital status - Separated (%)
Marital status - Widowed (%)
Marital status - Divorced (%)
Ancestries Reported - Arab (%)
Ancestries Reported - Czech (%)
Ancestries Reported - Danish (%)
Ancestries Reported - Dutch (%)
Ancestries Reported - English (%)
Ancestries Reported - French (%)
Ancestries Reported - French Canadian (%)
Ancestries Reported - German (%)
Ancestries Reported - Greek (%)
Ancestries Reported - Hungarian (%)
Ancestries Reported - Irish (%)
Ancestries Reported - Italian (%)
Ancestries Reported - Lithuanian (%)
Ancestries Reported - Norwegian (%)
Ancestries Reported - Polish (%)
Ancestries Reported - Portuguese (%)
Ancestries Reported - Russian (%)
Ancestries Reported - Scotch-Irish (%)
Ancestries Reported - Scottish (%)
Ancestries Reported - Slovak (%)
Ancestries Reported - Subsaharan African (%)
Ancestries Reported - Swedish (%)
Ancestries Reported - Swiss (%)
Ancestries Reported - Ukrainian (%)
Ancestries Reported - United States (%)
Ancestries Reported - Welsh (%)
Ancestries Reported - West Indian (%)
Ancestries Reported - Other (%)
Geographical mobility - Same house 1 year ago (%)
Geographical mobility - Same house 1 year ago (%) - White
Geographical mobility - Same house 1 year ago (%) - Black or African American
Geographical mobility - Same house 1 year ago (%) - Asian
Geographical mobility - Same house 1 year ago (%) - Hispanic or Latino
Geographical mobility - Same house 1 year ago (%) - American Indian and Alaska Native
Geographical mobility - Same house 1 year ago (%) - Multirace
Geographical mobility - Same house 1 year ago (%) - Other Race
Geographical mobility - Moved within same county (%)
Geographical mobility - Moved within same county (%) - White
Geographical mobility - Moved within same county (%) - Black or African American
Geographical mobility - Moved within same county (%) - Asian
Geographical mobility - Moved within same county (%) - Hispanic or Latino
Geographical mobility - Moved within same county (%) - American Indian and Alaska Native
Geographical mobility - Moved within same county (%) - Multirace
Geographical mobility - Moved within same county (%) - Other Race
Geographical mobility - Moved from different county within same state (%)
Geographical mobility - Moved from different county within same state (%) - White
Geographical mobility - Moved from different county within same state (%) - Black or African American
Geographical mobility - Moved from different county within same state (%) - Asian
Geographical mobility - Moved from different county within same state (%) - Hispanic or Latino
Geographical mobility - Moved from different county within same state (%) - American Indian and Alaska Native
Geographical mobility - Moved from different county within same state (%) - Multirace
Geographical mobility - Moved from different county within same state (%) - Other Race
Geographical mobility - Moved from different state (%)
Geographical mobility - Moved from different state (%) - White
Geographical mobility - Moved from different state (%) - Black or African American
Geographical mobility - Moved from different state (%) - Asian
Geographical mobility - Moved from different state (%) - Hispanic or Latino
Geographical mobility - Moved from different state (%) - American Indian and Alaska Native
Geographical mobility - Moved from different state (%) - Multirace
Geographical mobility - Moved from different state (%) - Other Race
Geographical mobility - Moved from abroad (%)
Geographical mobility - Moved from abroad (%) - White
Geographical mobility - Moved from abroad (%) - Black or African American
Geographical mobility - Moved from abroad (%) - Asian
Geographical mobility - Moved from abroad (%) - Hispanic or Latino
Geographical mobility - Moved from abroad (%) - American Indian and Alaska Native
Geographical mobility - Moved from abroad (%) - Multirace
Geographical mobility - Moved from abroad (%) - Other Race
Place of birth for the foreign-born population - Ireland (%)
Place of birth for the foreign-born population - Denmark (%)
Place of birth for the foreign-born population - Norway (%)
Place of birth for the foreign-born population - Sweden (%)
Place of birth for the foreign-born population - United Kingdom (%)
Place of birth for the foreign-born population - England (%)
Place of birth for the foreign-born population - Scotland (%)
Place of birth for the foreign-born population - Other Northern Europe (%)
Place of birth for the foreign-born population - Austria (%)
Place of birth for the foreign-born population - Belgium (%)
Place of birth for the foreign-born population - France (%)
Place of birth for the foreign-born population - Germany (%)
Place of birth for the foreign-born population - Netherlands (%)
Place of birth for the foreign-born population - Switzerland (%)
Place of birth for the foreign-born population - Other Western Europe (%)
Place of birth for the foreign-born population - Greece (%)
Place of birth for the foreign-born population - Italy (%)
Place of birth for the foreign-born population - Portugal (%)
Place of birth for the foreign-born population - Spain (%)
Place of birth for the foreign-born population - Other Southern Europe (%)
Place of birth for the foreign-born population - Albania (%)
Place of birth for the foreign-born population - Belarus (%)
Place of birth for the foreign-born population - Bosnia and Herzegovina (%)
Place of birth for the foreign-born population - Bulgaria (%)
Place of birth for the foreign-born population - Croatia (%)
Place of birth for the foreign-born population - Czechoslovakia (%)
Place of birth for the foreign-born population - Hungary (%)
Place of birth for the foreign-born population - Latvia (%)
Place of birth for the foreign-born population - Lithuania (%)
Place of birth for the foreign-born population - North Macedonia (Macedonia) (%)
Place of birth for the foreign-born population - Moldova (%)
Place of birth for the foreign-born population - Poland (%)
Place of birth for the foreign-born population - Romania (%)
Place of birth for the foreign-born population - Russia (%)
Place of birth for the foreign-born population - Serbia (%)
Place of birth for the foreign-born population - Ukraine (%)
Place of birth for the foreign-born population - Other Eastern Europe (%)
Place of birth for the foreign-born population - China (%)
Place of birth for the foreign-born population - Hong Kong (%)
Place of birth for the foreign-born population - Taiwan (%)
Place of birth for the foreign-born population - Japan (%)
Place of birth for the foreign-born population - Korea (%)
Place of birth for the foreign-born population - Other Eastern Asia (%)
Place of birth for the foreign-born population - Afghanistan (%)
Place of birth for the foreign-born population - Bangladesh (%)
Place of birth for the foreign-born population - India (%)
Place of birth for the foreign-born population - Iran (%)
Place of birth for the foreign-born population - Kazakhstan (%)
Place of birth for the foreign-born population - Nepal (%)
Place of birth for the foreign-born population - Pakistan (%)
Place of birth for the foreign-born population - Sri Lanka (%)
Place of birth for the foreign-born population - Uzbekistan (%)
Place of birth for the foreign-born population - Other South Central Asia (%)
Place of birth for the foreign-born population - Burma (%)
Place of birth for the foreign-born population - Cambodia (%)
Place of birth for the foreign-born population - Indonesia (%)
Place of birth for the foreign-born population - Laos (%)
Place of birth for the foreign-born population - Malaysia (%)
Place of birth for the foreign-born population - Philippines (%)
Place of birth for the foreign-born population - Singapore (%)
Place of birth for the foreign-born population - Thailand (%)
Place of birth for the foreign-born population - Vietnam (%)
Place of birth for the foreign-born population - Other South Eastern Asia (%)
Place of birth for the foreign-born population - Armenia (%)
Place of birth for the foreign-born population - Iraq (%)
Place of birth for the foreign-born population - Israel (%)
Place of birth for the foreign-born population - Jordan (%)
Place of birth for the foreign-born population - Kuwait (%)
Place of birth for the foreign-born population - Lebanon (%)
Place of birth for the foreign-born population - Saudi Arabia (%)
Place of birth for the foreign-born population - Syria (%)
Place of birth for the foreign-born population - Turkey (%)
Place of birth for the foreign-born population - Yemen (%)
Place of birth for the foreign-born population - Other Western Asia (%)
Place of birth for the foreign-born population - Eritrea (%)
Place of birth for the foreign-born population - Ethiopia (%)
Place of birth for the foreign-born population - Kenya (%)
Place of birth for the foreign-born population - Somalia (%)
Place of birth for the foreign-born population - Uganda (%)
Place of birth for the foreign-born population - Zimbabwe (%)
Place of birth for the foreign-born population - Other Eastern Africa (%)
Place of birth for the foreign-born population - Cameroon (%)
Place of birth for the foreign-born population - Congo (%)
Place of birth for the foreign-born population - Democratic Republic of Congo (Zaire) (%)
Place of birth for the foreign-born population - Other Middle Africa (%)
Place of birth for the foreign-born population - Egypt (%)
Place of birth for the foreign-born population - Morocco (%)
Place of birth for the foreign-born population - Sudan (%)
Place of birth for the foreign-born population - Other Northern Africa (%)
Place of birth for the foreign-born population - South Africa (%)
Place of birth for the foreign-born population - Other Southern Africa (%)
Place of birth for the foreign-born population - Cabo Verde (%)
Place of birth for the foreign-born population - Ghana (%)
Place of birth for the foreign-born population - Liberia (%)
Place of birth for the foreign-born population - Nigeria (%)
Place of birth for the foreign-born population - Senegal (%)
Place of birth for the foreign-born population - Sierra Leone (%)
Place of birth for the foreign-born population - Other Western Africa (%)
Place of birth for the foreign-born population - Australia (%)
Place of birth for the foreign-born population - New Zealand (%)
Place of birth for the foreign-born population - Fiji (%)
Place of birth for the foreign-born population - Micronesia (%)
Place of birth for the foreign-born population - Bahamas (%)
Place of birth for the foreign-born population - Barbados (%)
Place of birth for the foreign-born population - Cuba (%)
Place of birth for the foreign-born population - Dominica (%)
Place of birth for the foreign-born population - Dominican Republic (%)
Place of birth for the foreign-born population - Grenada (%)
Place of birth for the foreign-born population - Haiti (%)
Place of birth for the foreign-born population - Jamaica (%)
Place of birth for the foreign-born population - St. Vincent and the Grenadines (%)
Place of birth for the foreign-born population - Trinidad and Tobago (%)
Place of birth for the foreign-born population - West Indies (%)
Place of birth for the foreign-born population - Other Caribbean (%)
Place of birth for the foreign-born population - Belize (%)
Place of birth for the foreign-born population - Costa Rica (%)
Place of birth for the foreign-born population - El Salvador (%)
Place of birth for the foreign-born population - Guatemala (%)
Place of birth for the foreign-born population - Honduras (%)
Place of birth for the foreign-born population - Mexico (%)
Place of birth for the foreign-born population - Nicaragua (%)
Place of birth for the foreign-born population - Panama (%)
Place of birth for the foreign-born population - Other Central America (%)
Place of birth for the foreign-born population - Argentina (%)
Place of birth for the foreign-born population - Bolivia (%)
Place of birth for the foreign-born population - Brazil (%)
Place of birth for the foreign-born population - Chile (%)
Place of birth for the foreign-born population - Colombia (%)
Place of birth for the foreign-born population - Ecuador (%)
Place of birth for the foreign-born population - Guyana (%)
Place of birth for the foreign-born population - Peru (%)
Place of birth for the foreign-born population - Uruguay (%)
Place of birth for the foreign-born population - Venezuela (%)
Place of birth for the foreign-born population - Other South America (%)
Place of birth for the foreign-born population - Canada (%)
Place of birth for the foreign-born population - Other Northern America (%)
Place of birth for the foreign-born population - Other (%)
Latest news about races in Harvey, IL collected exclusively by city-data.com from local newspapers, TV, and radio stations
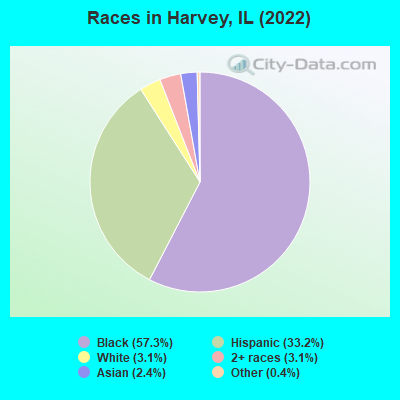
According to 2022 data, the most numerous races in Harvey, IL are White alone (616 residents), Hispanic (6,511 residents), and Black alone (11,230 residents). 68.4% of Harvey residents speak English at home. 17.1% of Harvey, IL residents are foreign-born (14.9% born in Latin America), which is 18.3% greater than the foreign-born rate of 14.0% across the entire state of Illinois.
Race distribution in Harvey
2000 2022
8,424,140 67.8% White alone 1,856,152 14.9% Black alone 1,530,262 12.3% Hispanic 419,916 3.4% Asian alone 153,996 1.2% Two or more races 13,479 0.1% Other race alone 18,232 0.1% American Indian alone 3,116 0.03% Native Hawaiian and Other
7,356,301 58.5% White alone 2,299,726 18.3% Hispanic 1,660,423 13.2% Black alone 747,296 5.9% Asian alone 458,599 3.6% Two or more races 45,386 0.4% Other race alone 10,405 0.08% American Indian alone 3,896 0.03% Native Hawaiian and Other
Income and house value in Harvey Median household income in 2022 $39,088 White non-Hispanic householders$32,999 Black householders$133,970 Asian householders$65,550 Some other race householders$79,012 Two or more races householders$68,780 Hispanic or Latino race householdersMedian 2022 house value $84,480 White Non-Hispanic householders$91,855 Black or African American householders$177,888 American Indian or Alaska Native householders $58,218 Asian householders$113,201 Some other race householders$94,313 Two or more races householders$106,603 Hispanic or Latino householders
Median age by race in Harvey
29.7 Median age for White residents29.3 29.9 44.1 Median age for Black or African American residents43.3 46.6 -680,473,372.1 Median age for American Indian / Alaska Native residents-736,736,736.0 -641,399,416.3 36.1 Median age for Asian residents42.3 30.5 -687,999,999.3 Median age for Native Hawaiian / Pacific Islander residents-918,721,460.3 -610,229,276.3 27.5 Median age for Other race residents31.4 27.2 26.9 Median age for Two or more races residents27.9 24.4 52.6 Median age for White alone residents39.3 63.1 27.4 Median age for Hispanic or Latino residents27.3 27.4
Owner/renter occupied households by race in Harvey
House owners and renters - White residents 552 63.3% Owner occupied320 36.7% Renter occupiedHouse owners and renters - Black or African American residents 2,135 41.8% Owner occupied2,974 58.2% Renter occupiedHouse owners and renters - Asian residents 103 81.6% Owner occupied23 18.4% Renter occupiedHouse owners and renters - Other race residents 686 85.8% Owner occupied113 14.2% Renter occupiedHouse owners and renters - Two or more races residents 359 51.3% Owner occupied341 48.7% Renter occupiedHouse owners and renters - White alone residents 222 80.3% Owner occupied54 19.7% Renter occupiedHouse owners and renters - Hispanic or Latino residents 1,208 67.8% Owner occupied574 32.2% Renter occupied
Language usage in Harvey
English speakers - Total 68.4% of residents of Harvey speak English at home.
27.7% of residents speak Spanish at home 2,734 52.7% Speak English very well2,457 47.3% Speak English less than very well3.8% of residents speak other language at home 420 59.2% Speak English very well289 40.8% Speak English less than very well
English speakers - Born in the United States 84.8% of residents of Harvey speak English at home.
13.6% of residents speak Spanish at home 272 81.2% Speak English very well63 18.8% Speak English less than very well0.9% of residents speak other language at home 22 100.0% Speak English very well
English speakers - Native, born elsewhere 19.2% of residents of Harvey speak English at home.
88.5% of residents speak other language at home 46 100.0% Speak English less than very well
English speakers - Foreign-born 7.8% of residents of Harvey speak English at home.
81.4% of residents speak Spanish at home 585 21.9% Speak English very well2,090 78.1% Speak English less than very well11.6% of residents speak other language at home 137 36.0% Speak English very well244 64.0% Speak English less than very well
White (Caucasian) - Speak only English Native:
58.5% (828)Foreign-born:
9.9% (77)
White (Caucasian) - Speak another language Native:
32.8% (464)Foreign-born:
89.8% (699)
Black or African American - Speak only English Native:
98.8% (10,801)Foreign-born:
66.8% (72)
Black or African American - Speak another language Native:
1.1% (124)Foreign-born:
40.1% (43)
Asian - Speak only English Native:
16.4% (28)Foreign-born:
3.9% (11)
Asian - Speak another language Native:
83.3% (144)Foreign-born:
97.1% (267)
Other race - Speak only English Native:
12.4% (223)Foreign-born:
9.3% (97)
Other race - Speak another language Native:
86.6% (1,563)Foreign-born:
90.1% (942)
Two or more races - Speak only English Native:
49.9% (763)Foreign-born:
1.1% (16)
Two or more races - Speak another language Native:
50.5% (772)Foreign-born:
98.9% (1,413)
White alone - Speak only English Native:
91.9% (477)Foreign-born:
18.6% (10)
White alone - Speak another language Native:
8.1% (42)Foreign-born:
81.0% (43)
Hispanic or Latino - Speak only English Native:
28.6% (934)Foreign-born:
6.0% (170)
Hispanic or Latino - Speak another language Native:
71.2% (2,325)Foreign-born:
93.8% (2,674)
Foreign-born residents in Harvey 3,356 residents are foreign born (14.9% Latin America ).
This city:
17.1%Illinois:
14.1%
Marital status for residents in Harvey Marital status - White (Caucasian) population 15 years and over
Males 48.2% Never married43.1% Now married0.0% Separated0.8% Widowed7.9% DivorcedFemales 43.4% Never married43.8% Now married4.3% Separated5.4% Widowed3.1% DivorcedWomen who gave birth in the past 12 months Now married:
0.0% (0)Unmarried:
100.0% (30)
Women who did not give birth in the past 12 months Now married:
48.3% (370)Unmarried:
51.7% (396)
Marital status - Black or African American population 15 years and over
Males 53.1% Never married24.1% Now married5.7% Separated4.8% Widowed12.3% DivorcedFemales 51.9% Never married20.6% Now married2.7% Separated11.2% Widowed13.5% DivorcedWomen who gave birth in the past 12 months Now married:
5.2% (13)Unmarried:
94.8% (240)
Women who did not give birth in the past 12 months Now married:
17.2% (411)Unmarried:
82.8% (1,978)
Marital status - Asian population 15 years and over
Males 25.8% Never married74.2% Now married0.0% Separated0.0% Widowed0.0% DivorcedFemales 26.2% Never married73.8% Now married0.0% Separated0.0% Widowed0.0% DivorcedWomen who gave birth in the past 12 months Now married:
100.0% (15)Unmarried:
0.0% (0)
Women who did not give birth in the past 12 months Now married:
67.1% (109)Unmarried:
32.9% (54)
Marital status - Other race population 15 years and over
Males 37.0% Never married48.1% Now married8.7% Separated0.0% Widowed6.2% DivorcedFemales 45.8% Never married39.0% Now married0.0% Separated0.0% Widowed15.2% DivorcedWomen who gave birth in the past 12 months Now married:
0.0% (0)Unmarried:
100.0% (46)
Women who did not give birth in the past 12 months Now married:
37.2% (302)Unmarried:
62.8% (509)
Marital status - Two or more races population 15 years and over
Males 54.0% Never married35.8% Now married2.3% Separated0.0% Widowed7.9% DivorcedFemales 45.3% Never married40.8% Now married5.5% Separated6.2% Widowed2.0% DivorcedWomen who gave birth in the past 12 months Now married:
100.0% (51)Unmarried:
0.0% (0)
Women who did not give birth in the past 12 months Now married:
36.6% (250)Unmarried:
63.4% (433)
Marital status - White alone, not Hispanic / Latino population 15 years and over
Males 59.9% Never married27.2% Now married0.0% Separated2.4% Widowed10.4% DivorcedFemales 22.5% Never married36.3% Now married4.5% Separated22.8% Widowed13.9% DivorcedWomen who did not give birth in the past 12 months Now married:
80.7% (64)Unmarried:
19.3% (15)
Marital status - Hispanic or Latino population 15 years and over
Males 44.9% Never married45.4% Now married4.2% Separated0.0% Widowed5.6% DivorcedFemales 48.1% Never married43.3% Now married2.0% Separated1.1% Widowed5.5% DivorcedWomen who gave birth in the past 12 months Now married:
17.4% (16)Unmarried:
82.6% (76)
Women who did not give birth in the past 12 months Now married:
40.4% (769)Unmarried:
59.6% (1,133)
Ancestries in Harvey
247 1.7% American108 0.8% Haitian84 0.6% Irish83 0.6% African53 0.4% Polish33 0.2% Jamaican31 0.2% Syrian19 0.1% German16 0.1% Italian7 0.05% Jordanian5 0.04% Swedish4 0.03% Arab2 0.01% English
Children Nativity (place of birth) in Harvey
Children under 6 years - Living with two parents Both parents native 232 100.0% NativeBoth parents foreign-born 106 64.6% Native58 35.4% Foreign-bornOne native, one foreign-born parent 39 100.0% NativeChildren under 6 years - Living with one parent Native parent 581 100.0% NativeForeign-born parent 121 100.0% NativeChildren 6 to 17 years - Living with two parents Both parents native 593 100.0% NativeBoth parents foreign-born 452 75.7% Native145 24.3% Foreign-bornOne native, one foreign-born parent 195 100.0% NativeChildren 6 to 17 years - Living with one parent Native parent 1,513 100.0% NativeForeign-born parent 457 52.0% Native422 48.0% Foreign-born
Grandparents responsible for own grandchildren in Harvey
Grandparents (30 to 59 years) White / Caucasian 33 83.3% Responsible for grandchildren7 16.7% Not responsible for grandchildrenBlack or African American 34 21.0% Responsible for grandchildren128 79.0% Not responsible for grandchildrenOther race 154 100.0% Not responsible for grandchildrenTwo or more races 37 66.4% Responsible for grandchildren19 33.6% Not responsible for grandchildrenHispanic or Latino 55 26.8% Responsible for grandchildren150 73.2% Not responsible for grandchildrenGrandparents (60 years and over) Black or African American 44 23.6% Responsible for grandchildren142 76.4% Not responsible for grandchildrenOther race 7 100.0% Not responsible for grandchildrenHispanic or Latino 7 100.0% Not responsible for grandchildren