Races in Gurnee, Illinois (IL) Detailed Stats
Data:
Races - White alone (%)
Races - White alone (% change since 2000)
Races - Black alone (%)
Races - Black alone (% change since 2000)
Races - American Indian alone (%)
Races - American Indian alone (% change since 2000)
Races - Asian alone (%)
Races - Asian alone (% change since 2000)
Races - Hispanic (%)
Races - Hispanic (% change since 2000)
Races - Native Hawaiian and Other Pacific Islander alone (%)
Races - Native Hawaiian and Other Pacific Islander alone (% change since 2000)
Races - Two or more races(%)
Races - Two or more races(% change since 2000)
Races - Other race alone (%)
Races - Other race alone (% change since 2000)
Racial diversity
Place of birth - Born in state of residence (%)
Place of birth - Born in state of residence (%) - White
Place of birth - Born in state of residence (%) - Black or African American
Place of birth - Born in state of residence (%) - Asian
Place of birth - Born in state of residence (%) - Hispanic or Latino
Place of birth - Born in state of residence (%) - American Indian and Alaska Native
Place of birth - Born in state of residence (%) - Multirace
Place of birth - Born in state of residence (%) - Other Race
Place of birth - Born in other state (%)
Place of birth - Born in other state (%) - White
Place of birth - Born in other state (%) - Black or African American
Place of birth - Born in other state (%) - Asian
Place of birth - Born in other state (%) - Hispanic or Latino
Place of birth - Born in other state (%) - American Indian and Alaska Native
Place of birth - Born in other state (%) - Multirace
Place of birth - Born in other state (%) - Other Race
Place of birth - Native, outside of US (%)
Place of birth - Native, outside of US (%) - White
Place of birth - Native, outside of US (%) - Black or African American
Place of birth - Native, outside of US (%) - Asian
Place of birth - Native, outside of US (%) - Hispanic or Latino
Place of birth - Native, outside of US (%) - American Indian and Alaska Native
Place of birth - Native, outside of US (%) - Multirace
Place of birth - Native, outside of US (%) - Other Race
Place of birth - Foreign born (%)
Place of birth - Foreign born (%) - White
Place of birth - Foreign born (%) - Black or African American
Place of birth - Foreign born (%) - Asian
Place of birth - Foreign born (%) - Hispanic or Latino
Place of birth - Foreign born (%) - American Indian and Alaska Native
Place of birth - Foreign born (%) - Multirace
Place of birth - Foreign born (%) - Other Race
Residents speaking English at home (%)
Residents speaking English at home - Born in the United States (%)
Residents speaking English at home - Native, born elsewhere (%)
Residents speaking English at home - Foreign born (%)
Residents speaking Spanish at home (%)
Residents speaking Spanish at home - Born in the United States (%)
Residents speaking Spanish at home - Native, born elsewhere (%)
Residents speaking Spanish at home - Foreign born (%)
Residents speaking other language at home (%)
Residents speaking other language at home - Born in the United States (%)
Residents speaking other language at home - Native, born elsewhere (%)
Residents speaking other language at home - Foreign born (%)
Marital status - Never married (%)
Marital status - Now married (%)
Marital status - Separated (%)
Marital status - Widowed (%)
Marital status - Divorced (%)
Ancestries Reported - Arab (%)
Ancestries Reported - Czech (%)
Ancestries Reported - Danish (%)
Ancestries Reported - Dutch (%)
Ancestries Reported - English (%)
Ancestries Reported - French (%)
Ancestries Reported - French Canadian (%)
Ancestries Reported - German (%)
Ancestries Reported - Greek (%)
Ancestries Reported - Hungarian (%)
Ancestries Reported - Irish (%)
Ancestries Reported - Italian (%)
Ancestries Reported - Lithuanian (%)
Ancestries Reported - Norwegian (%)
Ancestries Reported - Polish (%)
Ancestries Reported - Portuguese (%)
Ancestries Reported - Russian (%)
Ancestries Reported - Scotch-Irish (%)
Ancestries Reported - Scottish (%)
Ancestries Reported - Slovak (%)
Ancestries Reported - Subsaharan African (%)
Ancestries Reported - Swedish (%)
Ancestries Reported - Swiss (%)
Ancestries Reported - Ukrainian (%)
Ancestries Reported - United States (%)
Ancestries Reported - Welsh (%)
Ancestries Reported - West Indian (%)
Ancestries Reported - Other (%)
Geographical mobility - Same house 1 year ago (%)
Geographical mobility - Same house 1 year ago (%) - White
Geographical mobility - Same house 1 year ago (%) - Black or African American
Geographical mobility - Same house 1 year ago (%) - Asian
Geographical mobility - Same house 1 year ago (%) - Hispanic or Latino
Geographical mobility - Same house 1 year ago (%) - American Indian and Alaska Native
Geographical mobility - Same house 1 year ago (%) - Multirace
Geographical mobility - Same house 1 year ago (%) - Other Race
Geographical mobility - Moved within same county (%)
Geographical mobility - Moved within same county (%) - White
Geographical mobility - Moved within same county (%) - Black or African American
Geographical mobility - Moved within same county (%) - Asian
Geographical mobility - Moved within same county (%) - Hispanic or Latino
Geographical mobility - Moved within same county (%) - American Indian and Alaska Native
Geographical mobility - Moved within same county (%) - Multirace
Geographical mobility - Moved within same county (%) - Other Race
Geographical mobility - Moved from different county within same state (%)
Geographical mobility - Moved from different county within same state (%) - White
Geographical mobility - Moved from different county within same state (%) - Black or African American
Geographical mobility - Moved from different county within same state (%) - Asian
Geographical mobility - Moved from different county within same state (%) - Hispanic or Latino
Geographical mobility - Moved from different county within same state (%) - American Indian and Alaska Native
Geographical mobility - Moved from different county within same state (%) - Multirace
Geographical mobility - Moved from different county within same state (%) - Other Race
Geographical mobility - Moved from different state (%)
Geographical mobility - Moved from different state (%) - White
Geographical mobility - Moved from different state (%) - Black or African American
Geographical mobility - Moved from different state (%) - Asian
Geographical mobility - Moved from different state (%) - Hispanic or Latino
Geographical mobility - Moved from different state (%) - American Indian and Alaska Native
Geographical mobility - Moved from different state (%) - Multirace
Geographical mobility - Moved from different state (%) - Other Race
Geographical mobility - Moved from abroad (%)
Geographical mobility - Moved from abroad (%) - White
Geographical mobility - Moved from abroad (%) - Black or African American
Geographical mobility - Moved from abroad (%) - Asian
Geographical mobility - Moved from abroad (%) - Hispanic or Latino
Geographical mobility - Moved from abroad (%) - American Indian and Alaska Native
Geographical mobility - Moved from abroad (%) - Multirace
Geographical mobility - Moved from abroad (%) - Other Race
Place of birth for the foreign-born population - Ireland (%)
Place of birth for the foreign-born population - Denmark (%)
Place of birth for the foreign-born population - Norway (%)
Place of birth for the foreign-born population - Sweden (%)
Place of birth for the foreign-born population - United Kingdom (%)
Place of birth for the foreign-born population - England (%)
Place of birth for the foreign-born population - Scotland (%)
Place of birth for the foreign-born population - Other Northern Europe (%)
Place of birth for the foreign-born population - Austria (%)
Place of birth for the foreign-born population - Belgium (%)
Place of birth for the foreign-born population - France (%)
Place of birth for the foreign-born population - Germany (%)
Place of birth for the foreign-born population - Netherlands (%)
Place of birth for the foreign-born population - Switzerland (%)
Place of birth for the foreign-born population - Other Western Europe (%)
Place of birth for the foreign-born population - Greece (%)
Place of birth for the foreign-born population - Italy (%)
Place of birth for the foreign-born population - Portugal (%)
Place of birth for the foreign-born population - Spain (%)
Place of birth for the foreign-born population - Other Southern Europe (%)
Place of birth for the foreign-born population - Albania (%)
Place of birth for the foreign-born population - Belarus (%)
Place of birth for the foreign-born population - Bosnia and Herzegovina (%)
Place of birth for the foreign-born population - Bulgaria (%)
Place of birth for the foreign-born population - Croatia (%)
Place of birth for the foreign-born population - Czechoslovakia (%)
Place of birth for the foreign-born population - Hungary (%)
Place of birth for the foreign-born population - Latvia (%)
Place of birth for the foreign-born population - Lithuania (%)
Place of birth for the foreign-born population - North Macedonia (Macedonia) (%)
Place of birth for the foreign-born population - Moldova (%)
Place of birth for the foreign-born population - Poland (%)
Place of birth for the foreign-born population - Romania (%)
Place of birth for the foreign-born population - Russia (%)
Place of birth for the foreign-born population - Serbia (%)
Place of birth for the foreign-born population - Ukraine (%)
Place of birth for the foreign-born population - Other Eastern Europe (%)
Place of birth for the foreign-born population - China (%)
Place of birth for the foreign-born population - Hong Kong (%)
Place of birth for the foreign-born population - Taiwan (%)
Place of birth for the foreign-born population - Japan (%)
Place of birth for the foreign-born population - Korea (%)
Place of birth for the foreign-born population - Other Eastern Asia (%)
Place of birth for the foreign-born population - Afghanistan (%)
Place of birth for the foreign-born population - Bangladesh (%)
Place of birth for the foreign-born population - India (%)
Place of birth for the foreign-born population - Iran (%)
Place of birth for the foreign-born population - Kazakhstan (%)
Place of birth for the foreign-born population - Nepal (%)
Place of birth for the foreign-born population - Pakistan (%)
Place of birth for the foreign-born population - Sri Lanka (%)
Place of birth for the foreign-born population - Uzbekistan (%)
Place of birth for the foreign-born population - Other South Central Asia (%)
Place of birth for the foreign-born population - Burma (%)
Place of birth for the foreign-born population - Cambodia (%)
Place of birth for the foreign-born population - Indonesia (%)
Place of birth for the foreign-born population - Laos (%)
Place of birth for the foreign-born population - Malaysia (%)
Place of birth for the foreign-born population - Philippines (%)
Place of birth for the foreign-born population - Singapore (%)
Place of birth for the foreign-born population - Thailand (%)
Place of birth for the foreign-born population - Vietnam (%)
Place of birth for the foreign-born population - Other South Eastern Asia (%)
Place of birth for the foreign-born population - Armenia (%)
Place of birth for the foreign-born population - Iraq (%)
Place of birth for the foreign-born population - Israel (%)
Place of birth for the foreign-born population - Jordan (%)
Place of birth for the foreign-born population - Kuwait (%)
Place of birth for the foreign-born population - Lebanon (%)
Place of birth for the foreign-born population - Saudi Arabia (%)
Place of birth for the foreign-born population - Syria (%)
Place of birth for the foreign-born population - Turkey (%)
Place of birth for the foreign-born population - Yemen (%)
Place of birth for the foreign-born population - Other Western Asia (%)
Place of birth for the foreign-born population - Eritrea (%)
Place of birth for the foreign-born population - Ethiopia (%)
Place of birth for the foreign-born population - Kenya (%)
Place of birth for the foreign-born population - Somalia (%)
Place of birth for the foreign-born population - Uganda (%)
Place of birth for the foreign-born population - Zimbabwe (%)
Place of birth for the foreign-born population - Other Eastern Africa (%)
Place of birth for the foreign-born population - Cameroon (%)
Place of birth for the foreign-born population - Congo (%)
Place of birth for the foreign-born population - Democratic Republic of Congo (Zaire) (%)
Place of birth for the foreign-born population - Other Middle Africa (%)
Place of birth for the foreign-born population - Egypt (%)
Place of birth for the foreign-born population - Morocco (%)
Place of birth for the foreign-born population - Sudan (%)
Place of birth for the foreign-born population - Other Northern Africa (%)
Place of birth for the foreign-born population - South Africa (%)
Place of birth for the foreign-born population - Other Southern Africa (%)
Place of birth for the foreign-born population - Cabo Verde (%)
Place of birth for the foreign-born population - Ghana (%)
Place of birth for the foreign-born population - Liberia (%)
Place of birth for the foreign-born population - Nigeria (%)
Place of birth for the foreign-born population - Senegal (%)
Place of birth for the foreign-born population - Sierra Leone (%)
Place of birth for the foreign-born population - Other Western Africa (%)
Place of birth for the foreign-born population - Australia (%)
Place of birth for the foreign-born population - New Zealand (%)
Place of birth for the foreign-born population - Fiji (%)
Place of birth for the foreign-born population - Micronesia (%)
Place of birth for the foreign-born population - Bahamas (%)
Place of birth for the foreign-born population - Barbados (%)
Place of birth for the foreign-born population - Cuba (%)
Place of birth for the foreign-born population - Dominica (%)
Place of birth for the foreign-born population - Dominican Republic (%)
Place of birth for the foreign-born population - Grenada (%)
Place of birth for the foreign-born population - Haiti (%)
Place of birth for the foreign-born population - Jamaica (%)
Place of birth for the foreign-born population - St. Vincent and the Grenadines (%)
Place of birth for the foreign-born population - Trinidad and Tobago (%)
Place of birth for the foreign-born population - West Indies (%)
Place of birth for the foreign-born population - Other Caribbean (%)
Place of birth for the foreign-born population - Belize (%)
Place of birth for the foreign-born population - Costa Rica (%)
Place of birth for the foreign-born population - El Salvador (%)
Place of birth for the foreign-born population - Guatemala (%)
Place of birth for the foreign-born population - Honduras (%)
Place of birth for the foreign-born population - Mexico (%)
Place of birth for the foreign-born population - Nicaragua (%)
Place of birth for the foreign-born population - Panama (%)
Place of birth for the foreign-born population - Other Central America (%)
Place of birth for the foreign-born population - Argentina (%)
Place of birth for the foreign-born population - Bolivia (%)
Place of birth for the foreign-born population - Brazil (%)
Place of birth for the foreign-born population - Chile (%)
Place of birth for the foreign-born population - Colombia (%)
Place of birth for the foreign-born population - Ecuador (%)
Place of birth for the foreign-born population - Guyana (%)
Place of birth for the foreign-born population - Peru (%)
Place of birth for the foreign-born population - Uruguay (%)
Place of birth for the foreign-born population - Venezuela (%)
Place of birth for the foreign-born population - Other South America (%)
Place of birth for the foreign-born population - Canada (%)
Place of birth for the foreign-born population - Other Northern America (%)
Place of birth for the foreign-born population - Other (%)
Latest news about races in Gurnee, IL collected exclusively by city-data.com from local newspapers, TV, and radio stations
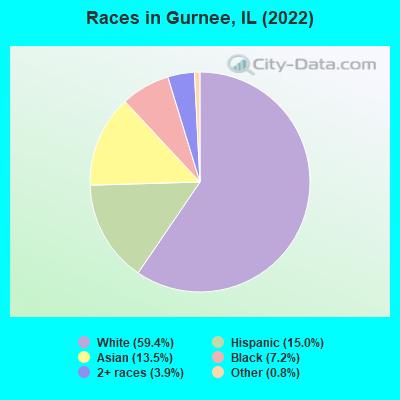
According to 2022 data, the most numerous races in Gurnee, IL are White alone (18,106 residents), Hispanic (4,558 residents), and Black alone (2,179 residents). 74.6% of Gurnee residents speak English at home. 16.2% of Gurnee, IL residents are foreign-born (8.9% born in Asia, 3.6% born in Latin America, 2.8% born in Europe), which is 13.3% greater than the foreign-born rate of 14.0% across the entire state of Illinois.
Race distribution in Gurnee
2000 2022
8,424,140 67.8% White alone 1,856,152 14.9% Black alone 1,530,262 12.3% Hispanic 419,916 3.4% Asian alone 153,996 1.2% Two or more races 13,479 0.1% Other race alone 18,232 0.1% American Indian alone 3,116 0.03% Native Hawaiian and Other
7,356,301 58.5% White alone 2,299,726 18.3% Hispanic 1,660,423 13.2% Black alone 747,296 5.9% Asian alone 458,599 3.6% Two or more races 45,386 0.4% Other race alone 10,405 0.08% American Indian alone 3,896 0.03% Native Hawaiian and Other
Income and house value in Gurnee Median household income in 2022 $117,854 White non-Hispanic householders$79,558 Black householders$134,933 American Indian and Alaska Native householders$142,992 Asian householders$73,758 Some other race householders$89,015 Two or more races householders$89,557 Hispanic or Latino race householdersMedian 2022 house value $335,153 White Non-Hispanic householders$314,058 Black or African American householders$590,652 American Indian or Alaska Native householders $370,929 Asian householders$263,768 Some other race householders$295,326 Two or more races householders$320,133 Hispanic or Latino householders
Median age by race in Gurnee
45.0 Median age for White residents43.8 46.7 32.1 Median age for Black or African American residents32.4 31.9 36.9 Median age for American Indian / Alaska Native residents38.2 16.3 38.4 Median age for Asian residents37.7 41.3 -593,236,714.4 Median age for Native Hawaiian / Pacific Islander residents-658,536,584.7 -576,015,108.0 43.4 Median age for Other race residents46.3 31.5 29.6 Median age for Two or more races residents27.8 31.0 45.5 Median age for White alone residents44.7 46.8 31.2 Median age for Hispanic or Latino residents30.3 34.2
Owner/renter occupied households by race in Gurnee
House owners and renters - White residents 6,154 77.2% Owner occupied1,821 22.8% Renter occupiedHouse owners and renters - Black or African American residents 291 28.6% Owner occupied727 71.4% Renter occupiedHouse owners and renters - American Indian / Alaska Native residents 106 89.1% Owner occupied13 10.9% Renter occupiedHouse owners and renters - Asian residents 1,173 91.3% Owner occupied112 8.7% Renter occupiedHouse owners and renters - Other race residents 285 56.6% Owner occupied218 43.4% Renter occupiedHouse owners and renters - Two or more races residents 775 65.9% Owner occupied401 34.1% Renter occupiedHouse owners and renters - White alone residents 6,154 78.2% Owner occupied1,711 21.8% Renter occupiedHouse owners and renters - Hispanic or Latino residents 866 57.5% Owner occupied640 42.5% Renter occupied
Language usage in Gurnee
English speakers - Total 74.6% of residents of Gurnee speak English at home.
9.3% of residents speak Spanish at home 1,924 70.3% Speak English very well813 29.7% Speak English less than very well15.9% of residents speak other language at home 3,349 71.8% Speak English very well1,318 28.2% Speak English less than very well
English speakers - Born in the United States 92.7% of residents of Gurnee speak English at home.
4.3% of residents speak Spanish at home 168 62.5% Speak English very well101 37.5% Speak English less than very well2.9% of residents speak other language at home 108 59.3% Speak English very well74 40.7% Speak English less than very well
English speakers - Native, born elsewhere 40.4% of residents of Gurnee speak English at home.
18.5% of residents speak Spanish at home 74 65.5% Speak English very well39 34.5% Speak English less than very well48.2% of residents speak other language at home 261 88.5% Speak English very well34 11.5% Speak English less than very well
English speakers - Foreign-born 14.0% of residents of Gurnee speak English at home.
17.5% of residents speak Spanish at home 455 50.6% Speak English very well444 49.4% Speak English less than very well67.4% of residents speak other language at home 2,273 65.8% Speak English very well1,184 34.2% Speak English less than very well
White (Caucasian) - Speak only English Native:
98.0% (16,293)Foreign-born:
30.5% (354)
White (Caucasian) - Speak another language Native:
3.5% (578)Foreign-born:
70.6% (819)
Black or African American - Speak only English Native:
96.7% (2,003)Foreign-born:
46.6% (37)
Black or African American - Speak another language Native:
3.3% (68)Foreign-born:
53.4% (43)
American Indian / Alaska Native - Speak another language Native:
89.0% (171)Foreign-born:
100.0% (203)
Asian - Speak only English Native:
37.0% (500)Foreign-born:
5.1% (131)
Asian - Speak another language Native:
68.2% (922)Foreign-born:
95.4% (2,458)
Other race - Speak only English Native:
40.4% (318)Foreign-born:
39.4% (165)
Other race - Speak another language Native:
61.2% (482)Foreign-born:
73.0% (306)
Two or more races - Speak only English Native:
63.7% (2,076)Foreign-born:
10.8% (50)
Two or more races - Speak another language Native:
34.8% (1,134)Foreign-born:
88.4% (413)
White alone - Speak only English Native:
97.3% (15,978)Foreign-born:
27.8% (342)
White alone - Speak another language Native:
2.8% (454)Foreign-born:
72.0% (885)
Hispanic or Latino - Speak only English Native:
50.7% (1,646)Foreign-born:
15.3% (162)
Hispanic or Latino - Speak another language Native:
50.4% (1,636)Foreign-born:
87.2% (926)
Foreign-born residents in Gurnee 4,919 residents are foreign born (8.9% Asia , 3.6% Latin America , 2.8% Europe ).
This city:
16.2%Illinois:
14.1%
Marital status for residents in Gurnee Marital status - White (Caucasian) population 15 years and over
Males 30.7% Never married59.9% Now married0.6% Separated1.5% Widowed7.2% DivorcedFemales 29.7% Never married53.6% Now married0.7% Separated8.4% Widowed7.7% DivorcedWomen who gave birth in the past 12 months Now married:
73.7% (62)Unmarried:
26.3% (22)
Women who did not give birth in the past 12 months Now married:
45.1% (1,756)Unmarried:
54.9% (2,138)
Marital status - Black or African American population 15 years and over
Males 35.7% Never married51.6% Now married9.1% Separated1.0% Widowed2.7% DivorcedFemales 39.8% Never married43.1% Now married0.0% Separated1.5% Widowed15.6% DivorcedWomen who gave birth in the past 12 months Now married:
21.4% (5)Unmarried:
78.6% (20)
Women who did not give birth in the past 12 months Now married:
40.0% (299)Unmarried:
60.0% (447)
Marital status - American Indian / Alaska Native population 15 years and over
Males 21.8% Never married74.7% Now married3.4% Separated0.0% Widowed0.0% DivorcedFemales 60.1% Never married35.7% Now married0.0% Separated0.0% Widowed4.2% DivorcedWomen who did not give birth in the past 12 months Now married:
0.0% (0)Unmarried:
100.0% (153)
Marital status - Asian population 15 years and over
Males 26.8% Never married67.1% Now married0.5% Separated0.9% Widowed4.7% DivorcedFemales 29.4% Never married57.9% Now married0.8% Separated7.9% Widowed4.0% DivorcedWomen who gave birth in the past 12 months Now married:
100.0% (15)Unmarried:
0.0% (0)
Women who did not give birth in the past 12 months Now married:
52.1% (642)Unmarried:
47.9% (589)
Marital status - Other race population 15 years and over
Males 38.5% Never married57.3% Now married0.0% Separated0.0% Widowed4.2% DivorcedFemales 43.5% Never married44.8% Now married0.0% Separated4.7% Widowed7.0% DivorcedWomen who did not give birth in the past 12 months Now married:
39.5% (134)Unmarried:
60.5% (206)
Marital status - Two or more races population 15 years and over
Males 37.5% Never married57.3% Now married1.3% Separated0.0% Widowed3.8% DivorcedFemales 37.0% Never married50.6% Now married2.4% Separated1.0% Widowed9.1% DivorcedWomen who gave birth in the past 12 months Now married:
19.4% (9)Unmarried:
80.6% (37)
Women who did not give birth in the past 12 months Now married:
48.4% (534)Unmarried:
51.6% (569)
Marital status - White alone, not Hispanic / Latino population 15 years and over
Males 29.6% Never married61.2% Now married0.7% Separated1.5% Widowed7.1% DivorcedFemales 29.2% Never married54.1% Now married0.6% Separated8.5% Widowed7.5% DivorcedWomen who gave birth in the past 12 months Now married:
72.2% (61)Unmarried:
27.8% (24)
Women who did not give birth in the past 12 months Now married:
45.3% (1,725)Unmarried:
54.7% (2,082)
Marital status - Hispanic or Latino population 15 years and over
Males 38.8% Never married53.4% Now married0.9% Separated0.5% Widowed6.4% DivorcedFemales 38.9% Never married47.7% Now married1.9% Separated3.4% Widowed8.1% DivorcedWomen who gave birth in the past 12 months Now married:
100.0% (5)Unmarried:
0.0% (0)
Women who did not give birth in the past 12 months Now married:
41.9% (568)Unmarried:
58.1% (789)
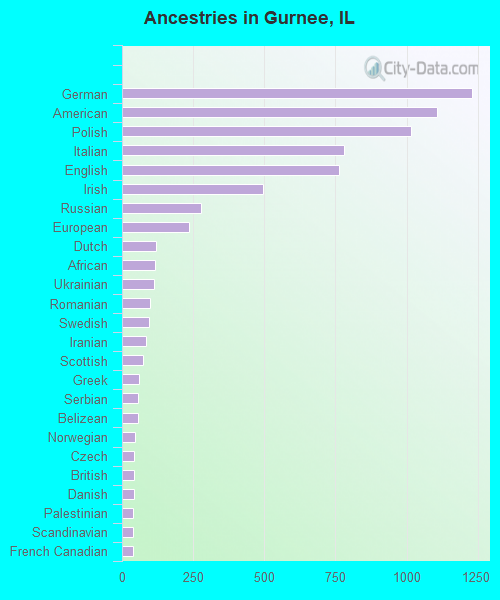
Ancestries in Gurnee
1,228 8.4% German1,105 7.6% American1,016 7.0% Polish781 5.3% Italian761 5.2% English496 3.4% Irish276 1.9% Russian236 1.6% European120 0.8% Dutch117 0.8% African114 0.8% Ukrainian100 0.7% Romanian95 0.7% Swedish85 0.6% Iranian73 0.5% Scottish61 0.4% Greek55 0.4% Serbian55 0.4% Belizean47 0.3% Norwegian43 0.3% Czech41 0.3% British41 0.3% Danish40 0.3% Palestinian40 0.3% Scandinavian38 0.3% French Canadian37 0.3% Northern European36 0.2% Croatian34 0.2% French33 0.2% Brazilian29 0.2% Lithuanian26 0.2% Ethiopian21 0.1% Lebanese19 0.1% Scotch-Irish17 0.1% Eastern European15 0.1% Hungarian14 0.10% Canadian10 0.07% Swiss9 0.06% Armenian8 0.05% Belgian7 0.05% Welsh5 0.03% Yugoslavian
Geographical mobility in Gurnee Same house 1 year ago 16,100 88.8% White (Caucasian)2,101 94.6% Black or African American357 99.7% American Indian / Alaska Native3,669 89.2% Asian854 72.3% Other race3,339 81.1% Two or more races16,182 89.6% White alone, not Hispanic / Latino3,499 78.1% Hispanic or LatinoMoved within same county 861 4.7% White / Caucasian153 6.9% Black or African American111 2.7% Asian191 16.2% Other race566 13.7% Two or more races706 3.9% White alone, not Hispanic / Latino711 15.9% Hispanic or LatinoMoved within same state 516 2.8% White / Caucasian5 0.2% Black or African American315 7.7% Asian21 1.8% Other race69 1.7% Two or more races459 2.5% White alone, not Hispanic / Latino95 2.1% Hispanic or LatinoMoved from different state 619 3.4% White / Caucasian61 2.8% Black or African American35 0.8% Asian100 2.4% Two or more races663 3.7% White alone, not Hispanic / Latino74 1.6% Hispanic or LatinoMoved from abroad 3 0.1% Black or African American11 0.3% Asian69 5.8% Other race39 1.0% Two or more races48 1.1% Hispanic or Latino
Children Nativity (place of birth) in Gurnee
Children under 6 years - Living with two parents Both parents native 815 100.0% NativeBoth parents foreign-born 128 93.5% Native9 6.5% Foreign-bornOne native, one foreign-born parent 166 100.0% NativeChildren under 6 years - Living with one parent Native parent 268 100.0% NativeForeign-born parent 55 100.0% NativeChildren 6 to 17 years - Living with two parents Both parents native 2,877 100.0% NativeBoth parents foreign-born 493 80.2% Native122 19.8% Foreign-bornOne native, one foreign-born parent 332 100.0% NativeChildren 6 to 17 years - Living with one parent Native parent 599 100.0% NativeForeign-born parent 82 51.8% Native76 48.2% Foreign-born
Grandparents responsible for own grandchildren in Gurnee
Grandparents (30 to 59 years) White / Caucasian 15 100.0% Not responsible for grandchildrenBlack or African American 4 29.4% Responsible for grandchildren9 70.6% Not responsible for grandchildrenAsian 6 100.0% Not responsible for grandchildrenWhite alone, not Hispanic / Latino 15 100.0% Not responsible for grandchildrenGrandparents (60 years and over) White / Caucasian 22 32.8% Responsible for grandchildren44 67.2% Not responsible for grandchildrenAsian 111 100.0% Not responsible for grandchildrenWhite alone, not Hispanic / Latino 26 29.7% Responsible for grandchildren62 70.3% Not responsible for grandchildren