Races in Groveland, Florida (FL) Detailed Stats
Data:
Races - White alone (%)
Races - White alone (% change since 2000)
Races - Black alone (%)
Races - Black alone (% change since 2000)
Races - American Indian alone (%)
Races - American Indian alone (% change since 2000)
Races - Asian alone (%)
Races - Asian alone (% change since 2000)
Races - Hispanic (%)
Races - Hispanic (% change since 2000)
Races - Native Hawaiian and Other Pacific Islander alone (%)
Races - Native Hawaiian and Other Pacific Islander alone (% change since 2000)
Races - Two or more races(%)
Races - Two or more races(% change since 2000)
Races - Other race alone (%)
Races - Other race alone (% change since 2000)
Racial diversity
Place of birth - Born in state of residence (%)
Place of birth - Born in state of residence (%) - White
Place of birth - Born in state of residence (%) - Black or African American
Place of birth - Born in state of residence (%) - Asian
Place of birth - Born in state of residence (%) - Hispanic or Latino
Place of birth - Born in state of residence (%) - American Indian and Alaska Native
Place of birth - Born in state of residence (%) - Multirace
Place of birth - Born in state of residence (%) - Other Race
Place of birth - Born in other state (%)
Place of birth - Born in other state (%) - White
Place of birth - Born in other state (%) - Black or African American
Place of birth - Born in other state (%) - Asian
Place of birth - Born in other state (%) - Hispanic or Latino
Place of birth - Born in other state (%) - American Indian and Alaska Native
Place of birth - Born in other state (%) - Multirace
Place of birth - Born in other state (%) - Other Race
Place of birth - Native, outside of US (%)
Place of birth - Native, outside of US (%) - White
Place of birth - Native, outside of US (%) - Black or African American
Place of birth - Native, outside of US (%) - Asian
Place of birth - Native, outside of US (%) - Hispanic or Latino
Place of birth - Native, outside of US (%) - American Indian and Alaska Native
Place of birth - Native, outside of US (%) - Multirace
Place of birth - Native, outside of US (%) - Other Race
Place of birth - Foreign born (%)
Place of birth - Foreign born (%) - White
Place of birth - Foreign born (%) - Black or African American
Place of birth - Foreign born (%) - Asian
Place of birth - Foreign born (%) - Hispanic or Latino
Place of birth - Foreign born (%) - American Indian and Alaska Native
Place of birth - Foreign born (%) - Multirace
Place of birth - Foreign born (%) - Other Race
Residents speaking English at home (%)
Residents speaking English at home - Born in the United States (%)
Residents speaking English at home - Native, born elsewhere (%)
Residents speaking English at home - Foreign born (%)
Residents speaking Spanish at home (%)
Residents speaking Spanish at home - Born in the United States (%)
Residents speaking Spanish at home - Native, born elsewhere (%)
Residents speaking Spanish at home - Foreign born (%)
Residents speaking other language at home (%)
Residents speaking other language at home - Born in the United States (%)
Residents speaking other language at home - Native, born elsewhere (%)
Residents speaking other language at home - Foreign born (%)
Marital status - Never married (%)
Marital status - Now married (%)
Marital status - Separated (%)
Marital status - Widowed (%)
Marital status - Divorced (%)
Ancestries Reported - Arab (%)
Ancestries Reported - Czech (%)
Ancestries Reported - Danish (%)
Ancestries Reported - Dutch (%)
Ancestries Reported - English (%)
Ancestries Reported - French (%)
Ancestries Reported - French Canadian (%)
Ancestries Reported - German (%)
Ancestries Reported - Greek (%)
Ancestries Reported - Hungarian (%)
Ancestries Reported - Irish (%)
Ancestries Reported - Italian (%)
Ancestries Reported - Lithuanian (%)
Ancestries Reported - Norwegian (%)
Ancestries Reported - Polish (%)
Ancestries Reported - Portuguese (%)
Ancestries Reported - Russian (%)
Ancestries Reported - Scotch-Irish (%)
Ancestries Reported - Scottish (%)
Ancestries Reported - Slovak (%)
Ancestries Reported - Subsaharan African (%)
Ancestries Reported - Swedish (%)
Ancestries Reported - Swiss (%)
Ancestries Reported - Ukrainian (%)
Ancestries Reported - United States (%)
Ancestries Reported - Welsh (%)
Ancestries Reported - West Indian (%)
Ancestries Reported - Other (%)
Geographical mobility - Same house 1 year ago (%)
Geographical mobility - Same house 1 year ago (%) - White
Geographical mobility - Same house 1 year ago (%) - Black or African American
Geographical mobility - Same house 1 year ago (%) - Asian
Geographical mobility - Same house 1 year ago (%) - Hispanic or Latino
Geographical mobility - Same house 1 year ago (%) - American Indian and Alaska Native
Geographical mobility - Same house 1 year ago (%) - Multirace
Geographical mobility - Same house 1 year ago (%) - Other Race
Geographical mobility - Moved within same county (%)
Geographical mobility - Moved within same county (%) - White
Geographical mobility - Moved within same county (%) - Black or African American
Geographical mobility - Moved within same county (%) - Asian
Geographical mobility - Moved within same county (%) - Hispanic or Latino
Geographical mobility - Moved within same county (%) - American Indian and Alaska Native
Geographical mobility - Moved within same county (%) - Multirace
Geographical mobility - Moved within same county (%) - Other Race
Geographical mobility - Moved from different county within same state (%)
Geographical mobility - Moved from different county within same state (%) - White
Geographical mobility - Moved from different county within same state (%) - Black or African American
Geographical mobility - Moved from different county within same state (%) - Asian
Geographical mobility - Moved from different county within same state (%) - Hispanic or Latino
Geographical mobility - Moved from different county within same state (%) - American Indian and Alaska Native
Geographical mobility - Moved from different county within same state (%) - Multirace
Geographical mobility - Moved from different county within same state (%) - Other Race
Geographical mobility - Moved from different state (%)
Geographical mobility - Moved from different state (%) - White
Geographical mobility - Moved from different state (%) - Black or African American
Geographical mobility - Moved from different state (%) - Asian
Geographical mobility - Moved from different state (%) - Hispanic or Latino
Geographical mobility - Moved from different state (%) - American Indian and Alaska Native
Geographical mobility - Moved from different state (%) - Multirace
Geographical mobility - Moved from different state (%) - Other Race
Geographical mobility - Moved from abroad (%)
Geographical mobility - Moved from abroad (%) - White
Geographical mobility - Moved from abroad (%) - Black or African American
Geographical mobility - Moved from abroad (%) - Asian
Geographical mobility - Moved from abroad (%) - Hispanic or Latino
Geographical mobility - Moved from abroad (%) - American Indian and Alaska Native
Geographical mobility - Moved from abroad (%) - Multirace
Geographical mobility - Moved from abroad (%) - Other Race
Place of birth for the foreign-born population - Ireland (%)
Place of birth for the foreign-born population - Denmark (%)
Place of birth for the foreign-born population - Norway (%)
Place of birth for the foreign-born population - Sweden (%)
Place of birth for the foreign-born population - United Kingdom (%)
Place of birth for the foreign-born population - England (%)
Place of birth for the foreign-born population - Scotland (%)
Place of birth for the foreign-born population - Other Northern Europe (%)
Place of birth for the foreign-born population - Austria (%)
Place of birth for the foreign-born population - Belgium (%)
Place of birth for the foreign-born population - France (%)
Place of birth for the foreign-born population - Germany (%)
Place of birth for the foreign-born population - Netherlands (%)
Place of birth for the foreign-born population - Switzerland (%)
Place of birth for the foreign-born population - Other Western Europe (%)
Place of birth for the foreign-born population - Greece (%)
Place of birth for the foreign-born population - Italy (%)
Place of birth for the foreign-born population - Portugal (%)
Place of birth for the foreign-born population - Spain (%)
Place of birth for the foreign-born population - Other Southern Europe (%)
Place of birth for the foreign-born population - Albania (%)
Place of birth for the foreign-born population - Belarus (%)
Place of birth for the foreign-born population - Bosnia and Herzegovina (%)
Place of birth for the foreign-born population - Bulgaria (%)
Place of birth for the foreign-born population - Croatia (%)
Place of birth for the foreign-born population - Czechoslovakia (%)
Place of birth for the foreign-born population - Hungary (%)
Place of birth for the foreign-born population - Latvia (%)
Place of birth for the foreign-born population - Lithuania (%)
Place of birth for the foreign-born population - North Macedonia (Macedonia) (%)
Place of birth for the foreign-born population - Moldova (%)
Place of birth for the foreign-born population - Poland (%)
Place of birth for the foreign-born population - Romania (%)
Place of birth for the foreign-born population - Russia (%)
Place of birth for the foreign-born population - Serbia (%)
Place of birth for the foreign-born population - Ukraine (%)
Place of birth for the foreign-born population - Other Eastern Europe (%)
Place of birth for the foreign-born population - China (%)
Place of birth for the foreign-born population - Hong Kong (%)
Place of birth for the foreign-born population - Taiwan (%)
Place of birth for the foreign-born population - Japan (%)
Place of birth for the foreign-born population - Korea (%)
Place of birth for the foreign-born population - Other Eastern Asia (%)
Place of birth for the foreign-born population - Afghanistan (%)
Place of birth for the foreign-born population - Bangladesh (%)
Place of birth for the foreign-born population - India (%)
Place of birth for the foreign-born population - Iran (%)
Place of birth for the foreign-born population - Kazakhstan (%)
Place of birth for the foreign-born population - Nepal (%)
Place of birth for the foreign-born population - Pakistan (%)
Place of birth for the foreign-born population - Sri Lanka (%)
Place of birth for the foreign-born population - Uzbekistan (%)
Place of birth for the foreign-born population - Other South Central Asia (%)
Place of birth for the foreign-born population - Burma (%)
Place of birth for the foreign-born population - Cambodia (%)
Place of birth for the foreign-born population - Indonesia (%)
Place of birth for the foreign-born population - Laos (%)
Place of birth for the foreign-born population - Malaysia (%)
Place of birth for the foreign-born population - Philippines (%)
Place of birth for the foreign-born population - Singapore (%)
Place of birth for the foreign-born population - Thailand (%)
Place of birth for the foreign-born population - Vietnam (%)
Place of birth for the foreign-born population - Other South Eastern Asia (%)
Place of birth for the foreign-born population - Armenia (%)
Place of birth for the foreign-born population - Iraq (%)
Place of birth for the foreign-born population - Israel (%)
Place of birth for the foreign-born population - Jordan (%)
Place of birth for the foreign-born population - Kuwait (%)
Place of birth for the foreign-born population - Lebanon (%)
Place of birth for the foreign-born population - Saudi Arabia (%)
Place of birth for the foreign-born population - Syria (%)
Place of birth for the foreign-born population - Turkey (%)
Place of birth for the foreign-born population - Yemen (%)
Place of birth for the foreign-born population - Other Western Asia (%)
Place of birth for the foreign-born population - Eritrea (%)
Place of birth for the foreign-born population - Ethiopia (%)
Place of birth for the foreign-born population - Kenya (%)
Place of birth for the foreign-born population - Somalia (%)
Place of birth for the foreign-born population - Uganda (%)
Place of birth for the foreign-born population - Zimbabwe (%)
Place of birth for the foreign-born population - Other Eastern Africa (%)
Place of birth for the foreign-born population - Cameroon (%)
Place of birth for the foreign-born population - Congo (%)
Place of birth for the foreign-born population - Democratic Republic of Congo (Zaire) (%)
Place of birth for the foreign-born population - Other Middle Africa (%)
Place of birth for the foreign-born population - Egypt (%)
Place of birth for the foreign-born population - Morocco (%)
Place of birth for the foreign-born population - Sudan (%)
Place of birth for the foreign-born population - Other Northern Africa (%)
Place of birth for the foreign-born population - South Africa (%)
Place of birth for the foreign-born population - Other Southern Africa (%)
Place of birth for the foreign-born population - Cabo Verde (%)
Place of birth for the foreign-born population - Ghana (%)
Place of birth for the foreign-born population - Liberia (%)
Place of birth for the foreign-born population - Nigeria (%)
Place of birth for the foreign-born population - Senegal (%)
Place of birth for the foreign-born population - Sierra Leone (%)
Place of birth for the foreign-born population - Other Western Africa (%)
Place of birth for the foreign-born population - Australia (%)
Place of birth for the foreign-born population - New Zealand (%)
Place of birth for the foreign-born population - Fiji (%)
Place of birth for the foreign-born population - Micronesia (%)
Place of birth for the foreign-born population - Bahamas (%)
Place of birth for the foreign-born population - Barbados (%)
Place of birth for the foreign-born population - Cuba (%)
Place of birth for the foreign-born population - Dominica (%)
Place of birth for the foreign-born population - Dominican Republic (%)
Place of birth for the foreign-born population - Grenada (%)
Place of birth for the foreign-born population - Haiti (%)
Place of birth for the foreign-born population - Jamaica (%)
Place of birth for the foreign-born population - St. Vincent and the Grenadines (%)
Place of birth for the foreign-born population - Trinidad and Tobago (%)
Place of birth for the foreign-born population - West Indies (%)
Place of birth for the foreign-born population - Other Caribbean (%)
Place of birth for the foreign-born population - Belize (%)
Place of birth for the foreign-born population - Costa Rica (%)
Place of birth for the foreign-born population - El Salvador (%)
Place of birth for the foreign-born population - Guatemala (%)
Place of birth for the foreign-born population - Honduras (%)
Place of birth for the foreign-born population - Mexico (%)
Place of birth for the foreign-born population - Nicaragua (%)
Place of birth for the foreign-born population - Panama (%)
Place of birth for the foreign-born population - Other Central America (%)
Place of birth for the foreign-born population - Argentina (%)
Place of birth for the foreign-born population - Bolivia (%)
Place of birth for the foreign-born population - Brazil (%)
Place of birth for the foreign-born population - Chile (%)
Place of birth for the foreign-born population - Colombia (%)
Place of birth for the foreign-born population - Ecuador (%)
Place of birth for the foreign-born population - Guyana (%)
Place of birth for the foreign-born population - Peru (%)
Place of birth for the foreign-born population - Uruguay (%)
Place of birth for the foreign-born population - Venezuela (%)
Place of birth for the foreign-born population - Other South America (%)
Place of birth for the foreign-born population - Canada (%)
Place of birth for the foreign-born population - Other Northern America (%)
Place of birth for the foreign-born population - Other (%)
Latest news about races in Groveland, FL collected exclusively by city-data.com from local newspapers, TV, and radio stations
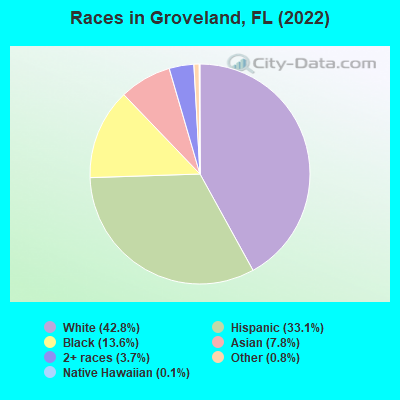
According to 2022 data, the most numerous races in Groveland, FL are White alone (8,740 residents), Hispanic (6,749 residents), and Black alone (2,766 residents). 79.9% of Groveland residents speak English at home. 12.2% of Groveland, FL residents are foreign-born (9.4% born in Latin America, 1.8% born in Asia), which is 72.6% less than the foreign-born rate of 21.0% across the entire state of Florida.
Race distribution in Groveland
2000 2022
10,458,509 65.4% White alone 2,682,715 16.8% Hispanic 2,264,268 14.2% Black alone 261,693 1.6% Asian alone 236,954 1.5% Two or more races 42,358 0.3% American Indian alone 28,994 0.2% Other race alone 6,887 0.04% Native Hawaiian and Other
11,309,403 50.8% White alone 6,025,039 27.1% Hispanic 3,241,015 14.6% Black alone 861,630 3.9% Two or more races 623,692 2.8% Asian alone 152,054 0.7% Other race alone 22,504 0.1% American Indian alone 9,486 0.04% Native Hawaiian and Other
Income and house value in Groveland Median household income in 2022 $87,309 White non-Hispanic householders$78,572 Black householders$63,751 Asian householders$115,787 Some other race householders$115,463 Two or more races householders$120,861 Hispanic or Latino race householdersMedian 2022 house value $390,850 White Non-Hispanic householders$180,279 Black or African American householders$464,134 American Indian or Alaska Native householders$525,205 Some other race householders$155,851 Two or more races householders$363,490 Hispanic or Latino householders
Median age by race in Groveland
42.8 Median age for White residents43.5 42.4 56.7 Median age for Black or African American residents60.0 53.1 60.6 Median age for American Indian / Alaska Native residents61.5 -591,194,968.0 37.6 Median age for Asian residents27.7 45.4 15.8 Median age for Native Hawaiian / Pacific Islander residents-858,307,848.3 8.3 33.7 Median age for Other race residents35.6 30.4 21.2 Median age for Two or more races residents10.3 24.9 44.4 Median age for White alone residents44.8 42.2 29.0 Median age for Hispanic or Latino residents26.0 33.0
Owner/renter occupied households by race in Groveland
House owners and renters - White residents 3,632 90.8% Owner occupied368 9.2% Renter occupiedHouse owners and renters - Black or African American residents 1,324 92.6% Owner occupied105 7.4% Renter occupiedHouse owners and renters - American Indian / Alaska Native residents 46 100.0% Owner occupiedHouse owners and renters - Asian residents 611 90.5% Owner occupied64 9.5% Renter occupiedHouse owners and renters - Native Hawaiian / Pacific Islander residents 15 47.4% Owner occupied17 52.6% Renter occupiedHouse owners and renters - Other race residents 155 100.0% Owner occupiedHouse owners and renters - Two or more races residents 1,266 76.3% Owner occupied392 23.7% Renter occupiedHouse owners and renters - White alone residents 3,201 90.2% Owner occupied347 9.8% Renter occupiedHouse owners and renters - Hispanic or Latino residents 1,556 81.7% Owner occupied349 18.3% Renter occupied
Language usage in Groveland
English speakers - Total 79.9% of residents of Groveland speak English at home.
16.6% of residents speak Spanish at home 2,587 83.4% Speak English very well514 16.6% Speak English less than very well4.2% of residents speak other language at home 422 53.7% Speak English very well364 46.3% Speak English less than very well
English speakers - Born in the United States 89.9% of residents of Groveland speak English at home.
9.4% of residents speak Spanish at home 703 90.6% Speak English very well73 9.4% Speak English less than very well1.2% of residents speak other language at home 98 100.0% Speak English very well
English speakers - Native, born elsewhere 9.5% of residents of Groveland speak English at home.
85.6% of residents speak Spanish at home 1,212 88.0% Speak English very well165 12.0% Speak English less than very well2.5% of residents speak other language at home 40 100.0% Speak English very well
English speakers - Foreign-born 45.8% of residents of Groveland speak English at home.
25.4% of residents speak Spanish at home 337 57.1% Speak English very well253 42.9% Speak English less than very well25.5% of residents speak other language at home 235 39.6% Speak English very well359 60.4% Speak English less than very well
White (Caucasian) - Speak only English Native:
93.8% (8,660)Foreign-born:
87.5% (225)
White (Caucasian) - Speak another language Native:
6.0% (553)Foreign-born:
54.3% (140)
Black or African American - Speak only English Native:
95.1% (2,261)Foreign-born:
76.3% (407)
Black or African American - Speak another language Native:
4.2% (99)Foreign-born:
23.8% (127)
Asian - Speak only English Native:
100.0% (644)Foreign-born:
32.3% (209)
Other race - Speak only English Native:
69.4% (485)Foreign-born:
24.9% (110)
Other race - Speak another language Native:
34.9% (244)Foreign-born:
39.8% (177)
Two or more races - Speak only English Native:
52.6% (2,142)Foreign-born:
15.3% (99)
Two or more races - Speak another language Native:
46.4% (1,888)Foreign-born:
82.0% (529)
White alone - Speak only English Native:
98.1% (8,120)Foreign-born:
100.0% (129)
White alone - Speak another language Native:
1.9% (161)Foreign-born:
4.0% (5)
Hispanic or Latino - Speak only English Native:
45.5% (2,154)Foreign-born:
29.6% (294)
Hispanic or Latino - Speak another language Native:
53.4% (2,528)Foreign-born:
62.0% (616)
Foreign-born residents in Groveland 2,482 residents are foreign born (9.4% Latin America , 1.8% Asia ).
This city:
12.2%Florida:
21.1%
Marital status for residents in Groveland Marital status - White (Caucasian) population 15 years and over
Males 24.6% Never married57.0% Now married0.0% Separated5.7% Widowed12.7% DivorcedFemales 24.0% Never married49.7% Now married4.1% Separated11.9% Widowed10.2% DivorcedWomen who gave birth in the past 12 months Now married:
100.0% (132)Unmarried:
0.0% (0)
Women who did not give birth in the past 12 months Now married:
43.0% (942)Unmarried:
57.0% (1,249)
Marital status - Black or African American population 15 years and over
Males 23.0% Never married64.9% Now married4.2% Separated0.0% Widowed7.9% DivorcedFemales 39.9% Never married42.4% Now married0.3% Separated8.7% Widowed8.7% DivorcedWomen who gave birth in the past 12 months Now married:
75.4% (46)Unmarried:
24.6% (15)
Women who did not give birth in the past 12 months Now married:
41.1% (246)Unmarried:
58.9% (352)
Marital status - Asian population 15 years and over
Males 69.5% Never married30.5% Now married0.0% Separated0.0% Widowed0.0% DivorcedFemales 42.2% Never married27.7% Now married0.0% Separated0.0% Widowed30.1% DivorcedWomen who gave birth in the past 12 months Now married:
100.0% (6)Unmarried:
0.0% (0)
Women who did not give birth in the past 12 months Now married:
30.5% (140)Unmarried:
69.5% (319)
Marital status - Native Hawaiian / Pacific Islander population 15 years and over
Males 59.0% Never married0.0% Now married0.0% Separated0.0% Widowed41.0% DivorcedFemales 0.0% Never married0.0% Now married0.0% Separated0.0% Widowed100.0% DivorcedWomen who did not give birth in the past 12 months Now married:
0.0% (0)Unmarried:
100.0% (10)
Marital status - Other race population 15 years and over
Males 0.0% Never married86.4% Now married0.0% Separated0.0% Widowed13.6% DivorcedFemales 12.9% Never married67.5% Now married0.0% Separated0.5% Widowed19.1% DivorcedWomen who did not give birth in the past 12 months Now married:
72.1% (613)Unmarried:
27.9% (237)
Marital status - Two or more races population 15 years and over
Males 34.2% Never married51.9% Now married0.0% Separated3.2% Widowed10.8% DivorcedFemales 24.6% Never married20.3% Now married0.0% Separated30.7% Widowed24.3% DivorcedWomen who gave birth in the past 12 months Now married:
0.0% (0)Unmarried:
100.0% (129)
Women who did not give birth in the past 12 months Now married:
34.5% (333)Unmarried:
65.5% (631)
Marital status - White alone, not Hispanic / Latino population 15 years and over
Males 21.3% Never married58.3% Now married0.0% Separated6.6% Widowed13.8% DivorcedFemales 21.7% Never married53.1% Now married2.5% Separated12.7% Widowed10.1% DivorcedWomen who gave birth in the past 12 months Now married:
100.0% (142)Unmarried:
0.0% (0)
Women who did not give birth in the past 12 months Now married:
42.6% (828)Unmarried:
57.4% (1,118)
Marital status - Hispanic or Latino population 15 years and over
Males 36.1% Never married52.6% Now married0.0% Separated0.0% Widowed11.3% DivorcedFemales 27.4% Never married28.5% Now married4.0% Separated19.4% Widowed20.6% DivorcedWomen who gave birth in the past 12 months Now married:
0.0% (0)Unmarried:
100.0% (113)
Women who did not give birth in the past 12 months Now married:
43.5% (738)Unmarried:
56.5% (958)
Ancestries in Groveland
2,950 24.3% American952 7.9% English718 5.9% German357 2.9% Jamaican300 2.5% Italian277 2.3% Guyanese254 2.1% Irish145 1.2% Polish131 1.1% European60 0.5% Russian59 0.5% French55 0.5% Slovak49 0.4% Welsh44 0.4% Haitian34 0.3% Austrian32 0.3% Trinidadian and Tobagonian31 0.3% Ukrainian29 0.2% French Canadian28 0.2% Pennsylvania German24 0.2% Dutch23 0.2% Danish18 0.1% Eastern European16 0.1% Portuguese13 0.1% Swedish11 0.09% Moroccan9 0.07% African
Geographical mobility in Groveland Same house 1 year ago 9,206 93.4% White (Caucasian)2,346 79.2% Black or African American115 100.0% American Indian / Alaska Native1,422 99.2% Asian78 100.0% Native Hawaiian / Pacific Islander810 69.9% Other race5,402 100.0% Two or more races8,192 94.0% White alone, not Hispanic / Latino5,995 95.6% Hispanic or LatinoMoved within same county 335 3.4% White / Caucasian263 8.9% Black or African American52 4.5% Other race43 0.8% Two or more races264 3.0% White alone, not Hispanic / Latino151 2.4% Hispanic or LatinoMoved within same state 249 2.5% White / Caucasian258 8.7% Black or African American156 13.4% Other race29 0.5% Two or more races232 2.7% White alone, not Hispanic / Latino86 1.4% Hispanic or LatinoMoved from different state 92 0.9% White / Caucasian73 2.5% Black or African American12 0.8% Asian12 1.0% Other race45 0.5% White alone, not Hispanic / Latino82 1.3% Hispanic or LatinoMoved from abroad 29 1.0% Black or African American18 1.3% Asian100 8.7% Other race67 1.3% Two or more races185 3.0% Hispanic or Latino
Children Nativity (place of birth) in Groveland
Children under 6 years - Living with two parents Both parents native 778 100.0% NativeBoth parents foreign-born 10 100.0% NativeOne native, one foreign-born parent 86 100.0% NativeChildren under 6 years - Living with one parent Native parent 841 100.0% NativeForeign-born parent 109 100.0% NativeChildren 6 to 17 years - Living with two parents Both parents native 1,650 100.0% NativeBoth parents foreign-born 28 100.0% NativeOne native, one foreign-born parent 278 86.5% Native43 13.5% Foreign-bornChildren 6 to 17 years - Living with one parent Native parent 1,218 100.0% NativeForeign-born parent 71 46.1% Native83 53.9% Foreign-born
Grandparents responsible for own grandchildren in Groveland
Grandparents (30 to 59 years) White / Caucasian 71 100.0% Not responsible for grandchildrenTwo or more races 434 100.0% Responsible for grandchildrenWhite alone, not Hispanic / Latino 81 100.0% Not responsible for grandchildrenHispanic or Latino 252 100.0% Responsible for grandchildrenGrandparents (60 years and over) White / Caucasian 71 28.8% Responsible for grandchildren175 71.2% Not responsible for grandchildrenTwo or more races 150 100.0% Not responsible for grandchildrenWhite alone, not Hispanic / Latino 78 30.1% Responsible for grandchildren181 69.9% Not responsible for grandchildrenHispanic or Latino 126 100.0% Not responsible for grandchildren