Races in Greeneville, Tennessee (TN) Detailed Stats
Data:
Races - White alone (%)
Races - White alone (% change since 2000)
Races - Black alone (%)
Races - Black alone (% change since 2000)
Races - American Indian alone (%)
Races - American Indian alone (% change since 2000)
Races - Asian alone (%)
Races - Asian alone (% change since 2000)
Races - Hispanic (%)
Races - Hispanic (% change since 2000)
Races - Native Hawaiian and Other Pacific Islander alone (%)
Races - Native Hawaiian and Other Pacific Islander alone (% change since 2000)
Races - Two or more races(%)
Races - Two or more races(% change since 2000)
Races - Other race alone (%)
Races - Other race alone (% change since 2000)
Racial diversity
Place of birth - Born in state of residence (%)
Place of birth - Born in state of residence (%) - White
Place of birth - Born in state of residence (%) - Black or African American
Place of birth - Born in state of residence (%) - Asian
Place of birth - Born in state of residence (%) - Hispanic or Latino
Place of birth - Born in state of residence (%) - American Indian and Alaska Native
Place of birth - Born in state of residence (%) - Multirace
Place of birth - Born in state of residence (%) - Other Race
Place of birth - Born in other state (%)
Place of birth - Born in other state (%) - White
Place of birth - Born in other state (%) - Black or African American
Place of birth - Born in other state (%) - Asian
Place of birth - Born in other state (%) - Hispanic or Latino
Place of birth - Born in other state (%) - American Indian and Alaska Native
Place of birth - Born in other state (%) - Multirace
Place of birth - Born in other state (%) - Other Race
Place of birth - Native, outside of US (%)
Place of birth - Native, outside of US (%) - White
Place of birth - Native, outside of US (%) - Black or African American
Place of birth - Native, outside of US (%) - Asian
Place of birth - Native, outside of US (%) - Hispanic or Latino
Place of birth - Native, outside of US (%) - American Indian and Alaska Native
Place of birth - Native, outside of US (%) - Multirace
Place of birth - Native, outside of US (%) - Other Race
Place of birth - Foreign born (%)
Place of birth - Foreign born (%) - White
Place of birth - Foreign born (%) - Black or African American
Place of birth - Foreign born (%) - Asian
Place of birth - Foreign born (%) - Hispanic or Latino
Place of birth - Foreign born (%) - American Indian and Alaska Native
Place of birth - Foreign born (%) - Multirace
Place of birth - Foreign born (%) - Other Race
Residents speaking English at home (%)
Residents speaking English at home - Born in the United States (%)
Residents speaking English at home - Native, born elsewhere (%)
Residents speaking English at home - Foreign born (%)
Residents speaking Spanish at home (%)
Residents speaking Spanish at home - Born in the United States (%)
Residents speaking Spanish at home - Native, born elsewhere (%)
Residents speaking Spanish at home - Foreign born (%)
Residents speaking other language at home (%)
Residents speaking other language at home - Born in the United States (%)
Residents speaking other language at home - Native, born elsewhere (%)
Residents speaking other language at home - Foreign born (%)
Marital status - Never married (%)
Marital status - Now married (%)
Marital status - Separated (%)
Marital status - Widowed (%)
Marital status - Divorced (%)
Ancestries Reported - Arab (%)
Ancestries Reported - Czech (%)
Ancestries Reported - Danish (%)
Ancestries Reported - Dutch (%)
Ancestries Reported - English (%)
Ancestries Reported - French (%)
Ancestries Reported - French Canadian (%)
Ancestries Reported - German (%)
Ancestries Reported - Greek (%)
Ancestries Reported - Hungarian (%)
Ancestries Reported - Irish (%)
Ancestries Reported - Italian (%)
Ancestries Reported - Lithuanian (%)
Ancestries Reported - Norwegian (%)
Ancestries Reported - Polish (%)
Ancestries Reported - Portuguese (%)
Ancestries Reported - Russian (%)
Ancestries Reported - Scotch-Irish (%)
Ancestries Reported - Scottish (%)
Ancestries Reported - Slovak (%)
Ancestries Reported - Subsaharan African (%)
Ancestries Reported - Swedish (%)
Ancestries Reported - Swiss (%)
Ancestries Reported - Ukrainian (%)
Ancestries Reported - United States (%)
Ancestries Reported - Welsh (%)
Ancestries Reported - West Indian (%)
Ancestries Reported - Other (%)
Geographical mobility - Same house 1 year ago (%)
Geographical mobility - Same house 1 year ago (%) - White
Geographical mobility - Same house 1 year ago (%) - Black or African American
Geographical mobility - Same house 1 year ago (%) - Asian
Geographical mobility - Same house 1 year ago (%) - Hispanic or Latino
Geographical mobility - Same house 1 year ago (%) - American Indian and Alaska Native
Geographical mobility - Same house 1 year ago (%) - Multirace
Geographical mobility - Same house 1 year ago (%) - Other Race
Geographical mobility - Moved within same county (%)
Geographical mobility - Moved within same county (%) - White
Geographical mobility - Moved within same county (%) - Black or African American
Geographical mobility - Moved within same county (%) - Asian
Geographical mobility - Moved within same county (%) - Hispanic or Latino
Geographical mobility - Moved within same county (%) - American Indian and Alaska Native
Geographical mobility - Moved within same county (%) - Multirace
Geographical mobility - Moved within same county (%) - Other Race
Geographical mobility - Moved from different county within same state (%)
Geographical mobility - Moved from different county within same state (%) - White
Geographical mobility - Moved from different county within same state (%) - Black or African American
Geographical mobility - Moved from different county within same state (%) - Asian
Geographical mobility - Moved from different county within same state (%) - Hispanic or Latino
Geographical mobility - Moved from different county within same state (%) - American Indian and Alaska Native
Geographical mobility - Moved from different county within same state (%) - Multirace
Geographical mobility - Moved from different county within same state (%) - Other Race
Geographical mobility - Moved from different state (%)
Geographical mobility - Moved from different state (%) - White
Geographical mobility - Moved from different state (%) - Black or African American
Geographical mobility - Moved from different state (%) - Asian
Geographical mobility - Moved from different state (%) - Hispanic or Latino
Geographical mobility - Moved from different state (%) - American Indian and Alaska Native
Geographical mobility - Moved from different state (%) - Multirace
Geographical mobility - Moved from different state (%) - Other Race
Geographical mobility - Moved from abroad (%)
Geographical mobility - Moved from abroad (%) - White
Geographical mobility - Moved from abroad (%) - Black or African American
Geographical mobility - Moved from abroad (%) - Asian
Geographical mobility - Moved from abroad (%) - Hispanic or Latino
Geographical mobility - Moved from abroad (%) - American Indian and Alaska Native
Geographical mobility - Moved from abroad (%) - Multirace
Geographical mobility - Moved from abroad (%) - Other Race
Place of birth for the foreign-born population - Ireland (%)
Place of birth for the foreign-born population - Denmark (%)
Place of birth for the foreign-born population - Norway (%)
Place of birth for the foreign-born population - Sweden (%)
Place of birth for the foreign-born population - United Kingdom (%)
Place of birth for the foreign-born population - England (%)
Place of birth for the foreign-born population - Scotland (%)
Place of birth for the foreign-born population - Other Northern Europe (%)
Place of birth for the foreign-born population - Austria (%)
Place of birth for the foreign-born population - Belgium (%)
Place of birth for the foreign-born population - France (%)
Place of birth for the foreign-born population - Germany (%)
Place of birth for the foreign-born population - Netherlands (%)
Place of birth for the foreign-born population - Switzerland (%)
Place of birth for the foreign-born population - Other Western Europe (%)
Place of birth for the foreign-born population - Greece (%)
Place of birth for the foreign-born population - Italy (%)
Place of birth for the foreign-born population - Portugal (%)
Place of birth for the foreign-born population - Spain (%)
Place of birth for the foreign-born population - Other Southern Europe (%)
Place of birth for the foreign-born population - Albania (%)
Place of birth for the foreign-born population - Belarus (%)
Place of birth for the foreign-born population - Bosnia and Herzegovina (%)
Place of birth for the foreign-born population - Bulgaria (%)
Place of birth for the foreign-born population - Croatia (%)
Place of birth for the foreign-born population - Czechoslovakia (%)
Place of birth for the foreign-born population - Hungary (%)
Place of birth for the foreign-born population - Latvia (%)
Place of birth for the foreign-born population - Lithuania (%)
Place of birth for the foreign-born population - North Macedonia (Macedonia) (%)
Place of birth for the foreign-born population - Moldova (%)
Place of birth for the foreign-born population - Poland (%)
Place of birth for the foreign-born population - Romania (%)
Place of birth for the foreign-born population - Russia (%)
Place of birth for the foreign-born population - Serbia (%)
Place of birth for the foreign-born population - Ukraine (%)
Place of birth for the foreign-born population - Other Eastern Europe (%)
Place of birth for the foreign-born population - China (%)
Place of birth for the foreign-born population - Hong Kong (%)
Place of birth for the foreign-born population - Taiwan (%)
Place of birth for the foreign-born population - Japan (%)
Place of birth for the foreign-born population - Korea (%)
Place of birth for the foreign-born population - Other Eastern Asia (%)
Place of birth for the foreign-born population - Afghanistan (%)
Place of birth for the foreign-born population - Bangladesh (%)
Place of birth for the foreign-born population - India (%)
Place of birth for the foreign-born population - Iran (%)
Place of birth for the foreign-born population - Kazakhstan (%)
Place of birth for the foreign-born population - Nepal (%)
Place of birth for the foreign-born population - Pakistan (%)
Place of birth for the foreign-born population - Sri Lanka (%)
Place of birth for the foreign-born population - Uzbekistan (%)
Place of birth for the foreign-born population - Other South Central Asia (%)
Place of birth for the foreign-born population - Burma (%)
Place of birth for the foreign-born population - Cambodia (%)
Place of birth for the foreign-born population - Indonesia (%)
Place of birth for the foreign-born population - Laos (%)
Place of birth for the foreign-born population - Malaysia (%)
Place of birth for the foreign-born population - Philippines (%)
Place of birth for the foreign-born population - Singapore (%)
Place of birth for the foreign-born population - Thailand (%)
Place of birth for the foreign-born population - Vietnam (%)
Place of birth for the foreign-born population - Other South Eastern Asia (%)
Place of birth for the foreign-born population - Armenia (%)
Place of birth for the foreign-born population - Iraq (%)
Place of birth for the foreign-born population - Israel (%)
Place of birth for the foreign-born population - Jordan (%)
Place of birth for the foreign-born population - Kuwait (%)
Place of birth for the foreign-born population - Lebanon (%)
Place of birth for the foreign-born population - Saudi Arabia (%)
Place of birth for the foreign-born population - Syria (%)
Place of birth for the foreign-born population - Turkey (%)
Place of birth for the foreign-born population - Yemen (%)
Place of birth for the foreign-born population - Other Western Asia (%)
Place of birth for the foreign-born population - Eritrea (%)
Place of birth for the foreign-born population - Ethiopia (%)
Place of birth for the foreign-born population - Kenya (%)
Place of birth for the foreign-born population - Somalia (%)
Place of birth for the foreign-born population - Uganda (%)
Place of birth for the foreign-born population - Zimbabwe (%)
Place of birth for the foreign-born population - Other Eastern Africa (%)
Place of birth for the foreign-born population - Cameroon (%)
Place of birth for the foreign-born population - Congo (%)
Place of birth for the foreign-born population - Democratic Republic of Congo (Zaire) (%)
Place of birth for the foreign-born population - Other Middle Africa (%)
Place of birth for the foreign-born population - Egypt (%)
Place of birth for the foreign-born population - Morocco (%)
Place of birth for the foreign-born population - Sudan (%)
Place of birth for the foreign-born population - Other Northern Africa (%)
Place of birth for the foreign-born population - South Africa (%)
Place of birth for the foreign-born population - Other Southern Africa (%)
Place of birth for the foreign-born population - Cabo Verde (%)
Place of birth for the foreign-born population - Ghana (%)
Place of birth for the foreign-born population - Liberia (%)
Place of birth for the foreign-born population - Nigeria (%)
Place of birth for the foreign-born population - Senegal (%)
Place of birth for the foreign-born population - Sierra Leone (%)
Place of birth for the foreign-born population - Other Western Africa (%)
Place of birth for the foreign-born population - Australia (%)
Place of birth for the foreign-born population - New Zealand (%)
Place of birth for the foreign-born population - Fiji (%)
Place of birth for the foreign-born population - Micronesia (%)
Place of birth for the foreign-born population - Bahamas (%)
Place of birth for the foreign-born population - Barbados (%)
Place of birth for the foreign-born population - Cuba (%)
Place of birth for the foreign-born population - Dominica (%)
Place of birth for the foreign-born population - Dominican Republic (%)
Place of birth for the foreign-born population - Grenada (%)
Place of birth for the foreign-born population - Haiti (%)
Place of birth for the foreign-born population - Jamaica (%)
Place of birth for the foreign-born population - St. Vincent and the Grenadines (%)
Place of birth for the foreign-born population - Trinidad and Tobago (%)
Place of birth for the foreign-born population - West Indies (%)
Place of birth for the foreign-born population - Other Caribbean (%)
Place of birth for the foreign-born population - Belize (%)
Place of birth for the foreign-born population - Costa Rica (%)
Place of birth for the foreign-born population - El Salvador (%)
Place of birth for the foreign-born population - Guatemala (%)
Place of birth for the foreign-born population - Honduras (%)
Place of birth for the foreign-born population - Mexico (%)
Place of birth for the foreign-born population - Nicaragua (%)
Place of birth for the foreign-born population - Panama (%)
Place of birth for the foreign-born population - Other Central America (%)
Place of birth for the foreign-born population - Argentina (%)
Place of birth for the foreign-born population - Bolivia (%)
Place of birth for the foreign-born population - Brazil (%)
Place of birth for the foreign-born population - Chile (%)
Place of birth for the foreign-born population - Colombia (%)
Place of birth for the foreign-born population - Ecuador (%)
Place of birth for the foreign-born population - Guyana (%)
Place of birth for the foreign-born population - Peru (%)
Place of birth for the foreign-born population - Uruguay (%)
Place of birth for the foreign-born population - Venezuela (%)
Place of birth for the foreign-born population - Other South America (%)
Place of birth for the foreign-born population - Canada (%)
Place of birth for the foreign-born population - Other Northern America (%)
Place of birth for the foreign-born population - Other (%)
Latest news about races in Greeneville, TN collected exclusively by city-data.com from local newspapers, TV, and radio stations
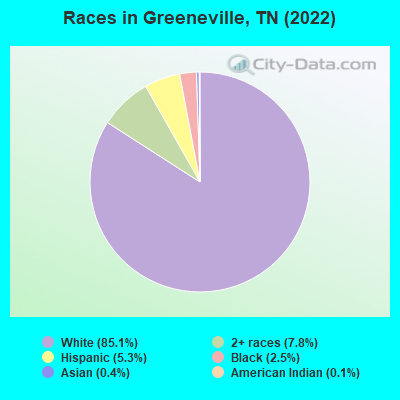
According to 2022 data, the most numerous races in Greeneville, TN are White alone (13,403 residents), Black alone (391 residents), and Hispanic (833 residents). 95.9% of Greeneville residents speak English at home. 2.5% of Greeneville, TN residents are foreign-born (1.4% born in Latin America, 0.5% born in Europe, 0.3% born in Asia), which is 103.1% less than the foreign-born rate of 5.0% across the entire state of Tennessee.
Race distribution in Greeneville
2000 2022
4,505,930 79.2% White alone 928,204 16.3% Black alone 123,838 2.2% Hispanic 54,824 1.0% Two or more races 56,077 1.0% Asian alone 13,820 0.2% American Indian alone 4,780 0.08% Other race alone 1,810 0.03% Native Hawaiian and Other
5,070,026 71.9% White alone 1,089,738 15.5% Black alone 442,629 6.3% Hispanic 279,381 4.0% Two or more races 131,817 1.9% Asian alone 26,972 0.4% Other race alone 6,387 0.09% American Indian alone 4,389 0.06% Native Hawaiian and Other
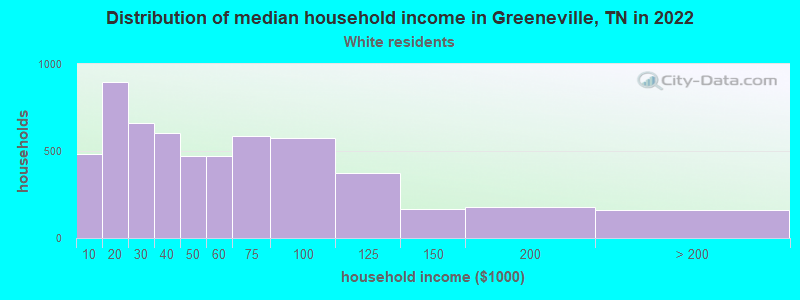
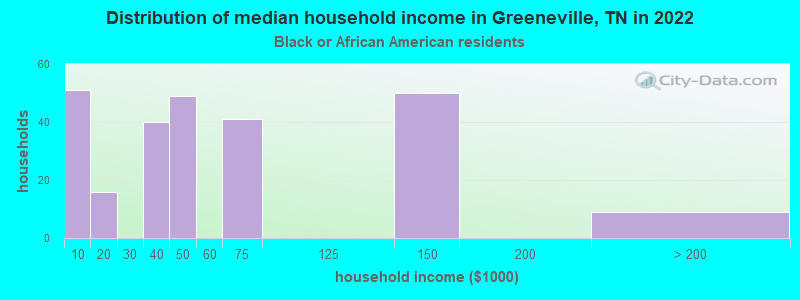
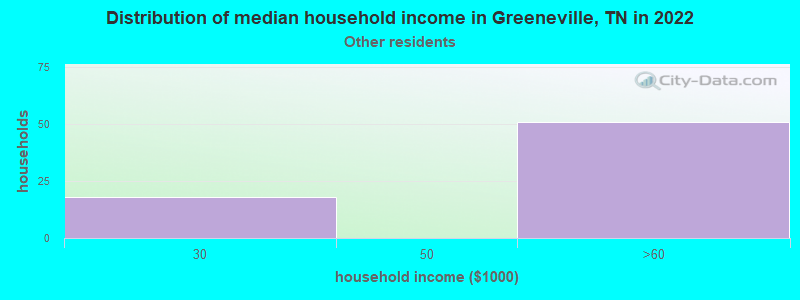
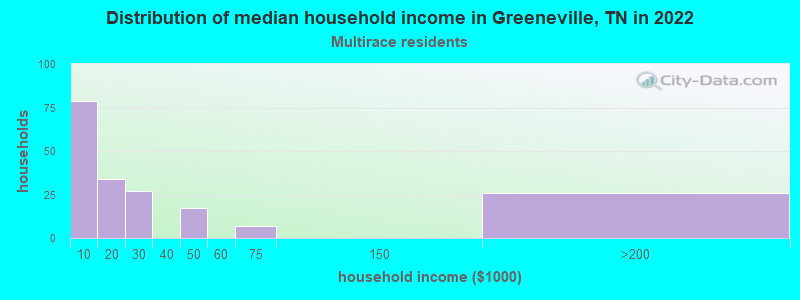
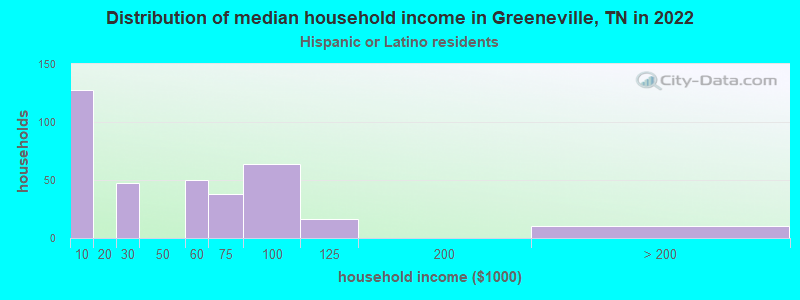
Income and house value in Greeneville Median household income in 2022 $44,076 White non-Hispanic householders$45,604 Black householders$57,511 Hispanic or Latino race householdersMedian 2022 house value $220,521 White Non-Hispanic householders$198,418 Black or African American householders$69,865 American Indian or Alaska Native householders over $1,000,000 Asian householders$205,024 Two or more races householders$285,814 Hispanic or Latino householders
Median age by race in Greeneville
44.4 Median age for White residents39.0 49.5 48.1 Median age for Black or African American residents47.3 90.9 110.2 Median age for American Indian / Alaska Native residents-657,407,406.8 69.8 14.4 Median age for Asian residents-662,846,226.7 14.4 -885,813,147.9 Median age for Native Hawaiian / Pacific Islander residents-666,666,666.0 -666,666,666.0 15.5 Median age for Other race residents-671,161,048.0 -745,428,972.5 21.4 Median age for Two or more races residents15.0 28.0 45.2 Median age for White alone residents39.1 50.1 32.3 Median age for Hispanic or Latino residents23.5 20.6
Owner/renter occupied households by race in Greeneville
House owners and renters - White residents 3,633 62.3% Owner occupied2,203 37.7% Renter occupiedHouse owners and renters - Black or African American residents 101 39.7% Owner occupied154 60.3% Renter occupiedHouse owners and renters - American Indian / Alaska Native residents 29 100.0% Renter occupiedHouse owners and renters - Asian residents 9 100.0% Renter occupiedHouse owners and renters - Native Hawaiian / Pacific Islander residents 40 100.0% Renter occupiedHouse owners and renters - Other race residents 78 100.0% Renter occupiedHouse owners and renters - Two or more races residents 70 31.4% Owner occupied152 68.6% Renter occupiedHouse owners and renters - White alone residents 3,572 62.0% Owner occupied2,189 38.0% Renter occupiedHouse owners and renters - Hispanic or Latino residents 95 36.4% Owner occupied167 63.6% Renter occupied
Language usage in Greeneville
English speakers - Total 95.9% of residents of Greeneville speak English at home.
3.0% of residents speak Spanish at home 359 79.2% Speak English very well94 20.8% Speak English less than very well0.8% of residents speak other language at home 120 100.0% Speak English very well
English speakers - Born in the United States 95.0% of residents of Greeneville speak English at home.
4.7% of residents speak Spanish at home 219 100.0% Speak English very well
English speakers - Native, born elsewhere 99.1% of residents of Greeneville speak English at home.
English speakers - Foreign-born 45.9% of residents of Greeneville speak English at home.
51.6% of residents speak Spanish at home 106 53.3% Speak English very well93 46.7% Speak English less than very well
White (Caucasian) - Speak only English Native:
98.6% (12,738)Foreign-born:
55.7% (55)
White (Caucasian) - Speak another language Native:
1.4% (187)Foreign-born:
49.6% (49)
Black or African American - Speak only English Native:
99.9% (389)Foreign-born:
100.0% (34)
American Indian / Alaska Native - Speak only English Native:
87.7% (62)Foreign-born:
79.1% (42)
Other race - Speak another language Native:
96.2% (121)Foreign-born:
100.0% (79)
Two or more races - Speak only English Native:
97.0% (1,258)Foreign-born:
17.3% (19)
Two or more races - Speak another language Native:
1.5% (19)Foreign-born:
82.9% (90)
White alone - Speak only English Native:
98.9% (12,623)Foreign-born:
96.7% (60)
Hispanic or Latino - Speak only English Native:
54.4% (292)Foreign-born:
13.9% (34)
Hispanic or Latino - Speak another language Native:
45.7% (246)Foreign-born:
85.4% (209)
Foreign-born residents in Greeneville 386 residents are foreign born (1.4% Latin America , 0.5% Europe , 0.3% Asia ).
This city:
2.5%Tennessee:
5.4%
Marital status for residents in Greeneville Marital status - White (Caucasian) population 15 years and over
Males 36.2% Never married43.6% Now married0.7% Separated5.4% Widowed14.0% DivorcedFemales 23.3% Never married37.2% Now married1.9% Separated14.4% Widowed23.2% DivorcedWomen who gave birth in the past 12 months Now married:
40.6% (72)Unmarried:
59.4% (106)
Women who did not give birth in the past 12 months Now married:
40.8% (1,066)Unmarried:
59.2% (1,550)
Marital status - Black or African American population 15 years and over
Males 30.3% Never married22.4% Now married0.0% Separated0.0% Widowed47.2% DivorcedFemales 56.5% Never married16.3% Now married0.0% Separated4.8% Widowed22.4% DivorcedWomen who gave birth in the past 12 months Now married:
100.0% (9)Unmarried:
0.0% (0)
Women who did not give birth in the past 12 months Now married:
45.5% (15)Unmarried:
54.5% (17)
Marital status - American Indian / Alaska Native population 15 years and over
Males 0.0% Never married0.0% Now married0.0% Separated0.0% Widowed100.0% DivorcedFemales 42.7% Never married23.2% Now married0.0% Separated0.0% Widowed34.1% DivorcedWomen who did not give birth in the past 12 months Now married:
10.3% (5)Unmarried:
89.7% (41)
Marital status - Other race population 15 years and over
Males 100.0% Never married0.0% Now married0.0% Separated0.0% Widowed0.0% DivorcedFemales 0.0% Never married0.0% Now married0.0% Separated0.0% Widowed100.0% DivorcedWomen who did not give birth in the past 12 months Now married:
0.0% (0)Unmarried:
100.0% (20)
Marital status - Two or more races population 15 years and over
Males 69.1% Never married6.1% Now married21.3% Separated3.5% Widowed0.0% DivorcedFemales 61.8% Never married12.5% Now married3.5% Separated4.2% Widowed18.0% DivorcedWomen who did not give birth in the past 12 months Now married:
7.6% (37)Unmarried:
92.4% (451)
Marital status - White alone, not Hispanic / Latino population 15 years and over
Males 36.1% Never married44.3% Now married0.7% Separated5.5% Widowed13.3% DivorcedFemales 22.4% Never married37.5% Now married1.9% Separated14.7% Widowed23.6% DivorcedWomen who gave birth in the past 12 months Now married:
40.6% (73)Unmarried:
59.4% (107)
Women who did not give birth in the past 12 months Now married:
41.2% (1,058)Unmarried:
58.8% (1,512)
Marital status - Hispanic or Latino population 15 years and over
Males 42.6% Never married7.4% Now married29.7% Separated0.0% Widowed20.3% DivorcedFemales 62.3% Never married19.4% Now married0.4% Separated0.0% Widowed17.9% DivorcedWomen who did not give birth in the past 12 months Now married:
15.2% (25)Unmarried:
84.8% (137)
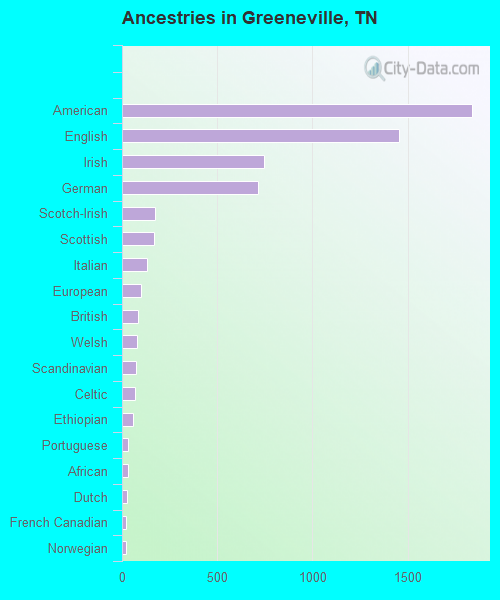
Ancestries in Greeneville
1,836 20.6% American1,457 16.3% English748 8.4% Irish715 8.0% German173 1.9% Scotch-Irish168 1.9% Scottish129 1.4% Italian98 1.1% European86 1.0% British81 0.9% Welsh76 0.9% Scandinavian69 0.8% Celtic59 0.7% Ethiopian32 0.4% Portuguese29 0.3% African27 0.3% Dutch21 0.2% French Canadian19 0.2% Norwegian16 0.2% Hungarian15 0.2% French
Children Nativity (place of birth) in Greeneville
Children under 6 years - Living with two parents Both parents native 491 100.0% NativeChildren under 6 years - Living with one parent Native parent 279 100.0% NativeForeign-born parent 32 100.0% NativeChildren 6 to 17 years - Living with two parents Both parents native 917 89.2% Native111 10.8% Foreign-bornOne native, one foreign-born parent 21 100.0% NativeChildren 6 to 17 years - Living with one parent Native parent 1,128 100.0% NativeForeign-born parent 117 51.1% Native112 48.9% Foreign-born
Grandparents responsible for own grandchildren in Greeneville
Grandparents (30 to 59 years) White / Caucasian 141 100.0% Not responsible for grandchildrenTwo or more races 29 100.0% Not responsible for grandchildrenWhite alone, not Hispanic / Latino 145 100.0% Not responsible for grandchildrenGrandparents (60 years and over) White / Caucasian 47 29.5% Responsible for grandchildren112 70.5% Not responsible for grandchildrenWhite alone, not Hispanic / Latino 47 29.7% Responsible for grandchildren113 70.3% Not responsible for grandchildren