Races in Greenacres, Florida (FL) Detailed Stats
Data:
Races - White alone (%)
Races - White alone (% change since 2000)
Races - Black alone (%)
Races - Black alone (% change since 2000)
Races - American Indian alone (%)
Races - American Indian alone (% change since 2000)
Races - Asian alone (%)
Races - Asian alone (% change since 2000)
Races - Hispanic (%)
Races - Hispanic (% change since 2000)
Races - Native Hawaiian and Other Pacific Islander alone (%)
Races - Native Hawaiian and Other Pacific Islander alone (% change since 2000)
Races - Two or more races(%)
Races - Two or more races(% change since 2000)
Races - Other race alone (%)
Races - Other race alone (% change since 2000)
Racial diversity
Place of birth - Born in state of residence (%)
Place of birth - Born in state of residence (%) - White
Place of birth - Born in state of residence (%) - Black or African American
Place of birth - Born in state of residence (%) - Asian
Place of birth - Born in state of residence (%) - Hispanic or Latino
Place of birth - Born in state of residence (%) - American Indian and Alaska Native
Place of birth - Born in state of residence (%) - Multirace
Place of birth - Born in state of residence (%) - Other Race
Place of birth - Born in other state (%)
Place of birth - Born in other state (%) - White
Place of birth - Born in other state (%) - Black or African American
Place of birth - Born in other state (%) - Asian
Place of birth - Born in other state (%) - Hispanic or Latino
Place of birth - Born in other state (%) - American Indian and Alaska Native
Place of birth - Born in other state (%) - Multirace
Place of birth - Born in other state (%) - Other Race
Place of birth - Native, outside of US (%)
Place of birth - Native, outside of US (%) - White
Place of birth - Native, outside of US (%) - Black or African American
Place of birth - Native, outside of US (%) - Asian
Place of birth - Native, outside of US (%) - Hispanic or Latino
Place of birth - Native, outside of US (%) - American Indian and Alaska Native
Place of birth - Native, outside of US (%) - Multirace
Place of birth - Native, outside of US (%) - Other Race
Place of birth - Foreign born (%)
Place of birth - Foreign born (%) - White
Place of birth - Foreign born (%) - Black or African American
Place of birth - Foreign born (%) - Asian
Place of birth - Foreign born (%) - Hispanic or Latino
Place of birth - Foreign born (%) - American Indian and Alaska Native
Place of birth - Foreign born (%) - Multirace
Place of birth - Foreign born (%) - Other Race
Residents speaking English at home (%)
Residents speaking English at home - Born in the United States (%)
Residents speaking English at home - Native, born elsewhere (%)
Residents speaking English at home - Foreign born (%)
Residents speaking Spanish at home (%)
Residents speaking Spanish at home - Born in the United States (%)
Residents speaking Spanish at home - Native, born elsewhere (%)
Residents speaking Spanish at home - Foreign born (%)
Residents speaking other language at home (%)
Residents speaking other language at home - Born in the United States (%)
Residents speaking other language at home - Native, born elsewhere (%)
Residents speaking other language at home - Foreign born (%)
Marital status - Never married (%)
Marital status - Now married (%)
Marital status - Separated (%)
Marital status - Widowed (%)
Marital status - Divorced (%)
Ancestries Reported - Arab (%)
Ancestries Reported - Czech (%)
Ancestries Reported - Danish (%)
Ancestries Reported - Dutch (%)
Ancestries Reported - English (%)
Ancestries Reported - French (%)
Ancestries Reported - French Canadian (%)
Ancestries Reported - German (%)
Ancestries Reported - Greek (%)
Ancestries Reported - Hungarian (%)
Ancestries Reported - Irish (%)
Ancestries Reported - Italian (%)
Ancestries Reported - Lithuanian (%)
Ancestries Reported - Norwegian (%)
Ancestries Reported - Polish (%)
Ancestries Reported - Portuguese (%)
Ancestries Reported - Russian (%)
Ancestries Reported - Scotch-Irish (%)
Ancestries Reported - Scottish (%)
Ancestries Reported - Slovak (%)
Ancestries Reported - Subsaharan African (%)
Ancestries Reported - Swedish (%)
Ancestries Reported - Swiss (%)
Ancestries Reported - Ukrainian (%)
Ancestries Reported - United States (%)
Ancestries Reported - Welsh (%)
Ancestries Reported - West Indian (%)
Ancestries Reported - Other (%)
Geographical mobility - Same house 1 year ago (%)
Geographical mobility - Same house 1 year ago (%) - White
Geographical mobility - Same house 1 year ago (%) - Black or African American
Geographical mobility - Same house 1 year ago (%) - Asian
Geographical mobility - Same house 1 year ago (%) - Hispanic or Latino
Geographical mobility - Same house 1 year ago (%) - American Indian and Alaska Native
Geographical mobility - Same house 1 year ago (%) - Multirace
Geographical mobility - Same house 1 year ago (%) - Other Race
Geographical mobility - Moved within same county (%)
Geographical mobility - Moved within same county (%) - White
Geographical mobility - Moved within same county (%) - Black or African American
Geographical mobility - Moved within same county (%) - Asian
Geographical mobility - Moved within same county (%) - Hispanic or Latino
Geographical mobility - Moved within same county (%) - American Indian and Alaska Native
Geographical mobility - Moved within same county (%) - Multirace
Geographical mobility - Moved within same county (%) - Other Race
Geographical mobility - Moved from different county within same state (%)
Geographical mobility - Moved from different county within same state (%) - White
Geographical mobility - Moved from different county within same state (%) - Black or African American
Geographical mobility - Moved from different county within same state (%) - Asian
Geographical mobility - Moved from different county within same state (%) - Hispanic or Latino
Geographical mobility - Moved from different county within same state (%) - American Indian and Alaska Native
Geographical mobility - Moved from different county within same state (%) - Multirace
Geographical mobility - Moved from different county within same state (%) - Other Race
Geographical mobility - Moved from different state (%)
Geographical mobility - Moved from different state (%) - White
Geographical mobility - Moved from different state (%) - Black or African American
Geographical mobility - Moved from different state (%) - Asian
Geographical mobility - Moved from different state (%) - Hispanic or Latino
Geographical mobility - Moved from different state (%) - American Indian and Alaska Native
Geographical mobility - Moved from different state (%) - Multirace
Geographical mobility - Moved from different state (%) - Other Race
Geographical mobility - Moved from abroad (%)
Geographical mobility - Moved from abroad (%) - White
Geographical mobility - Moved from abroad (%) - Black or African American
Geographical mobility - Moved from abroad (%) - Asian
Geographical mobility - Moved from abroad (%) - Hispanic or Latino
Geographical mobility - Moved from abroad (%) - American Indian and Alaska Native
Geographical mobility - Moved from abroad (%) - Multirace
Geographical mobility - Moved from abroad (%) - Other Race
Place of birth for the foreign-born population - Ireland (%)
Place of birth for the foreign-born population - Denmark (%)
Place of birth for the foreign-born population - Norway (%)
Place of birth for the foreign-born population - Sweden (%)
Place of birth for the foreign-born population - United Kingdom (%)
Place of birth for the foreign-born population - England (%)
Place of birth for the foreign-born population - Scotland (%)
Place of birth for the foreign-born population - Other Northern Europe (%)
Place of birth for the foreign-born population - Austria (%)
Place of birth for the foreign-born population - Belgium (%)
Place of birth for the foreign-born population - France (%)
Place of birth for the foreign-born population - Germany (%)
Place of birth for the foreign-born population - Netherlands (%)
Place of birth for the foreign-born population - Switzerland (%)
Place of birth for the foreign-born population - Other Western Europe (%)
Place of birth for the foreign-born population - Greece (%)
Place of birth for the foreign-born population - Italy (%)
Place of birth for the foreign-born population - Portugal (%)
Place of birth for the foreign-born population - Spain (%)
Place of birth for the foreign-born population - Other Southern Europe (%)
Place of birth for the foreign-born population - Albania (%)
Place of birth for the foreign-born population - Belarus (%)
Place of birth for the foreign-born population - Bosnia and Herzegovina (%)
Place of birth for the foreign-born population - Bulgaria (%)
Place of birth for the foreign-born population - Croatia (%)
Place of birth for the foreign-born population - Czechoslovakia (%)
Place of birth for the foreign-born population - Hungary (%)
Place of birth for the foreign-born population - Latvia (%)
Place of birth for the foreign-born population - Lithuania (%)
Place of birth for the foreign-born population - North Macedonia (Macedonia) (%)
Place of birth for the foreign-born population - Moldova (%)
Place of birth for the foreign-born population - Poland (%)
Place of birth for the foreign-born population - Romania (%)
Place of birth for the foreign-born population - Russia (%)
Place of birth for the foreign-born population - Serbia (%)
Place of birth for the foreign-born population - Ukraine (%)
Place of birth for the foreign-born population - Other Eastern Europe (%)
Place of birth for the foreign-born population - China (%)
Place of birth for the foreign-born population - Hong Kong (%)
Place of birth for the foreign-born population - Taiwan (%)
Place of birth for the foreign-born population - Japan (%)
Place of birth for the foreign-born population - Korea (%)
Place of birth for the foreign-born population - Other Eastern Asia (%)
Place of birth for the foreign-born population - Afghanistan (%)
Place of birth for the foreign-born population - Bangladesh (%)
Place of birth for the foreign-born population - India (%)
Place of birth for the foreign-born population - Iran (%)
Place of birth for the foreign-born population - Kazakhstan (%)
Place of birth for the foreign-born population - Nepal (%)
Place of birth for the foreign-born population - Pakistan (%)
Place of birth for the foreign-born population - Sri Lanka (%)
Place of birth for the foreign-born population - Uzbekistan (%)
Place of birth for the foreign-born population - Other South Central Asia (%)
Place of birth for the foreign-born population - Burma (%)
Place of birth for the foreign-born population - Cambodia (%)
Place of birth for the foreign-born population - Indonesia (%)
Place of birth for the foreign-born population - Laos (%)
Place of birth for the foreign-born population - Malaysia (%)
Place of birth for the foreign-born population - Philippines (%)
Place of birth for the foreign-born population - Singapore (%)
Place of birth for the foreign-born population - Thailand (%)
Place of birth for the foreign-born population - Vietnam (%)
Place of birth for the foreign-born population - Other South Eastern Asia (%)
Place of birth for the foreign-born population - Armenia (%)
Place of birth for the foreign-born population - Iraq (%)
Place of birth for the foreign-born population - Israel (%)
Place of birth for the foreign-born population - Jordan (%)
Place of birth for the foreign-born population - Kuwait (%)
Place of birth for the foreign-born population - Lebanon (%)
Place of birth for the foreign-born population - Saudi Arabia (%)
Place of birth for the foreign-born population - Syria (%)
Place of birth for the foreign-born population - Turkey (%)
Place of birth for the foreign-born population - Yemen (%)
Place of birth for the foreign-born population - Other Western Asia (%)
Place of birth for the foreign-born population - Eritrea (%)
Place of birth for the foreign-born population - Ethiopia (%)
Place of birth for the foreign-born population - Kenya (%)
Place of birth for the foreign-born population - Somalia (%)
Place of birth for the foreign-born population - Uganda (%)
Place of birth for the foreign-born population - Zimbabwe (%)
Place of birth for the foreign-born population - Other Eastern Africa (%)
Place of birth for the foreign-born population - Cameroon (%)
Place of birth for the foreign-born population - Congo (%)
Place of birth for the foreign-born population - Democratic Republic of Congo (Zaire) (%)
Place of birth for the foreign-born population - Other Middle Africa (%)
Place of birth for the foreign-born population - Egypt (%)
Place of birth for the foreign-born population - Morocco (%)
Place of birth for the foreign-born population - Sudan (%)
Place of birth for the foreign-born population - Other Northern Africa (%)
Place of birth for the foreign-born population - South Africa (%)
Place of birth for the foreign-born population - Other Southern Africa (%)
Place of birth for the foreign-born population - Cabo Verde (%)
Place of birth for the foreign-born population - Ghana (%)
Place of birth for the foreign-born population - Liberia (%)
Place of birth for the foreign-born population - Nigeria (%)
Place of birth for the foreign-born population - Senegal (%)
Place of birth for the foreign-born population - Sierra Leone (%)
Place of birth for the foreign-born population - Other Western Africa (%)
Place of birth for the foreign-born population - Australia (%)
Place of birth for the foreign-born population - New Zealand (%)
Place of birth for the foreign-born population - Fiji (%)
Place of birth for the foreign-born population - Micronesia (%)
Place of birth for the foreign-born population - Bahamas (%)
Place of birth for the foreign-born population - Barbados (%)
Place of birth for the foreign-born population - Cuba (%)
Place of birth for the foreign-born population - Dominica (%)
Place of birth for the foreign-born population - Dominican Republic (%)
Place of birth for the foreign-born population - Grenada (%)
Place of birth for the foreign-born population - Haiti (%)
Place of birth for the foreign-born population - Jamaica (%)
Place of birth for the foreign-born population - St. Vincent and the Grenadines (%)
Place of birth for the foreign-born population - Trinidad and Tobago (%)
Place of birth for the foreign-born population - West Indies (%)
Place of birth for the foreign-born population - Other Caribbean (%)
Place of birth for the foreign-born population - Belize (%)
Place of birth for the foreign-born population - Costa Rica (%)
Place of birth for the foreign-born population - El Salvador (%)
Place of birth for the foreign-born population - Guatemala (%)
Place of birth for the foreign-born population - Honduras (%)
Place of birth for the foreign-born population - Mexico (%)
Place of birth for the foreign-born population - Nicaragua (%)
Place of birth for the foreign-born population - Panama (%)
Place of birth for the foreign-born population - Other Central America (%)
Place of birth for the foreign-born population - Argentina (%)
Place of birth for the foreign-born population - Bolivia (%)
Place of birth for the foreign-born population - Brazil (%)
Place of birth for the foreign-born population - Chile (%)
Place of birth for the foreign-born population - Colombia (%)
Place of birth for the foreign-born population - Ecuador (%)
Place of birth for the foreign-born population - Guyana (%)
Place of birth for the foreign-born population - Peru (%)
Place of birth for the foreign-born population - Uruguay (%)
Place of birth for the foreign-born population - Venezuela (%)
Place of birth for the foreign-born population - Other South America (%)
Place of birth for the foreign-born population - Canada (%)
Place of birth for the foreign-born population - Other Northern America (%)
Place of birth for the foreign-born population - Other (%)
Latest news about races in Greenacres, FL collected exclusively by city-data.com from local newspapers, TV, and radio stations
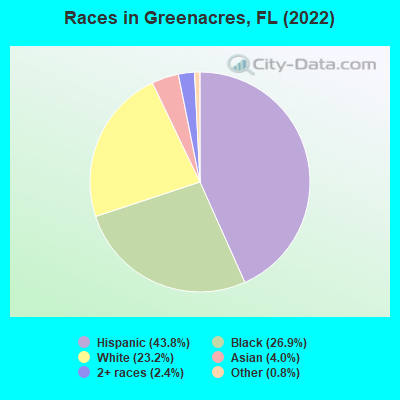
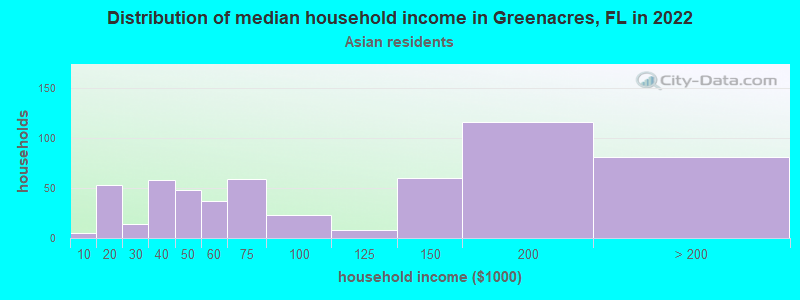
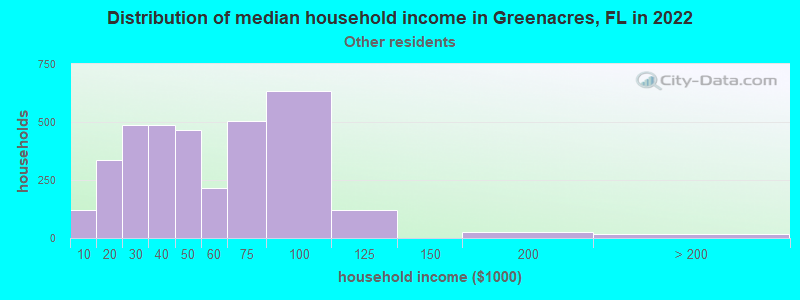
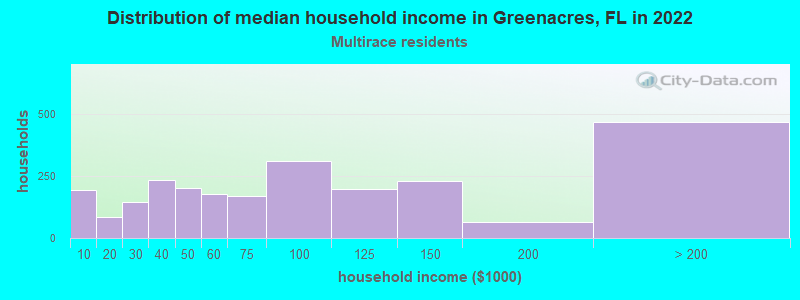
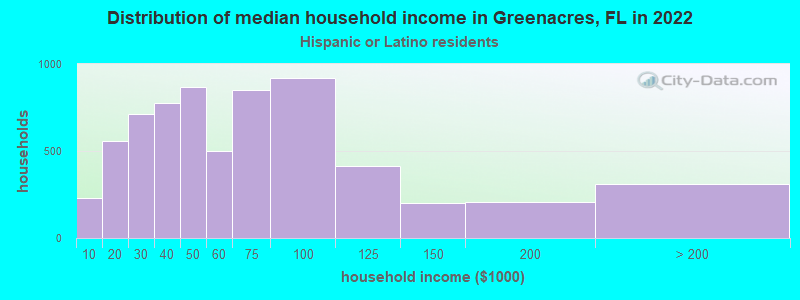
According to 2022 data, the most numerous races in Greenacres, FL are White alone (10,279 residents), Hispanic (19,418 residents), and Black alone (11,923 residents). 44.3% of Greenacres residents speak English at home. 43.2% of Greenacres, FL residents are foreign-born (38.0% born in Latin America), which is 51.4% greater than the foreign-born rate of 21.0% across the entire state of Florida.
Race distribution in Greenacres
2000 2022
10,458,509 65.4% White alone 2,682,715 16.8% Hispanic 2,264,268 14.2% Black alone 261,693 1.6% Asian alone 236,954 1.5% Two or more races 42,358 0.3% American Indian alone 28,994 0.2% Other race alone 6,887 0.04% Native Hawaiian and Other
11,309,403 50.8% White alone 6,025,039 27.1% Hispanic 3,241,015 14.6% Black alone 861,630 3.9% Two or more races 623,692 2.8% Asian alone 152,054 0.7% Other race alone 22,504 0.1% American Indian alone 9,486 0.04% Native Hawaiian and Other
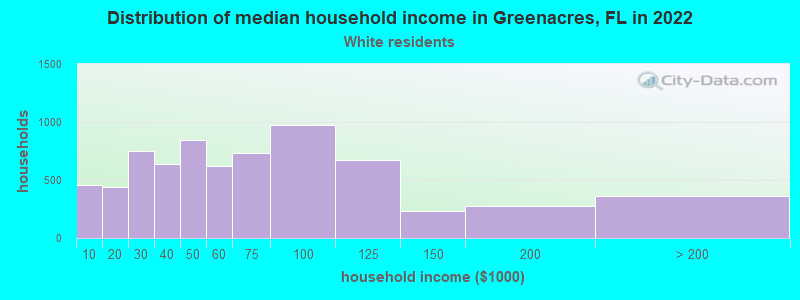
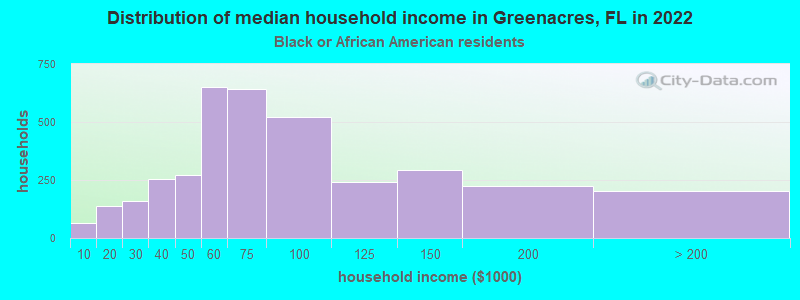
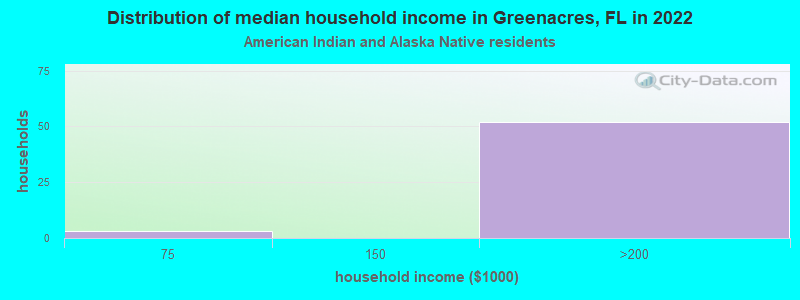
Income and house value in Greenacres Median household income in 2022 $55,925 White non-Hispanic householders$66,309 Black householders$86,784 Asian householders$44,826 Some other race householders$75,683 Two or more races householders$52,881 Hispanic or Latino race householdersMedian 2022 house value $313,636 White Non-Hispanic householders$394,774 Black or African American householders$272,885 American Indian or Alaska Native householders $470,090 Asian householders$276,887 Some other race householders$320,913 Two or more races householders$288,166 Hispanic or Latino householders
Median age by race in Greenacres
48.8 Median age for White residents49.7 48.0 35.5 Median age for Black or African American residents32.3 37.6 36.8 Median age for American Indian / Alaska Native residents-806,112,702.2 57.0 37.4 Median age for Asian residents36.7 38.5 -674,285,713.6 Median age for Native Hawaiian / Pacific Islander residents-674,264,006.9 -672,397,325.0 38.6 Median age for Other race residents36.0 41.3 34.1 Median age for Two or more races residents32.9 36.8 59.0 Median age for White alone residents58.6 59.9 35.7 Median age for Hispanic or Latino residents35.2 37.1
Owner/renter occupied households by race in Greenacres
House owners and renters - White residents 4,741 67.1% Owner occupied2,325 32.9% Renter occupiedHouse owners and renters - Black or African American residents 1,995 55.5% Owner occupied1,599 44.5% Renter occupiedHouse owners and renters - American Indian / Alaska Native residents 27 100.0% Owner occupiedHouse owners and renters - Asian residents 471 85.4% Owner occupied81 14.6% Renter occupiedHouse owners and renters - Other race residents 2,215 62.5% Owner occupied1,328 37.5% Renter occupiedHouse owners and renters - Two or more races residents 1,767 71.8% Owner occupied693 28.2% Renter occupiedHouse owners and renters - White alone residents 3,741 71.2% Owner occupied1,515 28.8% Renter occupiedHouse owners and renters - Hispanic or Latino residents 3,973 60.0% Owner occupied2,649 40.0% Renter occupied
Language usage in Greenacres
English speakers - Total 44.3% of residents of Greenacres speak English at home.
38.8% of residents speak Spanish at home 7,704 47.9% Speak English very well8,396 52.1% Speak English less than very well17.3% of residents speak other language at home 4,411 61.6% Speak English very well2,752 38.4% Speak English less than very well
English speakers - Born in the United States 84.5% of residents of Greenacres speak English at home.
11.6% of residents speak Spanish at home 1,032 90.5% Speak English very well108 9.5% Speak English less than very well3.5% of residents speak other language at home 329 96.5% Speak English very well12 3.5% Speak English less than very well
English speakers - Native, born elsewhere 21.1% of residents of Greenacres speak English at home.
74.3% of residents speak Spanish at home 860 55.8% Speak English very well681 44.2% Speak English less than very well1.8% of residents speak other language at home 37 100.0% Speak English very well
English speakers - Foreign-born 15.9% of residents of Greenacres speak English at home.
55.9% of residents speak Spanish at home 3,361 31.7% Speak English very well7,250 68.3% Speak English less than very well28.2% of residents speak other language at home 2,718 50.7% Speak English very well2,638 49.3% Speak English less than very well
White (Caucasian) - Speak only English Native:
79.3% (9,226)Foreign-born:
18.5% (554)
White (Caucasian) - Speak another language Native:
15.1% (1,759)Foreign-born:
74.6% (2,240)
Black or African American - Speak only English Native:
70.1% (3,634)Foreign-born:
31.5% (1,888)
Black or African American - Speak another language Native:
30.6% (1,583)Foreign-born:
68.5% (4,102)
American Indian / Alaska Native - Speak only English Native:
15.5% (11)Foreign-born:
7.2% (3)
American Indian / Alaska Native - Speak another language Native:
91.6% (67)Foreign-born:
100.0% (36)
Asian - Speak only English Native:
74.1% (383)Foreign-born:
26.1% (291)
Asian - Speak another language Native:
28.2% (146)Foreign-born:
73.9% (825)
Other race - Speak only English Native:
25.3% (871)Foreign-born:
1.2% (81)
Other race - Speak another language Native:
74.0% (2,549)Foreign-born:
99.1% (6,629)
Two or more races - Speak only English Native:
53.2% (1,584)Foreign-born:
5.4% (198)
Two or more races - Speak another language Native:
46.8% (1,393)Foreign-born:
95.0% (3,475)
White alone - Speak only English Native:
94.5% (8,479)Foreign-born:
40.6% (387)
White alone - Speak another language Native:
5.3% (479)Foreign-born:
59.5% (568)
Hispanic or Latino - Speak only English Native:
31.0% (2,282)Foreign-born:
2.6% (276)
Hispanic or Latino - Speak another language Native:
68.8% (5,063)Foreign-born:
97.5% (10,525)
Foreign-born residents in Greenacres 19,150 residents are foreign born (38.0% Latin America ).
This city:
43.2%Florida:
21.1%
Marital status for residents in Greenacres Marital status - White (Caucasian) population 15 years and over
Males 32.2% Never married46.6% Now married1.7% Separated4.0% Widowed15.4% DivorcedFemales 27.8% Never married36.8% Now married3.2% Separated15.5% Widowed16.7% DivorcedWomen who gave birth in the past 12 months Now married:
65.3% (154)Unmarried:
34.7% (82)
Women who did not give birth in the past 12 months Now married:
39.8% (1,307)Unmarried:
60.2% (1,976)
Marital status - Black or African American population 15 years and over
Males 43.6% Never married39.0% Now married7.1% Separated1.7% Widowed8.6% DivorcedFemales 46.7% Never married33.9% Now married5.4% Separated5.7% Widowed8.2% DivorcedWomen who gave birth in the past 12 months Now married:
25.0% (45)Unmarried:
75.0% (135)
Women who did not give birth in the past 12 months Now married:
40.3% (1,203)Unmarried:
59.7% (1,784)
Marital status - American Indian / Alaska Native population 15 years and over
Males 100.0% Never married0.0% Now married0.0% Separated0.0% Widowed0.0% DivorcedFemales 0.0% Never married4.9% Now married0.0% Separated95.1% Widowed0.0% DivorcedMarital status - Asian population 15 years and over
Males 37.0% Never married51.2% Now married0.0% Separated0.0% Widowed11.8% DivorcedFemales 19.2% Never married45.3% Now married1.8% Separated19.3% Widowed14.4% DivorcedWomen who gave birth in the past 12 months Now married:
100.0% (15)Unmarried:
0.0% (0)
Women who did not give birth in the past 12 months Now married:
50.4% (172)Unmarried:
49.6% (169)
Marital status - Other race population 15 years and over
Males 42.6% Never married51.2% Now married0.3% Separated0.5% Widowed5.5% DivorcedFemales 23.1% Never married57.1% Now married3.5% Separated3.8% Widowed12.5% DivorcedWomen who gave birth in the past 12 months Now married:
100.0% (24)Unmarried:
0.0% (0)
Women who did not give birth in the past 12 months Now married:
54.1% (1,255)Unmarried:
45.9% (1,063)
Marital status - Two or more races population 15 years and over
Males 39.0% Never married43.1% Now married4.3% Separated1.2% Widowed12.5% DivorcedFemales 31.6% Never married31.8% Now married4.8% Separated2.8% Widowed29.0% DivorcedWomen who gave birth in the past 12 months Now married:
0.0% (0)Unmarried:
100.0% (21)
Women who did not give birth in the past 12 months Now married:
33.4% (623)Unmarried:
66.6% (1,244)
Marital status - White alone, not Hispanic / Latino population 15 years and over
Males 25.6% Never married48.1% Now married0.6% Separated5.9% Widowed19.9% DivorcedFemales 22.6% Never married36.7% Now married1.9% Separated20.2% Widowed18.6% DivorcedWomen who gave birth in the past 12 months Now married:
100.0% (35)Unmarried:
0.0% (0)
Women who did not give birth in the past 12 months Now married:
37.8% (647)Unmarried:
62.2% (1,065)
Marital status - Hispanic or Latino population 15 years and over
Males 41.7% Never married47.8% Now married2.0% Separated0.6% Widowed7.9% DivorcedFemales 31.9% Never married42.4% Now married4.8% Separated5.6% Widowed15.4% DivorcedWomen who gave birth in the past 12 months Now married:
54.0% (168)Unmarried:
46.0% (143)
Women who did not give birth in the past 12 months Now married:
43.6% (2,120)Unmarried:
56.4% (2,744)
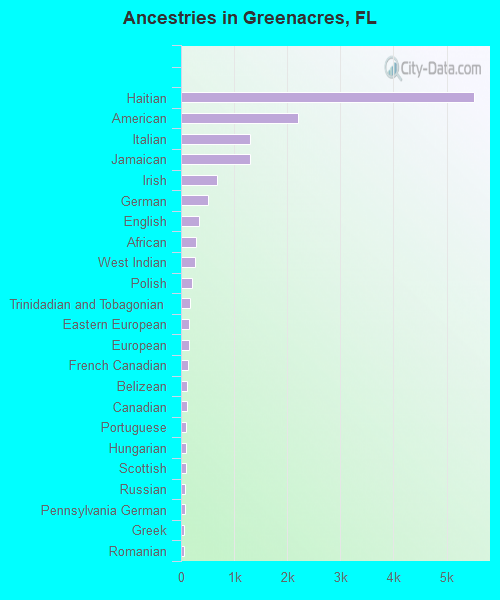
Ancestries in Greenacres
5,524 17.8% Haitian2,211 7.1% American1,300 4.2% Italian1,292 4.2% Jamaican677 2.2% Irish509 1.6% German347 1.1% English275 0.9% African257 0.8% West Indian211 0.7% Polish164 0.5% Trinidadian and Tobagonian153 0.5% Eastern European145 0.5% European141 0.5% French Canadian112 0.4% Belizean111 0.4% Canadian98 0.3% Portuguese97 0.3% Hungarian92 0.3% Scottish81 0.3% Russian73 0.2% Pennsylvania German56 0.2% Greek55 0.2% Romanian42 0.1% Armenian40 0.1% Brazilian37 0.1% Ghanaian34 0.1% Estonian33 0.1% Swedish30 0.10% Dutch29 0.09% Norwegian29 0.09% Iranian28 0.09% Macedonian27 0.09% French26 0.08% Lebanese25 0.08% Ukrainian20 0.06% Finnish18 0.06% British16 0.05% Scotch-Irish15 0.05% Austrian15 0.05% Celtic11 0.04% Turkish11 0.04% Barbadian10 0.03% Israeli10 0.03% Welsh6 0.02% Slovak3 0.01% Arab2 0.01% Bahamian
Geographical mobility in Greenacres Same house 1 year ago 13,972 87.6% White (Caucasian)10,496 87.2% Black or African American138 100.0% American Indian / Alaska Native1,678 94.9% Asian9,392 86.9% Other race5,394 78.8% Two or more races8,895 87.3% White alone, not Hispanic / Latino16,359 85.3% Hispanic or LatinoMoved within same county 989 6.2% White / Caucasian1,181 9.8% Black or African American26 1.5% Asian700 6.5% Other race656 9.6% Two or more races560 5.5% White alone, not Hispanic / Latino1,691 8.8% Hispanic or LatinoMoved within same state 299 1.9% White / Caucasian213 1.8% Black or African American187 1.7% Other race159 2.3% Two or more races274 2.7% White alone, not Hispanic / Latino226 1.2% Hispanic or LatinoMoved from different state 422 2.6% White / Caucasian37 2.1% Asian184 1.7% Other race109 1.6% Two or more races399 3.9% White alone, not Hispanic / Latino222 1.2% Hispanic or LatinoMoved from abroad 155 1.0% White147 1.2% Black or African American365 3.4% Other race473 6.9% Two or more races60 0.6% White alone, not Hispanic / Latino760 4.0% Hispanic or Latino
Children Nativity (place of birth) in Greenacres
Children under 6 years - Living with two parents Both parents native 459 99.8% Native1 0.2% Foreign-bornBoth parents foreign-born 1,117 94.4% Native67 5.6% Foreign-bornOne native, one foreign-born parent 74 100.0% NativeChildren under 6 years - Living with one parent Native parent 283 100.0% NativeForeign-born parent 1,023 93.4% Native72 6.6% Foreign-bornChildren 6 to 17 years - Living with two parents Both parents native 625 100.0% NativeBoth parents foreign-born 1,758 86.1% Native283 13.9% Foreign-bornOne native, one foreign-born parent 249 100.0% NativeChildren 6 to 17 years - Living with one parent Native parent 775 100.0% NativeForeign-born parent 1,534 54.7% Native1,268 45.3% Foreign-born
Place of birth for residents in Greenacres 17,466 Americas17,162 Latin America9,178 Caribbean4,339 South America3,644 Central America988 Asia654 Europe419 South Central Asia418 South Eastern Asia304 Northern America250 Eastern Europe184 Southern Europe156 Western Europe95 Eastern Asia64 Northern Europe64 China54 Western Asia40 Africa32 Western Africa8 Eastern Africa4,034 Haiti2,520 Cuba1,769 Colombia1,466 Jamaica1,172 Mexico1,025 Honduras853 Peru644 Guatemala614 Venezuela462 Trinidad and Tobago413 Dominican Republic401 El Salvador304 Canada254 Bolivia229 Nicaragua224 Philippines215 Bangladesh208 Uruguay189 Argentina179 India156 Ecuador109 Chile105 Belize93 Guyana92 Poland87 Barbados85 Vietnam84 Germany83 Thailand77 Italy66 Costa Rica65 Brazil62 China53 Spain52 Romania51 Dominica44 United Kingdom41 Netherlands40 Latvia39 West Indies37 Portugal32 Ghana32 Lebanon31 Korea24 Nepal24 Burma (Myanmar)22 St. Vincent and the Grenadines20 Belgium19 England18 Ukraine15 Greece14 Turkey10 Bahamas8 Austria8 Iraq6 Hungary2 Taiwan1 Russia1 France
Grandparents responsible for own grandchildren in Greenacres
Grandparents (30 to 59 years) White / Caucasian 24 30.3% Responsible for grandchildren54 69.7% Not responsible for grandchildrenBlack or African American 11 6.5% Responsible for grandchildren151 93.5% Not responsible for grandchildrenOther race 47 100.0% Not responsible for grandchildrenTwo or more races 18 100.0% Not responsible for grandchildrenWhite alone, not Hispanic / Latino 7 18.5% Responsible for grandchildren31 81.5% Not responsible for grandchildrenHispanic or Latino 24 17.8% Responsible for grandchildren112 82.2% Not responsible for grandchildrenGrandparents (60 years and over) White / Caucasian 8 9.9% Responsible for grandchildren71 90.1% Not responsible for grandchildrenBlack or African American 80 48.7% Responsible for grandchildren84 51.3% Not responsible for grandchildrenOther race 83 85.6% Responsible for grandchildren14 14.4% Not responsible for grandchildrenTwo or more races 79 43.9% Responsible for grandchildren101 56.1% Not responsible for grandchildrenWhite alone, not Hispanic / Latino 9 50.6% Responsible for grandchildren9 49.4% Not responsible for grandchildrenHispanic or Latino 124 36.3% Responsible for grandchildren218 63.7% Not responsible for grandchildren