Races in Greater Landover, Maryland (MD) Detailed Stats
Ancestries, Foreign-born residents, place of birth

Discuss Greater Landover, Maryland races on our local forum with over 2,400,000 registered users
7.9% of Greater Landover, MD residents are foreign-born (4.1% born in Africa, 3.2% born in Latin America), which is 103.6% less than the foreign-born rate of 16.0% across the entire state of Maryland.
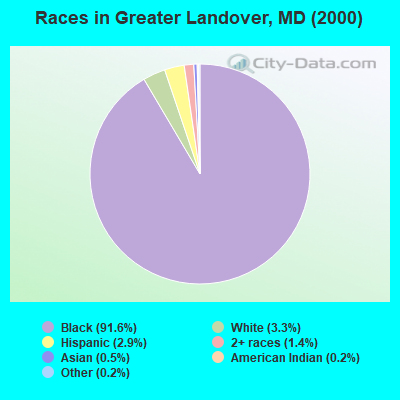
Race distribution in Greater Landover

- 20,96791.6%Black alone
- 7613.3%White alone
- 6632.9%Hispanic
- 3151.4%Two or more races
- 1170.5%Asian alone
- 350.2%Other race alone
- 420.2%American Indian alone
2000
2022
-
- 3,286,54762.1%White alone
- 1,464,73527.7%Black alone
- 227,9164.3%Hispanic
- 209,7384.0%Asian alone
- 82,9461.6%Two or more races
- 13,3120.3%American Indian alone
- 9,3790.2%Other race alone
- 1,9130.04%Native Hawaiian and Other
Pacific Islander alone

-
- 2,906,49247.1%White alone
- 1,800,91429.2%Black alone
- 705,84211.4%Hispanic
- 401,8186.5%Asian alone
- 291,3174.7%Two or more races
- 46,9300.8%Other race alone
- 8,9300.1%American Indian alone
- 2,4170.04%Native Hawaiian and Other
Pacific Islander alone

Income and house value in Greater Landover
- Median household income in 2022
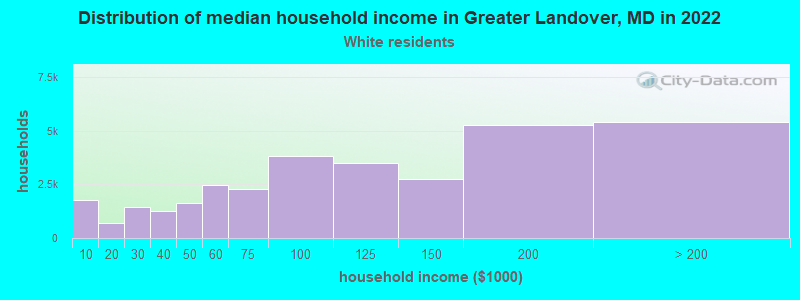
- $66,589White non-Hispanic householders
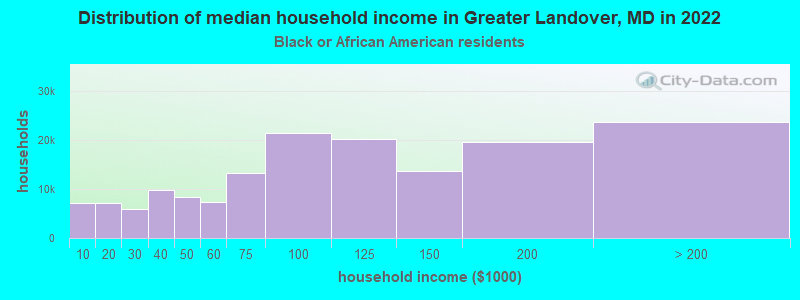
- $67,885Black householders
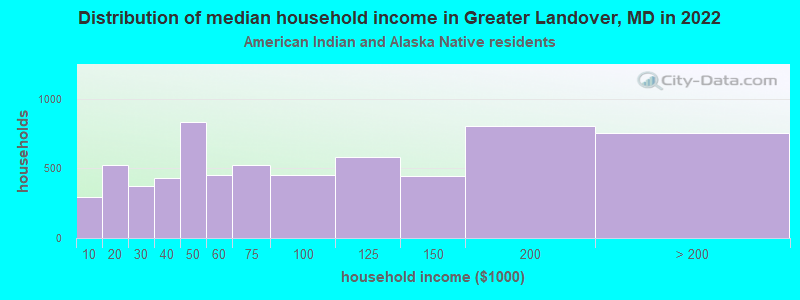
- $108,139American Indian and Alaska Native householders
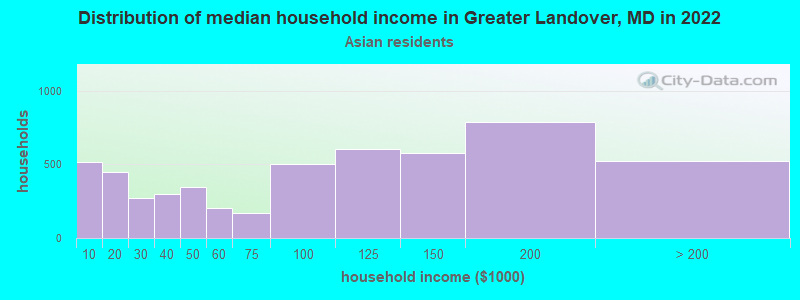
- $37,014Asian householders
- $62,721Some other race householders
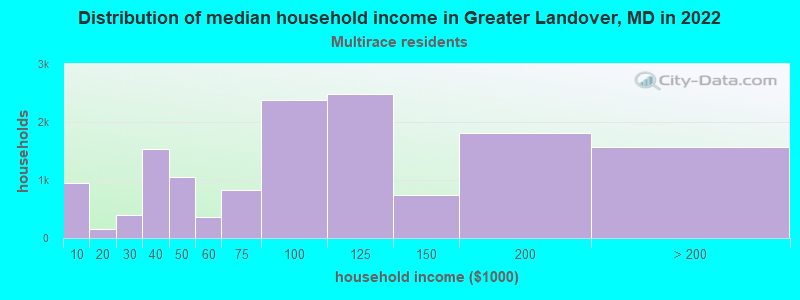
- $64,881Two or more races householders
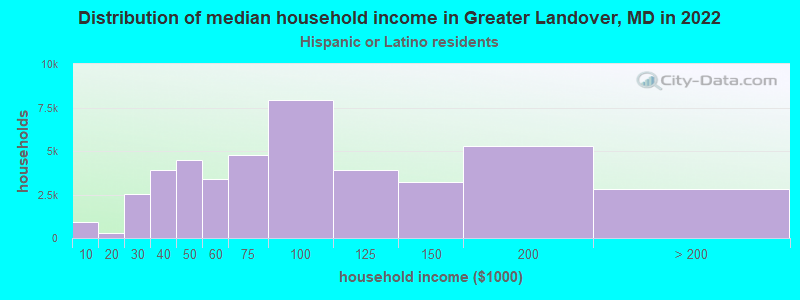
- $70,489Hispanic or Latino race householders
- Median 2022 house value
- $305,312White Non-Hispanic householders
- $259,287Black or African American householders
- $643,215American Indian or Alaska Native householders
- $393,075Asian householders
- $271,579Some other race householders
- $318,748Two or more races householders
- $313,317Hispanic or Latino householders
Household income for White non-Hispanic householders
Household income for Black householders
Household income for American Indian and Alaska Native householders
Household income for Asian householders
Household income for Native Hawaiian and other Pacific Islander householders

Household income for Two or more races householders
Household income for Hispanic or Latino race householders
Foreign-born residents in Greater Landover
1,800 residents are foreign born (4.1% Africa, 3.2% Latin America).
| This city: | 7.9% |
| Maryland: | 9.8% |
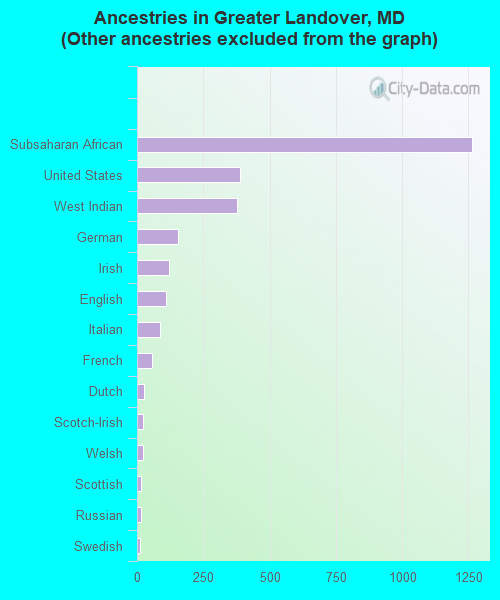
Ancestries in Greater Landover

- 17,25986.5%Other
- 1,2656.3%Subsaharan African
- 3891.9%United States
- 3771.9%West Indian
- 1530.8%German
- 1190.6%Irish
- 1090.5%English
- 880.4%Italian
- 570.3%French
- 280.1%Dutch
- 240.1%Scotch-Irish
- 230.1%Welsh
- 160.08%Scottish
- 150.08%Russian
- 120.06%Swedish
- 100.05%Arab
- 70.04%Swiss
- 70.04%Ukrainian
Zip codes: 20785.