Races in Great Falls, Virginia (VA) Detailed Stats
Data:
Races - White alone (%)
Races - White alone (% change since 2000)
Races - Black alone (%)
Races - Black alone (% change since 2000)
Races - American Indian alone (%)
Races - American Indian alone (% change since 2000)
Races - Asian alone (%)
Races - Asian alone (% change since 2000)
Races - Hispanic (%)
Races - Hispanic (% change since 2000)
Races - Native Hawaiian and Other Pacific Islander alone (%)
Races - Native Hawaiian and Other Pacific Islander alone (% change since 2000)
Races - Two or more races(%)
Races - Two or more races(% change since 2000)
Races - Other race alone (%)
Races - Other race alone (% change since 2000)
Racial diversity
Place of birth - Born in state of residence (%)
Place of birth - Born in state of residence (%) - White
Place of birth - Born in state of residence (%) - Black or African American
Place of birth - Born in state of residence (%) - Asian
Place of birth - Born in state of residence (%) - Hispanic or Latino
Place of birth - Born in state of residence (%) - American Indian and Alaska Native
Place of birth - Born in state of residence (%) - Multirace
Place of birth - Born in state of residence (%) - Other Race
Place of birth - Born in other state (%)
Place of birth - Born in other state (%) - White
Place of birth - Born in other state (%) - Black or African American
Place of birth - Born in other state (%) - Asian
Place of birth - Born in other state (%) - Hispanic or Latino
Place of birth - Born in other state (%) - American Indian and Alaska Native
Place of birth - Born in other state (%) - Multirace
Place of birth - Born in other state (%) - Other Race
Place of birth - Native, outside of US (%)
Place of birth - Native, outside of US (%) - White
Place of birth - Native, outside of US (%) - Black or African American
Place of birth - Native, outside of US (%) - Asian
Place of birth - Native, outside of US (%) - Hispanic or Latino
Place of birth - Native, outside of US (%) - American Indian and Alaska Native
Place of birth - Native, outside of US (%) - Multirace
Place of birth - Native, outside of US (%) - Other Race
Place of birth - Foreign born (%)
Place of birth - Foreign born (%) - White
Place of birth - Foreign born (%) - Black or African American
Place of birth - Foreign born (%) - Asian
Place of birth - Foreign born (%) - Hispanic or Latino
Place of birth - Foreign born (%) - American Indian and Alaska Native
Place of birth - Foreign born (%) - Multirace
Place of birth - Foreign born (%) - Other Race
Residents speaking English at home (%)
Residents speaking English at home - Born in the United States (%)
Residents speaking English at home - Native, born elsewhere (%)
Residents speaking English at home - Foreign born (%)
Residents speaking Spanish at home (%)
Residents speaking Spanish at home - Born in the United States (%)
Residents speaking Spanish at home - Native, born elsewhere (%)
Residents speaking Spanish at home - Foreign born (%)
Residents speaking other language at home (%)
Residents speaking other language at home - Born in the United States (%)
Residents speaking other language at home - Native, born elsewhere (%)
Residents speaking other language at home - Foreign born (%)
Marital status - Never married (%)
Marital status - Now married (%)
Marital status - Separated (%)
Marital status - Widowed (%)
Marital status - Divorced (%)
Ancestries Reported - Arab (%)
Ancestries Reported - Czech (%)
Ancestries Reported - Danish (%)
Ancestries Reported - Dutch (%)
Ancestries Reported - English (%)
Ancestries Reported - French (%)
Ancestries Reported - French Canadian (%)
Ancestries Reported - German (%)
Ancestries Reported - Greek (%)
Ancestries Reported - Hungarian (%)
Ancestries Reported - Irish (%)
Ancestries Reported - Italian (%)
Ancestries Reported - Lithuanian (%)
Ancestries Reported - Norwegian (%)
Ancestries Reported - Polish (%)
Ancestries Reported - Portuguese (%)
Ancestries Reported - Russian (%)
Ancestries Reported - Scotch-Irish (%)
Ancestries Reported - Scottish (%)
Ancestries Reported - Slovak (%)
Ancestries Reported - Subsaharan African (%)
Ancestries Reported - Swedish (%)
Ancestries Reported - Swiss (%)
Ancestries Reported - Ukrainian (%)
Ancestries Reported - United States (%)
Ancestries Reported - Welsh (%)
Ancestries Reported - West Indian (%)
Ancestries Reported - Other (%)
Geographical mobility - Same house 1 year ago (%)
Geographical mobility - Same house 1 year ago (%) - White
Geographical mobility - Same house 1 year ago (%) - Black or African American
Geographical mobility - Same house 1 year ago (%) - Asian
Geographical mobility - Same house 1 year ago (%) - Hispanic or Latino
Geographical mobility - Same house 1 year ago (%) - American Indian and Alaska Native
Geographical mobility - Same house 1 year ago (%) - Multirace
Geographical mobility - Same house 1 year ago (%) - Other Race
Geographical mobility - Moved within same county (%)
Geographical mobility - Moved within same county (%) - White
Geographical mobility - Moved within same county (%) - Black or African American
Geographical mobility - Moved within same county (%) - Asian
Geographical mobility - Moved within same county (%) - Hispanic or Latino
Geographical mobility - Moved within same county (%) - American Indian and Alaska Native
Geographical mobility - Moved within same county (%) - Multirace
Geographical mobility - Moved within same county (%) - Other Race
Geographical mobility - Moved from different county within same state (%)
Geographical mobility - Moved from different county within same state (%) - White
Geographical mobility - Moved from different county within same state (%) - Black or African American
Geographical mobility - Moved from different county within same state (%) - Asian
Geographical mobility - Moved from different county within same state (%) - Hispanic or Latino
Geographical mobility - Moved from different county within same state (%) - American Indian and Alaska Native
Geographical mobility - Moved from different county within same state (%) - Multirace
Geographical mobility - Moved from different county within same state (%) - Other Race
Geographical mobility - Moved from different state (%)
Geographical mobility - Moved from different state (%) - White
Geographical mobility - Moved from different state (%) - Black or African American
Geographical mobility - Moved from different state (%) - Asian
Geographical mobility - Moved from different state (%) - Hispanic or Latino
Geographical mobility - Moved from different state (%) - American Indian and Alaska Native
Geographical mobility - Moved from different state (%) - Multirace
Geographical mobility - Moved from different state (%) - Other Race
Geographical mobility - Moved from abroad (%)
Geographical mobility - Moved from abroad (%) - White
Geographical mobility - Moved from abroad (%) - Black or African American
Geographical mobility - Moved from abroad (%) - Asian
Geographical mobility - Moved from abroad (%) - Hispanic or Latino
Geographical mobility - Moved from abroad (%) - American Indian and Alaska Native
Geographical mobility - Moved from abroad (%) - Multirace
Geographical mobility - Moved from abroad (%) - Other Race
Place of birth for the foreign-born population - Ireland (%)
Place of birth for the foreign-born population - Denmark (%)
Place of birth for the foreign-born population - Norway (%)
Place of birth for the foreign-born population - Sweden (%)
Place of birth for the foreign-born population - United Kingdom (%)
Place of birth for the foreign-born population - England (%)
Place of birth for the foreign-born population - Scotland (%)
Place of birth for the foreign-born population - Other Northern Europe (%)
Place of birth for the foreign-born population - Austria (%)
Place of birth for the foreign-born population - Belgium (%)
Place of birth for the foreign-born population - France (%)
Place of birth for the foreign-born population - Germany (%)
Place of birth for the foreign-born population - Netherlands (%)
Place of birth for the foreign-born population - Switzerland (%)
Place of birth for the foreign-born population - Other Western Europe (%)
Place of birth for the foreign-born population - Greece (%)
Place of birth for the foreign-born population - Italy (%)
Place of birth for the foreign-born population - Portugal (%)
Place of birth for the foreign-born population - Spain (%)
Place of birth for the foreign-born population - Other Southern Europe (%)
Place of birth for the foreign-born population - Albania (%)
Place of birth for the foreign-born population - Belarus (%)
Place of birth for the foreign-born population - Bosnia and Herzegovina (%)
Place of birth for the foreign-born population - Bulgaria (%)
Place of birth for the foreign-born population - Croatia (%)
Place of birth for the foreign-born population - Czechoslovakia (%)
Place of birth for the foreign-born population - Hungary (%)
Place of birth for the foreign-born population - Latvia (%)
Place of birth for the foreign-born population - Lithuania (%)
Place of birth for the foreign-born population - North Macedonia (Macedonia) (%)
Place of birth for the foreign-born population - Moldova (%)
Place of birth for the foreign-born population - Poland (%)
Place of birth for the foreign-born population - Romania (%)
Place of birth for the foreign-born population - Russia (%)
Place of birth for the foreign-born population - Serbia (%)
Place of birth for the foreign-born population - Ukraine (%)
Place of birth for the foreign-born population - Other Eastern Europe (%)
Place of birth for the foreign-born population - China (%)
Place of birth for the foreign-born population - Hong Kong (%)
Place of birth for the foreign-born population - Taiwan (%)
Place of birth for the foreign-born population - Japan (%)
Place of birth for the foreign-born population - Korea (%)
Place of birth for the foreign-born population - Other Eastern Asia (%)
Place of birth for the foreign-born population - Afghanistan (%)
Place of birth for the foreign-born population - Bangladesh (%)
Place of birth for the foreign-born population - India (%)
Place of birth for the foreign-born population - Iran (%)
Place of birth for the foreign-born population - Kazakhstan (%)
Place of birth for the foreign-born population - Nepal (%)
Place of birth for the foreign-born population - Pakistan (%)
Place of birth for the foreign-born population - Sri Lanka (%)
Place of birth for the foreign-born population - Uzbekistan (%)
Place of birth for the foreign-born population - Other South Central Asia (%)
Place of birth for the foreign-born population - Burma (%)
Place of birth for the foreign-born population - Cambodia (%)
Place of birth for the foreign-born population - Indonesia (%)
Place of birth for the foreign-born population - Laos (%)
Place of birth for the foreign-born population - Malaysia (%)
Place of birth for the foreign-born population - Philippines (%)
Place of birth for the foreign-born population - Singapore (%)
Place of birth for the foreign-born population - Thailand (%)
Place of birth for the foreign-born population - Vietnam (%)
Place of birth for the foreign-born population - Other South Eastern Asia (%)
Place of birth for the foreign-born population - Armenia (%)
Place of birth for the foreign-born population - Iraq (%)
Place of birth for the foreign-born population - Israel (%)
Place of birth for the foreign-born population - Jordan (%)
Place of birth for the foreign-born population - Kuwait (%)
Place of birth for the foreign-born population - Lebanon (%)
Place of birth for the foreign-born population - Saudi Arabia (%)
Place of birth for the foreign-born population - Syria (%)
Place of birth for the foreign-born population - Turkey (%)
Place of birth for the foreign-born population - Yemen (%)
Place of birth for the foreign-born population - Other Western Asia (%)
Place of birth for the foreign-born population - Eritrea (%)
Place of birth for the foreign-born population - Ethiopia (%)
Place of birth for the foreign-born population - Kenya (%)
Place of birth for the foreign-born population - Somalia (%)
Place of birth for the foreign-born population - Uganda (%)
Place of birth for the foreign-born population - Zimbabwe (%)
Place of birth for the foreign-born population - Other Eastern Africa (%)
Place of birth for the foreign-born population - Cameroon (%)
Place of birth for the foreign-born population - Congo (%)
Place of birth for the foreign-born population - Democratic Republic of Congo (Zaire) (%)
Place of birth for the foreign-born population - Other Middle Africa (%)
Place of birth for the foreign-born population - Egypt (%)
Place of birth for the foreign-born population - Morocco (%)
Place of birth for the foreign-born population - Sudan (%)
Place of birth for the foreign-born population - Other Northern Africa (%)
Place of birth for the foreign-born population - South Africa (%)
Place of birth for the foreign-born population - Other Southern Africa (%)
Place of birth for the foreign-born population - Cabo Verde (%)
Place of birth for the foreign-born population - Ghana (%)
Place of birth for the foreign-born population - Liberia (%)
Place of birth for the foreign-born population - Nigeria (%)
Place of birth for the foreign-born population - Senegal (%)
Place of birth for the foreign-born population - Sierra Leone (%)
Place of birth for the foreign-born population - Other Western Africa (%)
Place of birth for the foreign-born population - Australia (%)
Place of birth for the foreign-born population - New Zealand (%)
Place of birth for the foreign-born population - Fiji (%)
Place of birth for the foreign-born population - Micronesia (%)
Place of birth for the foreign-born population - Bahamas (%)
Place of birth for the foreign-born population - Barbados (%)
Place of birth for the foreign-born population - Cuba (%)
Place of birth for the foreign-born population - Dominica (%)
Place of birth for the foreign-born population - Dominican Republic (%)
Place of birth for the foreign-born population - Grenada (%)
Place of birth for the foreign-born population - Haiti (%)
Place of birth for the foreign-born population - Jamaica (%)
Place of birth for the foreign-born population - St. Vincent and the Grenadines (%)
Place of birth for the foreign-born population - Trinidad and Tobago (%)
Place of birth for the foreign-born population - West Indies (%)
Place of birth for the foreign-born population - Other Caribbean (%)
Place of birth for the foreign-born population - Belize (%)
Place of birth for the foreign-born population - Costa Rica (%)
Place of birth for the foreign-born population - El Salvador (%)
Place of birth for the foreign-born population - Guatemala (%)
Place of birth for the foreign-born population - Honduras (%)
Place of birth for the foreign-born population - Mexico (%)
Place of birth for the foreign-born population - Nicaragua (%)
Place of birth for the foreign-born population - Panama (%)
Place of birth for the foreign-born population - Other Central America (%)
Place of birth for the foreign-born population - Argentina (%)
Place of birth for the foreign-born population - Bolivia (%)
Place of birth for the foreign-born population - Brazil (%)
Place of birth for the foreign-born population - Chile (%)
Place of birth for the foreign-born population - Colombia (%)
Place of birth for the foreign-born population - Ecuador (%)
Place of birth for the foreign-born population - Guyana (%)
Place of birth for the foreign-born population - Peru (%)
Place of birth for the foreign-born population - Uruguay (%)
Place of birth for the foreign-born population - Venezuela (%)
Place of birth for the foreign-born population - Other South America (%)
Place of birth for the foreign-born population - Canada (%)
Place of birth for the foreign-born population - Other Northern America (%)
Place of birth for the foreign-born population - Other (%)
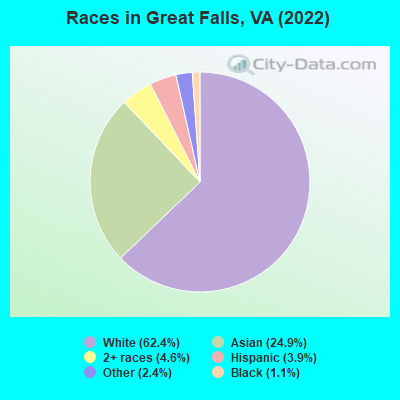
According to 2022 data, the most numerous races in Great Falls, VA are White alone (9,284 residents), Black alone (160 residents), and Hispanic (574 residents). 71.3% of Great Falls residents speak English at home. 24.5% of Great Falls, VA residents are foreign-born (18.7% born in Asia, 2.8% born in Europe), which is 51.0% greater than the foreign-born rate of 12.0% across the entire state of Virginia.
Race distribution in Great Falls
2000 2022
4,965,637 70.2% White alone 1,376,378 19.4% Black alone 329,540 4.7% Hispanic 259,277 3.7% Asian alone 114,022 1.6% Two or more races 18,596 0.3% American Indian alone 11,685 0.2% Other race alone 3,380 0.05% Native Hawaiian and Other
5,095,130 58.7% White alone 1,594,785 18.4% Black alone 905,750 10.4% Hispanic 602,881 6.9% Asian alone 406,047 4.7% Two or more races 60,419 0.7% Other race alone 11,738 0.1% American Indian alone 6,869 0.08% Native Hawaiian and Other
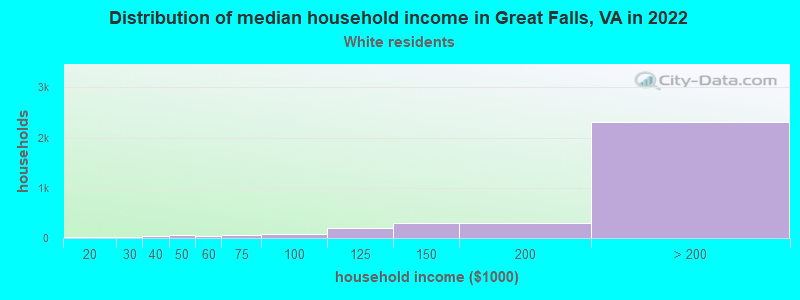
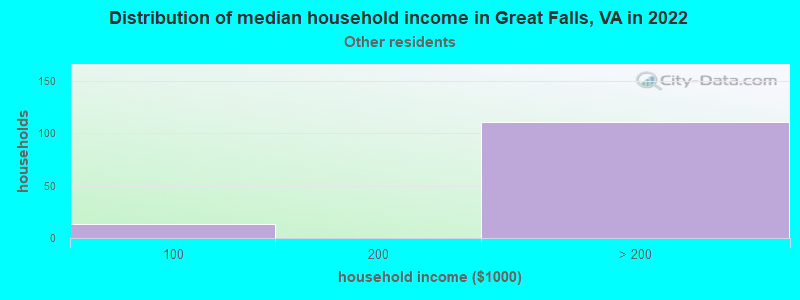
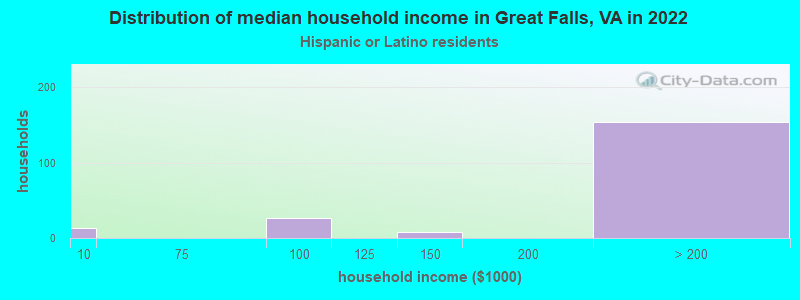
Income and house value in Great Falls Median household income in 2022 over $200,000 White non-Hispanic householdersover $200,000 Black householdersover $200,000 Asian householdersover $200,000 Some other race householdersover $200,000 Two or more races householdersover $200,000 Hispanic or Latino race householdersMedian 2022 house value over $1,000,000 White Non-Hispanic householdersover $1,000,000 Black or African American householders $851,499 Asian householders$802,353 Two or more races householdersover $1,000,000 Hispanic or Latino householders
Median age by race in Great Falls
52.2 Median age for White residents51.1 53.2 55.1 Median age for Black or African American residents49.9 66.5 -754,182,753.4 Median age for American Indian / Alaska Native residents-964,539,006.1 -669,005,847.3 47.6 Median age for Asian residents47.4 47.1 -666,666,666.0 Median age for Native Hawaiian / Pacific Islander residents-558,791,801.0 -584,518,166.9 16.2 Median age for Other race residents15.0 16.9 31.6 Median age for Two or more races residents26.1 44.7 51.7 Median age for White alone residents51.0 52.2 45.5 Median age for Hispanic or Latino residents29.7 49.7
Owner/renter occupied households by race in Great Falls
House owners and renters - White residents 3,274 94.9% Owner occupied177 5.1% Renter occupiedHouse owners and renters - Black or African American residents 22 65.1% Owner occupied12 34.9% Renter occupiedHouse owners and renters - Asian residents 1,086 96.6% Owner occupied39 3.4% Renter occupiedHouse owners and renters - Other race residents 93 100.0% Owner occupiedHouse owners and renters - Two or more races residents 253 87.9% Owner occupied35 12.1% Renter occupiedHouse owners and renters - White alone residents 3,310 94.6% Owner occupied191 5.4% Renter occupiedHouse owners and renters - Hispanic or Latino residents 151 92.9% Owner occupied12 7.1% Renter occupied
Language usage in Great Falls
English speakers - Total 71.3% of residents of Great Falls speak English at home.
2.8% of residents speak Spanish at home 312 78.6% Speak English very well85 21.4% Speak English less than very well26.4% of residents speak other language at home 3,045 80.6% Speak English very well731 19.4% Speak English less than very well
English speakers - Born in the United States 90.0% of residents of Great Falls speak English at home.
2.3% of residents speak Spanish at home 155 89.1% Speak English very well19 10.9% Speak English less than very well7.3% of residents speak other language at home 526 95.3% Speak English very well26 4.7% Speak English less than very well
English speakers - Native, born elsewhere 54.8% of residents of Great Falls speak English at home.
15.4% of residents speak Spanish at home 37 100.0% Speak English very well29.9% of residents speak other language at home 72 100.0% Speak English very well
English speakers - Foreign-born 21.3% of residents of Great Falls speak English at home.
5.3% of residents speak Spanish at home 120 62.5% Speak English very well72 37.5% Speak English less than very well73.9% of residents speak other language at home 2,013 74.9% Speak English very well674 25.1% Speak English less than very well
White (Caucasian) - Speak only English Native:
94.8% (7,599)Foreign-born:
30.3% (220)
White (Caucasian) - Speak another language Native:
5.6% (448)Foreign-born:
71.4% (519)
Black or African American - Speak only English Native:
98.0% (117)Foreign-born:
22.8% (7)
Asian - Speak only English Native:
62.5% (839)Foreign-born:
19.2% (435)
Asian - Speak another language Native:
36.4% (489)Foreign-born:
81.6% (1,850)
Other race - Speak another language Native:
8.9% (26)Foreign-born:
98.2% (67)
Two or more races - Speak only English Native:
67.4% (467)Foreign-born:
27.8% (94)
Two or more races - Speak another language Native:
33.1% (229)Foreign-born:
71.8% (241)
White alone - Speak only English Native:
93.9% (7,635)Foreign-born:
27.1% (239)
White alone - Speak another language Native:
6.0% (490)Foreign-born:
72.7% (642)
Hispanic or Latino - Speak only English Native:
52.7% (149)Foreign-born:
18.7% (45)
Hispanic or Latino - Speak another language Native:
48.3% (137)Foreign-born:
81.6% (197)
Foreign-born residents in Great Falls 3,644 residents are foreign born (18.7% Asia , 2.8% Europe ).
This city:
24.5%Virginia:
12.6%
Marital status for residents in Great Falls Marital status - White (Caucasian) population 15 years and over
Males 20.4% Never married74.3% Now married0.7% Separated0.7% Widowed3.8% DivorcedFemales 15.7% Never married72.0% Now married0.5% Separated5.9% Widowed5.8% DivorcedWomen who gave birth in the past 12 months Now married:
79.2% (34)Unmarried:
20.8% (9)
Women who did not give birth in the past 12 months Now married:
59.8% (774)Unmarried:
40.2% (519)
Marital status - Black or African American population 15 years and over
Males 50.0% Never married50.0% Now married0.0% Separated0.0% Widowed0.0% DivorcedFemales 34.9% Never married53.5% Now married0.0% Separated11.6% Widowed0.0% DivorcedWomen who did not give birth in the past 12 months Now married:
100.0% (38)Unmarried:
0.0% (0)
Marital status - Asian population 15 years and over
Males 26.9% Never married68.6% Now married0.0% Separated0.0% Widowed4.4% DivorcedFemales 21.7% Never married70.2% Now married1.7% Separated3.5% Widowed2.9% DivorcedWomen who did not give birth in the past 12 months Now married:
63.7% (591)Unmarried:
36.3% (337)
Marital status - Other race population 15 years and over
Males 0.0% Never married85.9% Now married0.0% Separated0.0% Widowed14.1% DivorcedFemales 48.2% Never married43.3% Now married0.0% Separated8.5% Widowed0.0% DivorcedWomen who gave birth in the past 12 months Now married:
100.0% (11)Unmarried:
0.0% (0)
Women who did not give birth in the past 12 months Now married:
34.6% (44)Unmarried:
65.4% (84)
Marital status - Two or more races population 15 years and over
Males 41.4% Never married49.0% Now married0.0% Separated6.2% Widowed3.3% DivorcedFemales 31.8% Never married66.7% Now married0.0% Separated0.0% Widowed1.5% DivorcedWomen who did not give birth in the past 12 months Now married:
52.8% (127)Unmarried:
47.2% (114)
Marital status - White alone, not Hispanic / Latino population 15 years and over
Males 20.6% Never married74.5% Now married0.2% Separated0.8% Widowed3.9% DivorcedFemales 15.3% Never married72.4% Now married0.5% Separated5.7% Widowed6.1% DivorcedWomen who gave birth in the past 12 months Now married:
79.2% (37)Unmarried:
20.8% (10)
Women who did not give birth in the past 12 months Now married:
59.2% (790)Unmarried:
40.8% (545)
Marital status - Hispanic or Latino population 15 years and over
Males 34.9% Never married55.0% Now married10.0% Separated0.0% Widowed0.0% DivorcedFemales 21.5% Never married63.9% Now married0.0% Separated12.9% Widowed1.7% DivorcedWomen who gave birth in the past 12 months Now married:
100.0% (9)Unmarried:
0.0% (0)
Women who did not give birth in the past 12 months Now married:
70.1% (75)Unmarried:
29.9% (32)
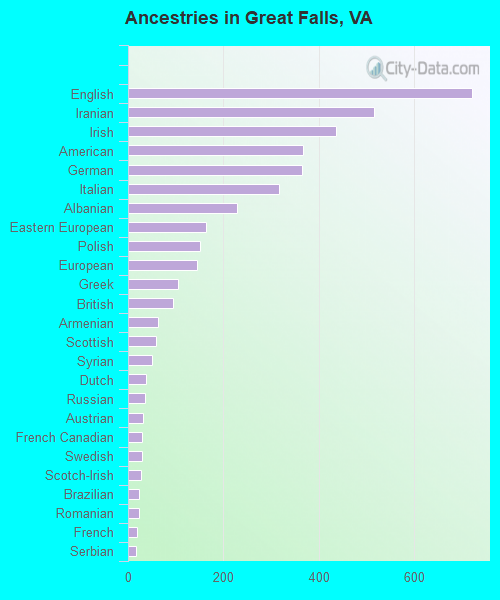
Ancestries in Great Falls
721 9.2% English515 6.6% Iranian437 5.6% Irish367 4.7% American365 4.7% German317 4.0% Italian229 2.9% Albanian164 2.1% Eastern European152 1.9% Polish144 1.8% European105 1.3% Greek94 1.2% British62 0.8% Armenian59 0.8% Scottish50 0.6% Syrian38 0.5% Dutch36 0.5% Russian31 0.4% Austrian29 0.4% French Canadian29 0.4% Swedish28 0.4% Scotch-Irish24 0.3% Brazilian23 0.3% Romanian18 0.2% French17 0.2% Serbian16 0.2% Latvian16 0.2% Guyanese14 0.2% Yugoslavian13 0.2% Hungarian13 0.2% Swiss11 0.1% Lithuanian10 0.1% Egyptian10 0.1% Czech9 0.1% Maltese9 0.1% Norwegian9 0.1% Israeli8 0.1% Croatian8 0.1% Welsh7 0.09% Lebanese6 0.08% Northern European5 0.06% Slovak4 0.05% Canadian4 0.05% Ethiopian
Children Nativity (place of birth) in Great Falls
Children under 6 years - Living with two parents Both parents native 561 100.0% NativeBoth parents foreign-born 126 92.0% Native11 8.0% Foreign-bornOne native, one foreign-born parent 83 100.0% NativeChildren under 6 years - Living with one parent Native parent 12 100.0% NativeForeign-born parent 7 100.0% NativeChildren 6 to 17 years - Living with two parents Both parents native 1,271 100.0% Native1 0.0% Foreign-bornBoth parents foreign-born 711 88.9% Native89 11.1% Foreign-bornOne native, one foreign-born parent 261 98.6% Native4 1.4% Foreign-bornChildren 6 to 17 years - Living with one parent Native parent 170 95.2% Native9 4.8% Foreign-bornForeign-born parent 44 69.5% Native19 30.5% Foreign-born