Races in Grayslake, Illinois (IL) Detailed Stats
Data:
Races - White alone (%)
Races - White alone (% change since 2000)
Races - Black alone (%)
Races - Black alone (% change since 2000)
Races - American Indian alone (%)
Races - American Indian alone (% change since 2000)
Races - Asian alone (%)
Races - Asian alone (% change since 2000)
Races - Hispanic (%)
Races - Hispanic (% change since 2000)
Races - Native Hawaiian and Other Pacific Islander alone (%)
Races - Native Hawaiian and Other Pacific Islander alone (% change since 2000)
Races - Two or more races(%)
Races - Two or more races(% change since 2000)
Races - Other race alone (%)
Races - Other race alone (% change since 2000)
Racial diversity
Place of birth - Born in state of residence (%)
Place of birth - Born in state of residence (%) - White
Place of birth - Born in state of residence (%) - Black or African American
Place of birth - Born in state of residence (%) - Asian
Place of birth - Born in state of residence (%) - Hispanic or Latino
Place of birth - Born in state of residence (%) - American Indian and Alaska Native
Place of birth - Born in state of residence (%) - Multirace
Place of birth - Born in state of residence (%) - Other Race
Place of birth - Born in other state (%)
Place of birth - Born in other state (%) - White
Place of birth - Born in other state (%) - Black or African American
Place of birth - Born in other state (%) - Asian
Place of birth - Born in other state (%) - Hispanic or Latino
Place of birth - Born in other state (%) - American Indian and Alaska Native
Place of birth - Born in other state (%) - Multirace
Place of birth - Born in other state (%) - Other Race
Place of birth - Native, outside of US (%)
Place of birth - Native, outside of US (%) - White
Place of birth - Native, outside of US (%) - Black or African American
Place of birth - Native, outside of US (%) - Asian
Place of birth - Native, outside of US (%) - Hispanic or Latino
Place of birth - Native, outside of US (%) - American Indian and Alaska Native
Place of birth - Native, outside of US (%) - Multirace
Place of birth - Native, outside of US (%) - Other Race
Place of birth - Foreign born (%)
Place of birth - Foreign born (%) - White
Place of birth - Foreign born (%) - Black or African American
Place of birth - Foreign born (%) - Asian
Place of birth - Foreign born (%) - Hispanic or Latino
Place of birth - Foreign born (%) - American Indian and Alaska Native
Place of birth - Foreign born (%) - Multirace
Place of birth - Foreign born (%) - Other Race
Residents speaking English at home (%)
Residents speaking English at home - Born in the United States (%)
Residents speaking English at home - Native, born elsewhere (%)
Residents speaking English at home - Foreign born (%)
Residents speaking Spanish at home (%)
Residents speaking Spanish at home - Born in the United States (%)
Residents speaking Spanish at home - Native, born elsewhere (%)
Residents speaking Spanish at home - Foreign born (%)
Residents speaking other language at home (%)
Residents speaking other language at home - Born in the United States (%)
Residents speaking other language at home - Native, born elsewhere (%)
Residents speaking other language at home - Foreign born (%)
Marital status - Never married (%)
Marital status - Now married (%)
Marital status - Separated (%)
Marital status - Widowed (%)
Marital status - Divorced (%)
Ancestries Reported - Arab (%)
Ancestries Reported - Czech (%)
Ancestries Reported - Danish (%)
Ancestries Reported - Dutch (%)
Ancestries Reported - English (%)
Ancestries Reported - French (%)
Ancestries Reported - French Canadian (%)
Ancestries Reported - German (%)
Ancestries Reported - Greek (%)
Ancestries Reported - Hungarian (%)
Ancestries Reported - Irish (%)
Ancestries Reported - Italian (%)
Ancestries Reported - Lithuanian (%)
Ancestries Reported - Norwegian (%)
Ancestries Reported - Polish (%)
Ancestries Reported - Portuguese (%)
Ancestries Reported - Russian (%)
Ancestries Reported - Scotch-Irish (%)
Ancestries Reported - Scottish (%)
Ancestries Reported - Slovak (%)
Ancestries Reported - Subsaharan African (%)
Ancestries Reported - Swedish (%)
Ancestries Reported - Swiss (%)
Ancestries Reported - Ukrainian (%)
Ancestries Reported - United States (%)
Ancestries Reported - Welsh (%)
Ancestries Reported - West Indian (%)
Ancestries Reported - Other (%)
Geographical mobility - Same house 1 year ago (%)
Geographical mobility - Same house 1 year ago (%) - White
Geographical mobility - Same house 1 year ago (%) - Black or African American
Geographical mobility - Same house 1 year ago (%) - Asian
Geographical mobility - Same house 1 year ago (%) - Hispanic or Latino
Geographical mobility - Same house 1 year ago (%) - American Indian and Alaska Native
Geographical mobility - Same house 1 year ago (%) - Multirace
Geographical mobility - Same house 1 year ago (%) - Other Race
Geographical mobility - Moved within same county (%)
Geographical mobility - Moved within same county (%) - White
Geographical mobility - Moved within same county (%) - Black or African American
Geographical mobility - Moved within same county (%) - Asian
Geographical mobility - Moved within same county (%) - Hispanic or Latino
Geographical mobility - Moved within same county (%) - American Indian and Alaska Native
Geographical mobility - Moved within same county (%) - Multirace
Geographical mobility - Moved within same county (%) - Other Race
Geographical mobility - Moved from different county within same state (%)
Geographical mobility - Moved from different county within same state (%) - White
Geographical mobility - Moved from different county within same state (%) - Black or African American
Geographical mobility - Moved from different county within same state (%) - Asian
Geographical mobility - Moved from different county within same state (%) - Hispanic or Latino
Geographical mobility - Moved from different county within same state (%) - American Indian and Alaska Native
Geographical mobility - Moved from different county within same state (%) - Multirace
Geographical mobility - Moved from different county within same state (%) - Other Race
Geographical mobility - Moved from different state (%)
Geographical mobility - Moved from different state (%) - White
Geographical mobility - Moved from different state (%) - Black or African American
Geographical mobility - Moved from different state (%) - Asian
Geographical mobility - Moved from different state (%) - Hispanic or Latino
Geographical mobility - Moved from different state (%) - American Indian and Alaska Native
Geographical mobility - Moved from different state (%) - Multirace
Geographical mobility - Moved from different state (%) - Other Race
Geographical mobility - Moved from abroad (%)
Geographical mobility - Moved from abroad (%) - White
Geographical mobility - Moved from abroad (%) - Black or African American
Geographical mobility - Moved from abroad (%) - Asian
Geographical mobility - Moved from abroad (%) - Hispanic or Latino
Geographical mobility - Moved from abroad (%) - American Indian and Alaska Native
Geographical mobility - Moved from abroad (%) - Multirace
Geographical mobility - Moved from abroad (%) - Other Race
Place of birth for the foreign-born population - Ireland (%)
Place of birth for the foreign-born population - Denmark (%)
Place of birth for the foreign-born population - Norway (%)
Place of birth for the foreign-born population - Sweden (%)
Place of birth for the foreign-born population - United Kingdom (%)
Place of birth for the foreign-born population - England (%)
Place of birth for the foreign-born population - Scotland (%)
Place of birth for the foreign-born population - Other Northern Europe (%)
Place of birth for the foreign-born population - Austria (%)
Place of birth for the foreign-born population - Belgium (%)
Place of birth for the foreign-born population - France (%)
Place of birth for the foreign-born population - Germany (%)
Place of birth for the foreign-born population - Netherlands (%)
Place of birth for the foreign-born population - Switzerland (%)
Place of birth for the foreign-born population - Other Western Europe (%)
Place of birth for the foreign-born population - Greece (%)
Place of birth for the foreign-born population - Italy (%)
Place of birth for the foreign-born population - Portugal (%)
Place of birth for the foreign-born population - Spain (%)
Place of birth for the foreign-born population - Other Southern Europe (%)
Place of birth for the foreign-born population - Albania (%)
Place of birth for the foreign-born population - Belarus (%)
Place of birth for the foreign-born population - Bosnia and Herzegovina (%)
Place of birth for the foreign-born population - Bulgaria (%)
Place of birth for the foreign-born population - Croatia (%)
Place of birth for the foreign-born population - Czechoslovakia (%)
Place of birth for the foreign-born population - Hungary (%)
Place of birth for the foreign-born population - Latvia (%)
Place of birth for the foreign-born population - Lithuania (%)
Place of birth for the foreign-born population - North Macedonia (Macedonia) (%)
Place of birth for the foreign-born population - Moldova (%)
Place of birth for the foreign-born population - Poland (%)
Place of birth for the foreign-born population - Romania (%)
Place of birth for the foreign-born population - Russia (%)
Place of birth for the foreign-born population - Serbia (%)
Place of birth for the foreign-born population - Ukraine (%)
Place of birth for the foreign-born population - Other Eastern Europe (%)
Place of birth for the foreign-born population - China (%)
Place of birth for the foreign-born population - Hong Kong (%)
Place of birth for the foreign-born population - Taiwan (%)
Place of birth for the foreign-born population - Japan (%)
Place of birth for the foreign-born population - Korea (%)
Place of birth for the foreign-born population - Other Eastern Asia (%)
Place of birth for the foreign-born population - Afghanistan (%)
Place of birth for the foreign-born population - Bangladesh (%)
Place of birth for the foreign-born population - India (%)
Place of birth for the foreign-born population - Iran (%)
Place of birth for the foreign-born population - Kazakhstan (%)
Place of birth for the foreign-born population - Nepal (%)
Place of birth for the foreign-born population - Pakistan (%)
Place of birth for the foreign-born population - Sri Lanka (%)
Place of birth for the foreign-born population - Uzbekistan (%)
Place of birth for the foreign-born population - Other South Central Asia (%)
Place of birth for the foreign-born population - Burma (%)
Place of birth for the foreign-born population - Cambodia (%)
Place of birth for the foreign-born population - Indonesia (%)
Place of birth for the foreign-born population - Laos (%)
Place of birth for the foreign-born population - Malaysia (%)
Place of birth for the foreign-born population - Philippines (%)
Place of birth for the foreign-born population - Singapore (%)
Place of birth for the foreign-born population - Thailand (%)
Place of birth for the foreign-born population - Vietnam (%)
Place of birth for the foreign-born population - Other South Eastern Asia (%)
Place of birth for the foreign-born population - Armenia (%)
Place of birth for the foreign-born population - Iraq (%)
Place of birth for the foreign-born population - Israel (%)
Place of birth for the foreign-born population - Jordan (%)
Place of birth for the foreign-born population - Kuwait (%)
Place of birth for the foreign-born population - Lebanon (%)
Place of birth for the foreign-born population - Saudi Arabia (%)
Place of birth for the foreign-born population - Syria (%)
Place of birth for the foreign-born population - Turkey (%)
Place of birth for the foreign-born population - Yemen (%)
Place of birth for the foreign-born population - Other Western Asia (%)
Place of birth for the foreign-born population - Eritrea (%)
Place of birth for the foreign-born population - Ethiopia (%)
Place of birth for the foreign-born population - Kenya (%)
Place of birth for the foreign-born population - Somalia (%)
Place of birth for the foreign-born population - Uganda (%)
Place of birth for the foreign-born population - Zimbabwe (%)
Place of birth for the foreign-born population - Other Eastern Africa (%)
Place of birth for the foreign-born population - Cameroon (%)
Place of birth for the foreign-born population - Congo (%)
Place of birth for the foreign-born population - Democratic Republic of Congo (Zaire) (%)
Place of birth for the foreign-born population - Other Middle Africa (%)
Place of birth for the foreign-born population - Egypt (%)
Place of birth for the foreign-born population - Morocco (%)
Place of birth for the foreign-born population - Sudan (%)
Place of birth for the foreign-born population - Other Northern Africa (%)
Place of birth for the foreign-born population - South Africa (%)
Place of birth for the foreign-born population - Other Southern Africa (%)
Place of birth for the foreign-born population - Cabo Verde (%)
Place of birth for the foreign-born population - Ghana (%)
Place of birth for the foreign-born population - Liberia (%)
Place of birth for the foreign-born population - Nigeria (%)
Place of birth for the foreign-born population - Senegal (%)
Place of birth for the foreign-born population - Sierra Leone (%)
Place of birth for the foreign-born population - Other Western Africa (%)
Place of birth for the foreign-born population - Australia (%)
Place of birth for the foreign-born population - New Zealand (%)
Place of birth for the foreign-born population - Fiji (%)
Place of birth for the foreign-born population - Micronesia (%)
Place of birth for the foreign-born population - Bahamas (%)
Place of birth for the foreign-born population - Barbados (%)
Place of birth for the foreign-born population - Cuba (%)
Place of birth for the foreign-born population - Dominica (%)
Place of birth for the foreign-born population - Dominican Republic (%)
Place of birth for the foreign-born population - Grenada (%)
Place of birth for the foreign-born population - Haiti (%)
Place of birth for the foreign-born population - Jamaica (%)
Place of birth for the foreign-born population - St. Vincent and the Grenadines (%)
Place of birth for the foreign-born population - Trinidad and Tobago (%)
Place of birth for the foreign-born population - West Indies (%)
Place of birth for the foreign-born population - Other Caribbean (%)
Place of birth for the foreign-born population - Belize (%)
Place of birth for the foreign-born population - Costa Rica (%)
Place of birth for the foreign-born population - El Salvador (%)
Place of birth for the foreign-born population - Guatemala (%)
Place of birth for the foreign-born population - Honduras (%)
Place of birth for the foreign-born population - Mexico (%)
Place of birth for the foreign-born population - Nicaragua (%)
Place of birth for the foreign-born population - Panama (%)
Place of birth for the foreign-born population - Other Central America (%)
Place of birth for the foreign-born population - Argentina (%)
Place of birth for the foreign-born population - Bolivia (%)
Place of birth for the foreign-born population - Brazil (%)
Place of birth for the foreign-born population - Chile (%)
Place of birth for the foreign-born population - Colombia (%)
Place of birth for the foreign-born population - Ecuador (%)
Place of birth for the foreign-born population - Guyana (%)
Place of birth for the foreign-born population - Peru (%)
Place of birth for the foreign-born population - Uruguay (%)
Place of birth for the foreign-born population - Venezuela (%)
Place of birth for the foreign-born population - Other South America (%)
Place of birth for the foreign-born population - Canada (%)
Place of birth for the foreign-born population - Other Northern America (%)
Place of birth for the foreign-born population - Other (%)
Latest news about races in Grayslake, IL collected exclusively by city-data.com from local newspapers, TV, and radio stations
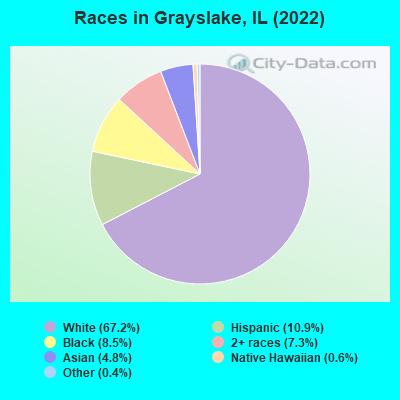
According to 2022 data, the most numerous races in Grayslake, IL are White alone (13,902 residents), Hispanic (2,259 residents), and Black alone (1,767 residents). 81.9% of Grayslake residents speak English at home. 10.5% of Grayslake, IL residents are foreign-born (3.6% born in Asia, 3.3% born in Latin America, 2.4% born in Europe), which is 33.3% less than the foreign-born rate of 14.0% across the entire state of Illinois.
Race distribution in Grayslake
2000 2022
8,424,140 67.8% White alone 1,856,152 14.9% Black alone 1,530,262 12.3% Hispanic 419,916 3.4% Asian alone 153,996 1.2% Two or more races 13,479 0.1% Other race alone 18,232 0.1% American Indian alone 3,116 0.03% Native Hawaiian and Other
7,356,301 58.5% White alone 2,299,726 18.3% Hispanic 1,660,423 13.2% Black alone 747,296 5.9% Asian alone 458,599 3.6% Two or more races 45,386 0.4% Other race alone 10,405 0.08% American Indian alone 3,896 0.03% Native Hawaiian and Other
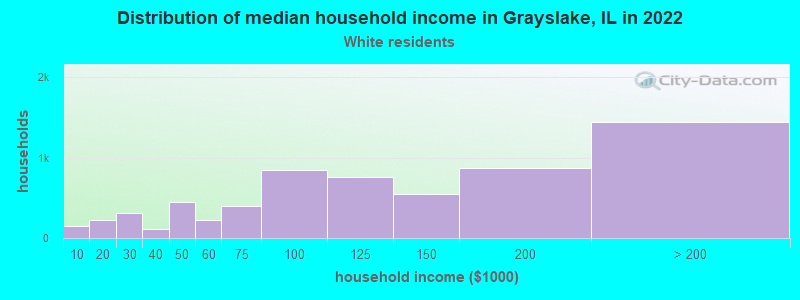
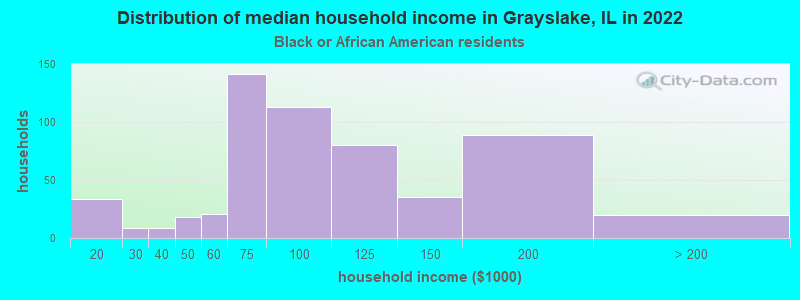
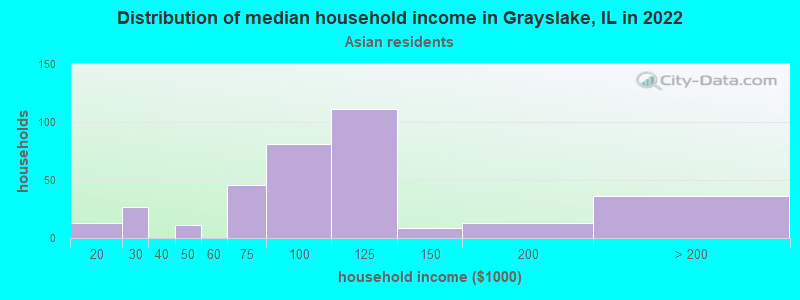
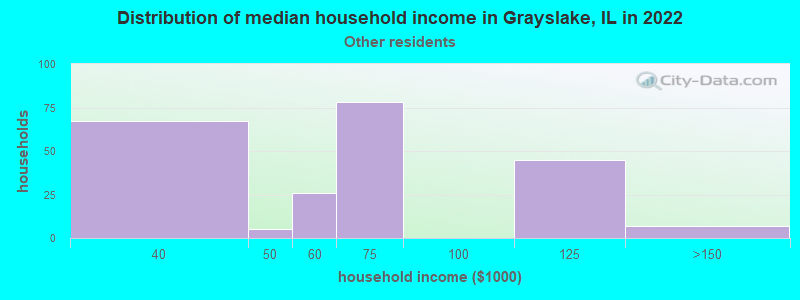
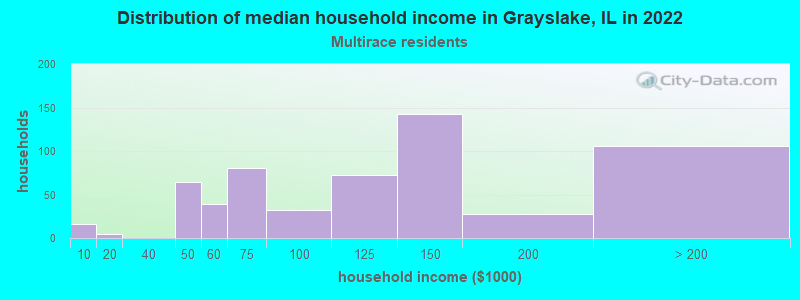
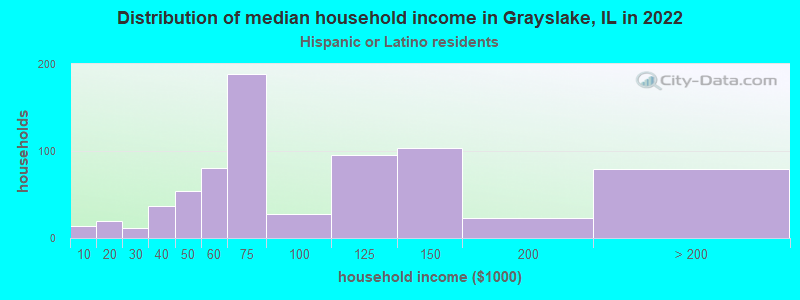
Income and house value in Grayslake Median household income in 2022 $113,504 White non-Hispanic householders$96,577 Black householders$97,520 Asian householders$62,841 Some other race householders$108,006 Two or more races householders$71,173 Hispanic or Latino race householdersMedian 2022 house value $290,518 White Non-Hispanic householders$381,975 Black or African American householders$282,972 American Indian or Alaska Native householders $321,004 Asian householders$281,161 Some other race householders$273,615 Two or more races householders$278,445 Hispanic or Latino householders
Median age by race in Grayslake
44.4 Median age for White residents43.8 44.9 29.9 Median age for Black or African American residents30.5 28.1 -657,243,815.6 Median age for American Indian / Alaska Native residents-671,532,846.0 -638,251,365.5 36.1 Median age for Asian residents36.9 33.6 35.9 Median age for Native Hawaiian / Pacific Islander residents36.1 -576,015,108.0 21.0 Median age for Other race residents14.3 23.2 25.3 Median age for Two or more races residents22.7 31.1 44.5 Median age for White alone residents43.7 46.5 24.4 Median age for Hispanic or Latino residents24.8 23.6
Owner/renter occupied households by race in Grayslake
House owners and renters - White residents 4,879 77.2% Owner occupied1,442 22.8% Renter occupiedHouse owners and renters - Black or African American residents 290 55.2% Owner occupied236 44.8% Renter occupiedHouse owners and renters - American Indian / Alaska Native residents 30 100.0% Renter occupiedHouse owners and renters - Asian residents 217 66.3% Owner occupied110 33.7% Renter occupiedHouse owners and renters - Native Hawaiian / Pacific Islander residents 24 62.8% Owner occupied14 37.2% Renter occupiedHouse owners and renters - Other race residents 116 62.3% Owner occupied70 37.7% Renter occupiedHouse owners and renters - Two or more races residents 445 72.2% Owner occupied172 27.8% Renter occupiedHouse owners and renters - White alone residents 4,814 77.5% Owner occupied1,401 22.5% Renter occupiedHouse owners and renters - Hispanic or Latino residents 510 67.0% Owner occupied251 33.0% Renter occupied
Language usage in Grayslake
English speakers - Total 81.9% of residents of Grayslake speak English at home.
6.6% of residents speak Spanish at home 1,106 86.9% Speak English very well167 13.1% Speak English less than very well10.9% of residents speak other language at home 1,440 68.7% Speak English very well656 31.3% Speak English less than very well
English speakers - Born in the United States 94.2% of residents of Grayslake speak English at home.
1.2% of residents speak Spanish at home 63 100.0% Speak English very well4.0% of residents speak other language at home 179 86.9% Speak English very well27 13.1% Speak English less than very well
English speakers - Native, born elsewhere 30.0% of residents of Grayslake speak English at home.
35.6% of residents speak Spanish at home 69 77.5% Speak English very well20 22.5% Speak English less than very well41.2% of residents speak other language at home 103 100.0% Speak English very well
English speakers - Foreign-born 24.6% of residents of Grayslake speak English at home.
17.2% of residents speak Spanish at home 290 74.6% Speak English very well99 25.4% Speak English less than very well57.5% of residents speak other language at home 769 59.0% Speak English very well535 41.0% Speak English less than very well
White (Caucasian) - Speak only English Native:
97.5% (12,195)Foreign-born:
47.7% (366)
White (Caucasian) - Speak another language Native:
3.8% (477)Foreign-born:
59.4% (456)
Black or African American - Speak only English Native:
89.2% (1,276)Foreign-born:
5.1% (11)
Black or African American - Speak another language Native:
11.6% (165)Foreign-born:
95.1% (211)
Asian - Speak only English Native:
55.3% (177)Foreign-born:
7.2% (44)
Asian - Speak another language Native:
36.0% (115)Foreign-born:
93.1% (565)
Native Hawaiian / Pacific Islander - Speak only English Native:
84.2% (39)Foreign-born:
39.1% (35)
Native Hawaiian / Pacific Islander - Speak another language Native:
19.2% (9)Foreign-born:
57.0% (52)
Other race - Speak only English Native:
67.1% (402)Foreign-born:
9.9% (15)
Other race - Speak another language Native:
39.4% (236)Foreign-born:
89.3% (135)
Two or more races - Speak only English Native:
66.2% (1,141)Foreign-born:
29.8% (82)
Two or more races - Speak another language Native:
32.0% (552)Foreign-born:
66.1% (182)
White alone - Speak only English Native:
97.2% (12,066)Foreign-born:
41.8% (344)
White alone - Speak another language Native:
2.9% (358)Foreign-born:
58.9% (484)
Hispanic or Latino - Speak only English Native:
49.2% (717)Foreign-born:
18.1% (94)
Hispanic or Latino - Speak another language Native:
51.8% (755)Foreign-born:
85.4% (442)
Foreign-born residents in Grayslake 2,172 residents are foreign born (3.6% Asia , 3.3% Latin America , 2.4% Europe ).
This city:
10.5%Illinois:
14.1%
Marital status for residents in Grayslake Marital status - White (Caucasian) population 15 years and over
Males 31.7% Never married59.5% Now married0.0% Separated2.6% Widowed6.3% DivorcedFemales 23.0% Never married57.0% Now married1.2% Separated7.0% Widowed11.8% DivorcedWomen who gave birth in the past 12 months Now married:
95.5% (133)Unmarried:
4.5% (6)
Women who did not give birth in the past 12 months Now married:
50.8% (1,485)Unmarried:
49.2% (1,437)
Marital status - Black or African American population 15 years and over
Males 35.0% Never married45.5% Now married3.3% Separated4.6% Widowed11.5% DivorcedFemales 41.4% Never married56.2% Now married0.0% Separated0.0% Widowed2.4% DivorcedWomen who gave birth in the past 12 months Now married:
0.0% (0)Unmarried:
100.0% (18)
Women who did not give birth in the past 12 months Now married:
54.3% (269)Unmarried:
45.7% (227)
Marital status - Asian population 15 years and over
Males 21.9% Never married75.4% Now married0.0% Separated0.0% Widowed2.7% DivorcedFemales 29.3% Never married63.4% Now married4.2% Separated3.1% Widowed0.0% DivorcedWomen who gave birth in the past 12 months Now married:
100.0% (7)Unmarried:
0.0% (0)
Women who did not give birth in the past 12 months Now married:
62.4% (225)Unmarried:
37.6% (136)
Marital status - Native Hawaiian / Pacific Islander population 15 years and over
Males 0.0% Never married100.0% Now married0.0% Separated0.0% Widowed0.0% DivorcedFemales 0.0% Never married100.0% Now married0.0% Separated0.0% Widowed0.0% DivorcedWomen who did not give birth in the past 12 months Now married:
100.0% (41)Unmarried:
0.0% (0)
Marital status - Other race population 15 years and over
Males 18.5% Never married65.2% Now married0.0% Separated0.0% Widowed16.3% DivorcedFemales 51.3% Never married40.6% Now married4.8% Separated3.2% Widowed0.0% DivorcedWomen who did not give birth in the past 12 months Now married:
47.0% (86)Unmarried:
53.0% (97)
Marital status - Two or more races population 15 years and over
Males 47.9% Never married44.0% Now married0.0% Separated0.0% Widowed8.2% DivorcedFemales 46.0% Never married43.7% Now married0.0% Separated0.0% Widowed10.3% DivorcedWomen who did not give birth in the past 12 months Now married:
34.3% (235)Unmarried:
65.7% (449)
Marital status - White alone, not Hispanic / Latino population 15 years and over
Males 31.3% Never married60.5% Now married0.0% Separated2.7% Widowed5.6% DivorcedFemales 21.1% Never married59.3% Now married1.0% Separated7.3% Widowed11.3% DivorcedWomen who gave birth in the past 12 months Now married:
95.5% (142)Unmarried:
4.5% (7)
Women who did not give birth in the past 12 months Now married:
53.9% (1,502)Unmarried:
46.1% (1,286)
Marital status - Hispanic or Latino population 15 years and over
Males 31.2% Never married50.0% Now married0.0% Separated0.0% Widowed18.8% DivorcedFemales 55.4% Never married27.9% Now married1.5% Separated2.3% Widowed12.9% DivorcedWomen who did not give birth in the past 12 months Now married:
29.1% (211)Unmarried:
70.9% (513)
Ancestries in Grayslake
1,327 14.2% German849 9.1% Irish484 5.2% Polish478 5.1% American429 4.6% Haitian377 4.0% English340 3.6% Italian286 3.1% Latvian209 2.2% African203 2.2% European151 1.6% Norwegian109 1.2% Swedish106 1.1% Iranian90 1.0% Ukrainian86 0.9% Eastern European81 0.9% Russian80 0.9% Romanian63 0.7% Greek53 0.6% Jamaican39 0.4% Northern European37 0.4% Scottish35 0.4% British26 0.3% Ghanaian25 0.3% Nigerian24 0.3% Scandinavian22 0.2% Belizean21 0.2% Scotch-Irish20 0.2% Canadian16 0.2% Slovak14 0.2% Guyanese14 0.2% Croatian12 0.1% Cypriot11 0.1% Lithuanian10 0.1% Bulgarian9 0.10% Dutch9 0.10% Czech9 0.10% Albanian8 0.09% Czechoslovakian7 0.08% Finnish7 0.08% Danish
Geographical mobility in Grayslake Same house 1 year ago 12,050 87.4% White (Caucasian)1,205 67.6% Black or African American22 31.7% American Indian / Alaska Native741 73.7% Asian90 89.4% Native Hawaiian / Pacific Islander614 73.3% Other race2,199 88.2% Two or more races12,086 87.5% White alone, not Hispanic / Latino1,835 81.8% Hispanic or LatinoMoved within same county 916 6.6% White / Caucasian257 14.4% Black or African American48 69.6% American Indian / Alaska Native107 10.7% Asian165 19.7% Other race893 6.5% White alone, not Hispanic / Latino302 13.4% Hispanic or LatinoMoved within same state 464 3.4% White / Caucasian14 1.4% Asian12 12.1% Native Hawaiian / Pacific Islander62 2.5% Two or more races475 3.4% White alone, not Hispanic / Latino24 1.1% Hispanic or LatinoMoved from different state 240 1.7% White / Caucasian190 10.6% Black or African American36 3.6% Asian130 5.2% Two or more races221 1.6% White alone, not Hispanic / Latino67 3.0% Hispanic or LatinoMoved from abroad 109 0.8% White60 6.0% Asian140 1.0% White alone, not Hispanic / Latino
Children Nativity (place of birth) in Grayslake
Children under 6 years - Living with two parents Both parents native 1,131 100.0% NativeBoth parents foreign-born 97 75.5% Native32 24.5% Foreign-bornOne native, one foreign-born parent 76 100.0% NativeChildren under 6 years - Living with one parent Native parent 262 100.0% NativeForeign-born parent 10 100.0% NativeChildren 6 to 17 years - Living with two parents Both parents native 1,773 100.0% NativeBoth parents foreign-born 340 66.5% Native171 33.5% Foreign-bornOne native, one foreign-born parent 252 100.0% NativeChildren 6 to 17 years - Living with one parent Native parent 408 100.0% NativeForeign-born parent 102 51.8% Native95 48.2% Foreign-born
Grandparents responsible for own grandchildren in Grayslake
Grandparents (30 to 59 years) White / Caucasian 7 100.0% Not responsible for grandchildrenTwo or more races 69 100.0% Responsible for grandchildrenWhite alone, not Hispanic / Latino 7 100.0% Not responsible for grandchildrenHispanic or Latino 41 100.0% Responsible for grandchildrenGrandparents (60 years and over) White / Caucasian 18 39.2% Responsible for grandchildren28 60.8% Not responsible for grandchildrenTwo or more races 24 100.0% Not responsible for grandchildrenWhite alone, not Hispanic / Latino 22 43.4% Responsible for grandchildren29 56.6% Not responsible for grandchildrenHispanic or Latino 14 100.0% Not responsible for grandchildren