Races in Grain Valley, Missouri (MO) Detailed Stats
Data:
Races - White alone (%)
Races - White alone (% change since 2000)
Races - Black alone (%)
Races - Black alone (% change since 2000)
Races - American Indian alone (%)
Races - American Indian alone (% change since 2000)
Races - Asian alone (%)
Races - Asian alone (% change since 2000)
Races - Hispanic (%)
Races - Hispanic (% change since 2000)
Races - Native Hawaiian and Other Pacific Islander alone (%)
Races - Native Hawaiian and Other Pacific Islander alone (% change since 2000)
Races - Two or more races(%)
Races - Two or more races(% change since 2000)
Races - Other race alone (%)
Races - Other race alone (% change since 2000)
Racial diversity
Place of birth - Born in state of residence (%)
Place of birth - Born in state of residence (%) - White
Place of birth - Born in state of residence (%) - Black or African American
Place of birth - Born in state of residence (%) - Asian
Place of birth - Born in state of residence (%) - Hispanic or Latino
Place of birth - Born in state of residence (%) - American Indian and Alaska Native
Place of birth - Born in state of residence (%) - Multirace
Place of birth - Born in state of residence (%) - Other Race
Place of birth - Born in other state (%)
Place of birth - Born in other state (%) - White
Place of birth - Born in other state (%) - Black or African American
Place of birth - Born in other state (%) - Asian
Place of birth - Born in other state (%) - Hispanic or Latino
Place of birth - Born in other state (%) - American Indian and Alaska Native
Place of birth - Born in other state (%) - Multirace
Place of birth - Born in other state (%) - Other Race
Place of birth - Native, outside of US (%)
Place of birth - Native, outside of US (%) - White
Place of birth - Native, outside of US (%) - Black or African American
Place of birth - Native, outside of US (%) - Asian
Place of birth - Native, outside of US (%) - Hispanic or Latino
Place of birth - Native, outside of US (%) - American Indian and Alaska Native
Place of birth - Native, outside of US (%) - Multirace
Place of birth - Native, outside of US (%) - Other Race
Place of birth - Foreign born (%)
Place of birth - Foreign born (%) - White
Place of birth - Foreign born (%) - Black or African American
Place of birth - Foreign born (%) - Asian
Place of birth - Foreign born (%) - Hispanic or Latino
Place of birth - Foreign born (%) - American Indian and Alaska Native
Place of birth - Foreign born (%) - Multirace
Place of birth - Foreign born (%) - Other Race
Residents speaking English at home (%)
Residents speaking English at home - Born in the United States (%)
Residents speaking English at home - Native, born elsewhere (%)
Residents speaking English at home - Foreign born (%)
Residents speaking Spanish at home (%)
Residents speaking Spanish at home - Born in the United States (%)
Residents speaking Spanish at home - Native, born elsewhere (%)
Residents speaking Spanish at home - Foreign born (%)
Residents speaking other language at home (%)
Residents speaking other language at home - Born in the United States (%)
Residents speaking other language at home - Native, born elsewhere (%)
Residents speaking other language at home - Foreign born (%)
Marital status - Never married (%)
Marital status - Now married (%)
Marital status - Separated (%)
Marital status - Widowed (%)
Marital status - Divorced (%)
Ancestries Reported - Arab (%)
Ancestries Reported - Czech (%)
Ancestries Reported - Danish (%)
Ancestries Reported - Dutch (%)
Ancestries Reported - English (%)
Ancestries Reported - French (%)
Ancestries Reported - French Canadian (%)
Ancestries Reported - German (%)
Ancestries Reported - Greek (%)
Ancestries Reported - Hungarian (%)
Ancestries Reported - Irish (%)
Ancestries Reported - Italian (%)
Ancestries Reported - Lithuanian (%)
Ancestries Reported - Norwegian (%)
Ancestries Reported - Polish (%)
Ancestries Reported - Portuguese (%)
Ancestries Reported - Russian (%)
Ancestries Reported - Scotch-Irish (%)
Ancestries Reported - Scottish (%)
Ancestries Reported - Slovak (%)
Ancestries Reported - Subsaharan African (%)
Ancestries Reported - Swedish (%)
Ancestries Reported - Swiss (%)
Ancestries Reported - Ukrainian (%)
Ancestries Reported - United States (%)
Ancestries Reported - Welsh (%)
Ancestries Reported - West Indian (%)
Ancestries Reported - Other (%)
Geographical mobility - Same house 1 year ago (%)
Geographical mobility - Same house 1 year ago (%) - White
Geographical mobility - Same house 1 year ago (%) - Black or African American
Geographical mobility - Same house 1 year ago (%) - Asian
Geographical mobility - Same house 1 year ago (%) - Hispanic or Latino
Geographical mobility - Same house 1 year ago (%) - American Indian and Alaska Native
Geographical mobility - Same house 1 year ago (%) - Multirace
Geographical mobility - Same house 1 year ago (%) - Other Race
Geographical mobility - Moved within same county (%)
Geographical mobility - Moved within same county (%) - White
Geographical mobility - Moved within same county (%) - Black or African American
Geographical mobility - Moved within same county (%) - Asian
Geographical mobility - Moved within same county (%) - Hispanic or Latino
Geographical mobility - Moved within same county (%) - American Indian and Alaska Native
Geographical mobility - Moved within same county (%) - Multirace
Geographical mobility - Moved within same county (%) - Other Race
Geographical mobility - Moved from different county within same state (%)
Geographical mobility - Moved from different county within same state (%) - White
Geographical mobility - Moved from different county within same state (%) - Black or African American
Geographical mobility - Moved from different county within same state (%) - Asian
Geographical mobility - Moved from different county within same state (%) - Hispanic or Latino
Geographical mobility - Moved from different county within same state (%) - American Indian and Alaska Native
Geographical mobility - Moved from different county within same state (%) - Multirace
Geographical mobility - Moved from different county within same state (%) - Other Race
Geographical mobility - Moved from different state (%)
Geographical mobility - Moved from different state (%) - White
Geographical mobility - Moved from different state (%) - Black or African American
Geographical mobility - Moved from different state (%) - Asian
Geographical mobility - Moved from different state (%) - Hispanic or Latino
Geographical mobility - Moved from different state (%) - American Indian and Alaska Native
Geographical mobility - Moved from different state (%) - Multirace
Geographical mobility - Moved from different state (%) - Other Race
Geographical mobility - Moved from abroad (%)
Geographical mobility - Moved from abroad (%) - White
Geographical mobility - Moved from abroad (%) - Black or African American
Geographical mobility - Moved from abroad (%) - Asian
Geographical mobility - Moved from abroad (%) - Hispanic or Latino
Geographical mobility - Moved from abroad (%) - American Indian and Alaska Native
Geographical mobility - Moved from abroad (%) - Multirace
Geographical mobility - Moved from abroad (%) - Other Race
Place of birth for the foreign-born population - Ireland (%)
Place of birth for the foreign-born population - Denmark (%)
Place of birth for the foreign-born population - Norway (%)
Place of birth for the foreign-born population - Sweden (%)
Place of birth for the foreign-born population - United Kingdom (%)
Place of birth for the foreign-born population - England (%)
Place of birth for the foreign-born population - Scotland (%)
Place of birth for the foreign-born population - Other Northern Europe (%)
Place of birth for the foreign-born population - Austria (%)
Place of birth for the foreign-born population - Belgium (%)
Place of birth for the foreign-born population - France (%)
Place of birth for the foreign-born population - Germany (%)
Place of birth for the foreign-born population - Netherlands (%)
Place of birth for the foreign-born population - Switzerland (%)
Place of birth for the foreign-born population - Other Western Europe (%)
Place of birth for the foreign-born population - Greece (%)
Place of birth for the foreign-born population - Italy (%)
Place of birth for the foreign-born population - Portugal (%)
Place of birth for the foreign-born population - Spain (%)
Place of birth for the foreign-born population - Other Southern Europe (%)
Place of birth for the foreign-born population - Albania (%)
Place of birth for the foreign-born population - Belarus (%)
Place of birth for the foreign-born population - Bosnia and Herzegovina (%)
Place of birth for the foreign-born population - Bulgaria (%)
Place of birth for the foreign-born population - Croatia (%)
Place of birth for the foreign-born population - Czechoslovakia (%)
Place of birth for the foreign-born population - Hungary (%)
Place of birth for the foreign-born population - Latvia (%)
Place of birth for the foreign-born population - Lithuania (%)
Place of birth for the foreign-born population - North Macedonia (Macedonia) (%)
Place of birth for the foreign-born population - Moldova (%)
Place of birth for the foreign-born population - Poland (%)
Place of birth for the foreign-born population - Romania (%)
Place of birth for the foreign-born population - Russia (%)
Place of birth for the foreign-born population - Serbia (%)
Place of birth for the foreign-born population - Ukraine (%)
Place of birth for the foreign-born population - Other Eastern Europe (%)
Place of birth for the foreign-born population - China (%)
Place of birth for the foreign-born population - Hong Kong (%)
Place of birth for the foreign-born population - Taiwan (%)
Place of birth for the foreign-born population - Japan (%)
Place of birth for the foreign-born population - Korea (%)
Place of birth for the foreign-born population - Other Eastern Asia (%)
Place of birth for the foreign-born population - Afghanistan (%)
Place of birth for the foreign-born population - Bangladesh (%)
Place of birth for the foreign-born population - India (%)
Place of birth for the foreign-born population - Iran (%)
Place of birth for the foreign-born population - Kazakhstan (%)
Place of birth for the foreign-born population - Nepal (%)
Place of birth for the foreign-born population - Pakistan (%)
Place of birth for the foreign-born population - Sri Lanka (%)
Place of birth for the foreign-born population - Uzbekistan (%)
Place of birth for the foreign-born population - Other South Central Asia (%)
Place of birth for the foreign-born population - Burma (%)
Place of birth for the foreign-born population - Cambodia (%)
Place of birth for the foreign-born population - Indonesia (%)
Place of birth for the foreign-born population - Laos (%)
Place of birth for the foreign-born population - Malaysia (%)
Place of birth for the foreign-born population - Philippines (%)
Place of birth for the foreign-born population - Singapore (%)
Place of birth for the foreign-born population - Thailand (%)
Place of birth for the foreign-born population - Vietnam (%)
Place of birth for the foreign-born population - Other South Eastern Asia (%)
Place of birth for the foreign-born population - Armenia (%)
Place of birth for the foreign-born population - Iraq (%)
Place of birth for the foreign-born population - Israel (%)
Place of birth for the foreign-born population - Jordan (%)
Place of birth for the foreign-born population - Kuwait (%)
Place of birth for the foreign-born population - Lebanon (%)
Place of birth for the foreign-born population - Saudi Arabia (%)
Place of birth for the foreign-born population - Syria (%)
Place of birth for the foreign-born population - Turkey (%)
Place of birth for the foreign-born population - Yemen (%)
Place of birth for the foreign-born population - Other Western Asia (%)
Place of birth for the foreign-born population - Eritrea (%)
Place of birth for the foreign-born population - Ethiopia (%)
Place of birth for the foreign-born population - Kenya (%)
Place of birth for the foreign-born population - Somalia (%)
Place of birth for the foreign-born population - Uganda (%)
Place of birth for the foreign-born population - Zimbabwe (%)
Place of birth for the foreign-born population - Other Eastern Africa (%)
Place of birth for the foreign-born population - Cameroon (%)
Place of birth for the foreign-born population - Congo (%)
Place of birth for the foreign-born population - Democratic Republic of Congo (Zaire) (%)
Place of birth for the foreign-born population - Other Middle Africa (%)
Place of birth for the foreign-born population - Egypt (%)
Place of birth for the foreign-born population - Morocco (%)
Place of birth for the foreign-born population - Sudan (%)
Place of birth for the foreign-born population - Other Northern Africa (%)
Place of birth for the foreign-born population - South Africa (%)
Place of birth for the foreign-born population - Other Southern Africa (%)
Place of birth for the foreign-born population - Cabo Verde (%)
Place of birth for the foreign-born population - Ghana (%)
Place of birth for the foreign-born population - Liberia (%)
Place of birth for the foreign-born population - Nigeria (%)
Place of birth for the foreign-born population - Senegal (%)
Place of birth for the foreign-born population - Sierra Leone (%)
Place of birth for the foreign-born population - Other Western Africa (%)
Place of birth for the foreign-born population - Australia (%)
Place of birth for the foreign-born population - New Zealand (%)
Place of birth for the foreign-born population - Fiji (%)
Place of birth for the foreign-born population - Micronesia (%)
Place of birth for the foreign-born population - Bahamas (%)
Place of birth for the foreign-born population - Barbados (%)
Place of birth for the foreign-born population - Cuba (%)
Place of birth for the foreign-born population - Dominica (%)
Place of birth for the foreign-born population - Dominican Republic (%)
Place of birth for the foreign-born population - Grenada (%)
Place of birth for the foreign-born population - Haiti (%)
Place of birth for the foreign-born population - Jamaica (%)
Place of birth for the foreign-born population - St. Vincent and the Grenadines (%)
Place of birth for the foreign-born population - Trinidad and Tobago (%)
Place of birth for the foreign-born population - West Indies (%)
Place of birth for the foreign-born population - Other Caribbean (%)
Place of birth for the foreign-born population - Belize (%)
Place of birth for the foreign-born population - Costa Rica (%)
Place of birth for the foreign-born population - El Salvador (%)
Place of birth for the foreign-born population - Guatemala (%)
Place of birth for the foreign-born population - Honduras (%)
Place of birth for the foreign-born population - Mexico (%)
Place of birth for the foreign-born population - Nicaragua (%)
Place of birth for the foreign-born population - Panama (%)
Place of birth for the foreign-born population - Other Central America (%)
Place of birth for the foreign-born population - Argentina (%)
Place of birth for the foreign-born population - Bolivia (%)
Place of birth for the foreign-born population - Brazil (%)
Place of birth for the foreign-born population - Chile (%)
Place of birth for the foreign-born population - Colombia (%)
Place of birth for the foreign-born population - Ecuador (%)
Place of birth for the foreign-born population - Guyana (%)
Place of birth for the foreign-born population - Peru (%)
Place of birth for the foreign-born population - Uruguay (%)
Place of birth for the foreign-born population - Venezuela (%)
Place of birth for the foreign-born population - Other South America (%)
Place of birth for the foreign-born population - Canada (%)
Place of birth for the foreign-born population - Other Northern America (%)
Place of birth for the foreign-born population - Other (%)
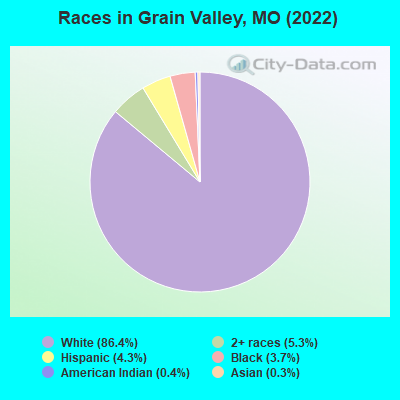
According to 2022 data, the most numerous races in Grain Valley, MO are White alone (13,573 residents), Black alone (585 residents), and Two or more races (836 residents). 96.6% of Grain Valley residents speak English at home. 1.6% of Grain Valley, MO residents are foreign-born , which is 151.4% less than the foreign-born rate of 4.0% across the entire state of Missouri.
Race distribution in Grain Valley
2000 2022
4,686,474 83.8% White alone 625,667 11.2% Black alone 118,592 2.1% Hispanic 71,905 1.3% Two or more races 61,041 1.1% Asian alone 23,302 0.4% American Indian alone 5,291 0.09% Other race alone 2,939 0.05% Native Hawaiian and Other
4,733,411 76.6% White alone 656,739 10.6% Black alone 316,300 5.1% Two or more races 291,763 4.7% Hispanic 132,436 2.1% Asian alone 27,467 0.4% Other race alone 12,313 0.2% American Indian alone 7,528 0.1% Native Hawaiian and Other
Income and house value in Grain Valley Median household income in 2022 $78,998 White non-Hispanic householders$97,235 Black householders$75,309 Two or more races householders$78,967 Hispanic or Latino race householdersMedian 2022 house value $291,434 White Non-Hispanic householders$317,390 Black or African American householders $257,861 Asian householders$387,921 Some other race householders$282,124 Two or more races householders$248,551 Hispanic or Latino householders
Median age by race in Grain Valley
37.4 Median age for White residents37.6 37.1 17.9 Median age for Black or African American residents18.5 17.6 21.6 Median age for American Indian / Alaska Native residents20.7 -770,780,855.7 -692,810,456.8 Median age for Asian residents-711,500,973.9 -673,893,404.9 -832,285,114.5 Median age for Native Hawaiian / Pacific Islander residents-678,601,874.9 -752,136,751.4 38.4 Median age for Other race residents-723,346,827.9 22.3 17.4 Median age for Two or more races residents12.7 30.0 37.2 Median age for White alone residents37.4 37.0 23.3 Median age for Hispanic or Latino residents23.2 23.4
Owner/renter occupied households by race in Grain Valley
House owners and renters - White residents 3,515 65.1% Owner occupied1,885 34.9% Renter occupiedHouse owners and renters - Black or African American residents 161 100.0% Owner occupiedHouse owners and renters - American Indian / Alaska Native residents 9 38.9% Owner occupied14 61.1% Renter occupiedHouse owners and renters - Other race residents 44 100.0% Owner occupiedHouse owners and renters - Two or more races residents 199 69.5% Owner occupied87 30.5% Renter occupiedHouse owners and renters - White alone residents 3,484 64.4% Owner occupied1,927 35.6% Renter occupiedHouse owners and renters - Hispanic or Latino residents 190 87.9% Owner occupied26 12.1% Renter occupied
Language usage in Grain Valley
English speakers - Total 96.6% of residents of Grain Valley speak English at home.
2.0% of residents speak Spanish at home 188 61.8% Speak English very well116 38.2% Speak English less than very well1.3% of residents speak other language at home 173 91.1% Speak English very well17 8.9% Speak English less than very well
English speakers - Born in the United States 99.5% of residents of Grain Valley speak English at home.
English speakers - Native, born elsewhere 32.3% of residents of Grain Valley speak English at home.
65.9% of residents speak Spanish at home 49 45.4% Speak English very well59 54.6% Speak English less than very well12.8% of residents speak other language at home 21 100.0% Speak English very well
English speakers - Foreign-born 23.7% of residents of Grain Valley speak English at home.
43.9% of residents speak Spanish at home 65 56.5% Speak English very well50 43.5% Speak English less than very well32.1% of residents speak other language at home 66 78.6% Speak English very well18 21.4% Speak English less than very well
White (Caucasian) - Speak only English Native:
99.3% (12,822)Foreign-born:
40.8% (36)
White (Caucasian) - Speak another language Native:
1.1% (136)Foreign-born:
60.4% (53)
Other race - Speak another language Native:
9.4% (6)Foreign-born:
94.7% (60)
Two or more races - Speak another language Native:
14.0% (130)Foreign-born:
100.0% (60)
White alone - Speak only English Native:
99.0% (12,723)Foreign-born:
36.6% (36)
White alone - Speak another language Native:
1.0% (125)Foreign-born:
63.4% (62)
Hispanic or Latino - Speak another language Native:
31.7% (141)Foreign-born:
99.9% (119)
Foreign-born residents in Grain Valley 250 residents are foreign born
This city:
1.6%Missouri:
4.2%
Marital status for residents in Grain Valley Marital status - White (Caucasian) population 15 years and over
Males 33.9% Never married50.7% Now married1.1% Separated0.4% Widowed14.0% DivorcedFemales 26.5% Never married46.8% Now married2.4% Separated8.4% Widowed15.9% DivorcedWomen who gave birth in the past 12 months Now married:
97.2% (170)Unmarried:
2.8% (5)
Women who did not give birth in the past 12 months Now married:
49.9% (1,684)Unmarried:
50.1% (1,689)
Marital status - Black or African American population 15 years and over
Males 11.6% Never married77.4% Now married0.0% Separated0.0% Widowed11.0% DivorcedFemales 18.1% Never married76.2% Now married0.0% Separated5.6% Widowed0.0% DivorcedWomen who did not give birth in the past 12 months Now married:
80.8% (116)Unmarried:
19.2% (28)
Marital status - Other race population 15 years and over
Males 0.0% Never married100.0% Now married0.0% Separated0.0% Widowed0.0% DivorcedFemales 60.5% Never married39.5% Now married0.0% Separated0.0% Widowed0.0% DivorcedWomen who did not give birth in the past 12 months Now married:
30.3% (29)Unmarried:
69.7% (67)
Marital status - Two or more races population 15 years and over
Males 51.0% Never married49.0% Now married0.0% Separated0.0% Widowed0.0% DivorcedFemales 19.4% Never married48.1% Now married10.9% Separated14.0% Widowed7.8% DivorcedWomen who did not give birth in the past 12 months Now married:
59.1% (197)Unmarried:
40.9% (136)
Marital status - White alone, not Hispanic / Latino population 15 years and over
Males 33.9% Never married50.3% Now married1.1% Separated0.4% Widowed14.3% DivorcedFemales 26.0% Never married47.0% Now married2.4% Separated8.5% Widowed16.1% DivorcedWomen who gave birth in the past 12 months Now married:
97.2% (176)Unmarried:
2.8% (5)
Women who did not give birth in the past 12 months Now married:
50.3% (1,721)Unmarried:
49.7% (1,700)
Marital status - Hispanic or Latino population 15 years and over
Males 29.7% Never married70.3% Now married0.0% Separated0.0% Widowed0.0% DivorcedFemales 51.4% Never married48.6% Now married0.0% Separated0.0% Widowed0.0% DivorcedWomen who did not give birth in the past 12 months Now married:
37.1% (71)Unmarried:
62.9% (120)
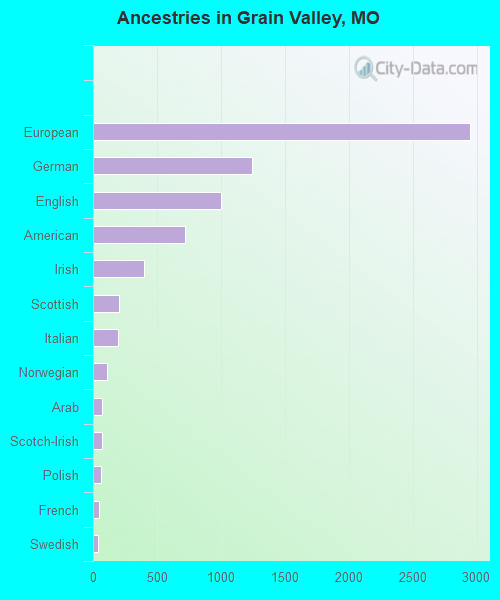
Ancestries in Grain Valley
2,950 37.9% European1,247 16.0% German1,001 12.9% English721 9.3% American396 5.1% Irish205 2.6% Scottish192 2.5% Italian106 1.4% Norwegian72 0.9% Arab68 0.9% Scotch-Irish60 0.8% Polish44 0.6% French42 0.5% Swedish23 0.3% Scandinavian15 0.2% Basque15 0.2% African13 0.2% Czechoslovakian8 0.1% British5 0.06% Russian1 0.01% Swiss
Children Nativity (place of birth) in Grain Valley
Children under 6 years - Living with two parents Both parents native 825 100.0% NativeOne native, one foreign-born parent 36 100.0% NativeChildren under 6 years - Living with one parent Native parent 243 100.0% Native
Children 6 to 17 years - Living with two parents Both parents native 2,362 100.0% NativeBoth parents foreign-born 40 100.0% NativeOne native, one foreign-born parent 41 100.0% NativeChildren 6 to 17 years - Living with one parent Native parent 841 100.0% Native
Grandparents responsible for own grandchildren in Grain Valley
Grandparents (30 to 59 years) White / Caucasian 18 64.3% Responsible for grandchildren10 35.7% Not responsible for grandchildrenHispanic or Latino 23 64.4% Responsible for grandchildren13 35.6% Not responsible for grandchildren
Grandparents (60 years and over) White / Caucasian 45 100.0% Not responsible for grandchildren