Races in Gracewood, Georgia (GA) Detailed Stats
Ancestries, Foreign-born residents, place of birth
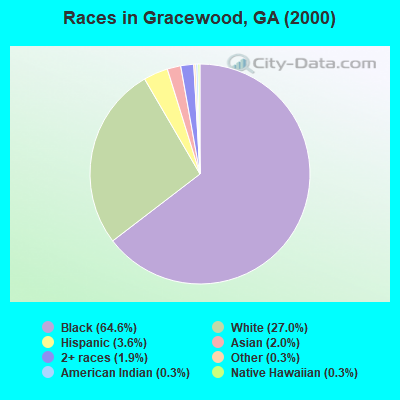
Race distribution in Gracewood

- 22,32364.6%Black alone
- 9,32227.0%White alone
- 1,2583.6%Hispanic
- 6872.0%Asian alone
- 6621.9%Two or more races
- 1070.3%Other race alone
- 1010.3%American Indian alone
- 930.3%Native Hawaiian and Other
Pacific Islander alone
2000
2022
-
- 5,128,66162.6%White alone
- 2,331,46528.5%Black alone
- 435,2275.3%Hispanic
- 171,5132.1%Asian alone
- 87,3641.1%Two or more races
- 17,6700.2%American Indian alone
- 11,2750.1%Other race alone
- 3,2780.04%Native Hawaiian and Other
Pacific Islander alone

-
- 5,415,65749.6%White alone
- 3,349,24030.7%Black alone
- 1,132,60410.4%Hispanic
- 479,1564.4%Asian alone
- 462,9234.2%Two or more races
- 54,4160.5%Other race alone
- 11,9230.1%American Indian alone
- 6,9570.06%Native Hawaiian and Other
Pacific Islander alone

Income and house value in Gracewood
- Median household income in 2022
- $63,672White non-Hispanic householders
- $62,800Black householders
- $47,074American Indian and Alaska Native householders
- $70,375Asian householders
- $52,736Some other race householders
- $56,359Two or more races householders
- $82,405Hispanic or Latino race householders
- Median 2022 house value
- $154,133White Non-Hispanic householders
- $164,051Black or African American householders
- $181,111American Indian or Alaska Native householders
- $141,635Asian householders
- $137,866Native Hawaiian and other Pacific Islander householders
- $169,605Some other race householders
- $154,331Two or more races householders
- $160,480Hispanic or Latino householders
Household income for White non-Hispanic householders

Household income for Black householders

Household income for American Indian and Alaska Native householders

Household income for Asian householders

Household income for Native Hawaiian and other Pacific Islander householders

Household income for Two or more races householders

Household income for Hispanic or Latino race householders

Zip code: 30906