Races in Glenn Dale, Maryland (MD) Detailed Stats
Data:
Races - White alone (%)
Races - White alone (% change since 2000)
Races - Black alone (%)
Races - Black alone (% change since 2000)
Races - American Indian alone (%)
Races - American Indian alone (% change since 2000)
Races - Asian alone (%)
Races - Asian alone (% change since 2000)
Races - Hispanic (%)
Races - Hispanic (% change since 2000)
Races - Native Hawaiian and Other Pacific Islander alone (%)
Races - Native Hawaiian and Other Pacific Islander alone (% change since 2000)
Races - Two or more races(%)
Races - Two or more races(% change since 2000)
Races - Other race alone (%)
Races - Other race alone (% change since 2000)
Racial diversity
Place of birth - Born in state of residence (%)
Place of birth - Born in state of residence (%) - White
Place of birth - Born in state of residence (%) - Black or African American
Place of birth - Born in state of residence (%) - Asian
Place of birth - Born in state of residence (%) - Hispanic or Latino
Place of birth - Born in state of residence (%) - American Indian and Alaska Native
Place of birth - Born in state of residence (%) - Multirace
Place of birth - Born in state of residence (%) - Other Race
Place of birth - Born in other state (%)
Place of birth - Born in other state (%) - White
Place of birth - Born in other state (%) - Black or African American
Place of birth - Born in other state (%) - Asian
Place of birth - Born in other state (%) - Hispanic or Latino
Place of birth - Born in other state (%) - American Indian and Alaska Native
Place of birth - Born in other state (%) - Multirace
Place of birth - Born in other state (%) - Other Race
Place of birth - Native, outside of US (%)
Place of birth - Native, outside of US (%) - White
Place of birth - Native, outside of US (%) - Black or African American
Place of birth - Native, outside of US (%) - Asian
Place of birth - Native, outside of US (%) - Hispanic or Latino
Place of birth - Native, outside of US (%) - American Indian and Alaska Native
Place of birth - Native, outside of US (%) - Multirace
Place of birth - Native, outside of US (%) - Other Race
Place of birth - Foreign born (%)
Place of birth - Foreign born (%) - White
Place of birth - Foreign born (%) - Black or African American
Place of birth - Foreign born (%) - Asian
Place of birth - Foreign born (%) - Hispanic or Latino
Place of birth - Foreign born (%) - American Indian and Alaska Native
Place of birth - Foreign born (%) - Multirace
Place of birth - Foreign born (%) - Other Race
Residents speaking English at home (%)
Residents speaking English at home - Born in the United States (%)
Residents speaking English at home - Native, born elsewhere (%)
Residents speaking English at home - Foreign born (%)
Residents speaking Spanish at home (%)
Residents speaking Spanish at home - Born in the United States (%)
Residents speaking Spanish at home - Native, born elsewhere (%)
Residents speaking Spanish at home - Foreign born (%)
Residents speaking other language at home (%)
Residents speaking other language at home - Born in the United States (%)
Residents speaking other language at home - Native, born elsewhere (%)
Residents speaking other language at home - Foreign born (%)
Marital status - Never married (%)
Marital status - Now married (%)
Marital status - Separated (%)
Marital status - Widowed (%)
Marital status - Divorced (%)
Ancestries Reported - Arab (%)
Ancestries Reported - Czech (%)
Ancestries Reported - Danish (%)
Ancestries Reported - Dutch (%)
Ancestries Reported - English (%)
Ancestries Reported - French (%)
Ancestries Reported - French Canadian (%)
Ancestries Reported - German (%)
Ancestries Reported - Greek (%)
Ancestries Reported - Hungarian (%)
Ancestries Reported - Irish (%)
Ancestries Reported - Italian (%)
Ancestries Reported - Lithuanian (%)
Ancestries Reported - Norwegian (%)
Ancestries Reported - Polish (%)
Ancestries Reported - Portuguese (%)
Ancestries Reported - Russian (%)
Ancestries Reported - Scotch-Irish (%)
Ancestries Reported - Scottish (%)
Ancestries Reported - Slovak (%)
Ancestries Reported - Subsaharan African (%)
Ancestries Reported - Swedish (%)
Ancestries Reported - Swiss (%)
Ancestries Reported - Ukrainian (%)
Ancestries Reported - United States (%)
Ancestries Reported - Welsh (%)
Ancestries Reported - West Indian (%)
Ancestries Reported - Other (%)
Geographical mobility - Same house 1 year ago (%)
Geographical mobility - Same house 1 year ago (%) - White
Geographical mobility - Same house 1 year ago (%) - Black or African American
Geographical mobility - Same house 1 year ago (%) - Asian
Geographical mobility - Same house 1 year ago (%) - Hispanic or Latino
Geographical mobility - Same house 1 year ago (%) - American Indian and Alaska Native
Geographical mobility - Same house 1 year ago (%) - Multirace
Geographical mobility - Same house 1 year ago (%) - Other Race
Geographical mobility - Moved within same county (%)
Geographical mobility - Moved within same county (%) - White
Geographical mobility - Moved within same county (%) - Black or African American
Geographical mobility - Moved within same county (%) - Asian
Geographical mobility - Moved within same county (%) - Hispanic or Latino
Geographical mobility - Moved within same county (%) - American Indian and Alaska Native
Geographical mobility - Moved within same county (%) - Multirace
Geographical mobility - Moved within same county (%) - Other Race
Geographical mobility - Moved from different county within same state (%)
Geographical mobility - Moved from different county within same state (%) - White
Geographical mobility - Moved from different county within same state (%) - Black or African American
Geographical mobility - Moved from different county within same state (%) - Asian
Geographical mobility - Moved from different county within same state (%) - Hispanic or Latino
Geographical mobility - Moved from different county within same state (%) - American Indian and Alaska Native
Geographical mobility - Moved from different county within same state (%) - Multirace
Geographical mobility - Moved from different county within same state (%) - Other Race
Geographical mobility - Moved from different state (%)
Geographical mobility - Moved from different state (%) - White
Geographical mobility - Moved from different state (%) - Black or African American
Geographical mobility - Moved from different state (%) - Asian
Geographical mobility - Moved from different state (%) - Hispanic or Latino
Geographical mobility - Moved from different state (%) - American Indian and Alaska Native
Geographical mobility - Moved from different state (%) - Multirace
Geographical mobility - Moved from different state (%) - Other Race
Geographical mobility - Moved from abroad (%)
Geographical mobility - Moved from abroad (%) - White
Geographical mobility - Moved from abroad (%) - Black or African American
Geographical mobility - Moved from abroad (%) - Asian
Geographical mobility - Moved from abroad (%) - Hispanic or Latino
Geographical mobility - Moved from abroad (%) - American Indian and Alaska Native
Geographical mobility - Moved from abroad (%) - Multirace
Geographical mobility - Moved from abroad (%) - Other Race
Place of birth for the foreign-born population - Ireland (%)
Place of birth for the foreign-born population - Denmark (%)
Place of birth for the foreign-born population - Norway (%)
Place of birth for the foreign-born population - Sweden (%)
Place of birth for the foreign-born population - United Kingdom (%)
Place of birth for the foreign-born population - England (%)
Place of birth for the foreign-born population - Scotland (%)
Place of birth for the foreign-born population - Other Northern Europe (%)
Place of birth for the foreign-born population - Austria (%)
Place of birth for the foreign-born population - Belgium (%)
Place of birth for the foreign-born population - France (%)
Place of birth for the foreign-born population - Germany (%)
Place of birth for the foreign-born population - Netherlands (%)
Place of birth for the foreign-born population - Switzerland (%)
Place of birth for the foreign-born population - Other Western Europe (%)
Place of birth for the foreign-born population - Greece (%)
Place of birth for the foreign-born population - Italy (%)
Place of birth for the foreign-born population - Portugal (%)
Place of birth for the foreign-born population - Spain (%)
Place of birth for the foreign-born population - Other Southern Europe (%)
Place of birth for the foreign-born population - Albania (%)
Place of birth for the foreign-born population - Belarus (%)
Place of birth for the foreign-born population - Bosnia and Herzegovina (%)
Place of birth for the foreign-born population - Bulgaria (%)
Place of birth for the foreign-born population - Croatia (%)
Place of birth for the foreign-born population - Czechoslovakia (%)
Place of birth for the foreign-born population - Hungary (%)
Place of birth for the foreign-born population - Latvia (%)
Place of birth for the foreign-born population - Lithuania (%)
Place of birth for the foreign-born population - North Macedonia (Macedonia) (%)
Place of birth for the foreign-born population - Moldova (%)
Place of birth for the foreign-born population - Poland (%)
Place of birth for the foreign-born population - Romania (%)
Place of birth for the foreign-born population - Russia (%)
Place of birth for the foreign-born population - Serbia (%)
Place of birth for the foreign-born population - Ukraine (%)
Place of birth for the foreign-born population - Other Eastern Europe (%)
Place of birth for the foreign-born population - China (%)
Place of birth for the foreign-born population - Hong Kong (%)
Place of birth for the foreign-born population - Taiwan (%)
Place of birth for the foreign-born population - Japan (%)
Place of birth for the foreign-born population - Korea (%)
Place of birth for the foreign-born population - Other Eastern Asia (%)
Place of birth for the foreign-born population - Afghanistan (%)
Place of birth for the foreign-born population - Bangladesh (%)
Place of birth for the foreign-born population - India (%)
Place of birth for the foreign-born population - Iran (%)
Place of birth for the foreign-born population - Kazakhstan (%)
Place of birth for the foreign-born population - Nepal (%)
Place of birth for the foreign-born population - Pakistan (%)
Place of birth for the foreign-born population - Sri Lanka (%)
Place of birth for the foreign-born population - Uzbekistan (%)
Place of birth for the foreign-born population - Other South Central Asia (%)
Place of birth for the foreign-born population - Burma (%)
Place of birth for the foreign-born population - Cambodia (%)
Place of birth for the foreign-born population - Indonesia (%)
Place of birth for the foreign-born population - Laos (%)
Place of birth for the foreign-born population - Malaysia (%)
Place of birth for the foreign-born population - Philippines (%)
Place of birth for the foreign-born population - Singapore (%)
Place of birth for the foreign-born population - Thailand (%)
Place of birth for the foreign-born population - Vietnam (%)
Place of birth for the foreign-born population - Other South Eastern Asia (%)
Place of birth for the foreign-born population - Armenia (%)
Place of birth for the foreign-born population - Iraq (%)
Place of birth for the foreign-born population - Israel (%)
Place of birth for the foreign-born population - Jordan (%)
Place of birth for the foreign-born population - Kuwait (%)
Place of birth for the foreign-born population - Lebanon (%)
Place of birth for the foreign-born population - Saudi Arabia (%)
Place of birth for the foreign-born population - Syria (%)
Place of birth for the foreign-born population - Turkey (%)
Place of birth for the foreign-born population - Yemen (%)
Place of birth for the foreign-born population - Other Western Asia (%)
Place of birth for the foreign-born population - Eritrea (%)
Place of birth for the foreign-born population - Ethiopia (%)
Place of birth for the foreign-born population - Kenya (%)
Place of birth for the foreign-born population - Somalia (%)
Place of birth for the foreign-born population - Uganda (%)
Place of birth for the foreign-born population - Zimbabwe (%)
Place of birth for the foreign-born population - Other Eastern Africa (%)
Place of birth for the foreign-born population - Cameroon (%)
Place of birth for the foreign-born population - Congo (%)
Place of birth for the foreign-born population - Democratic Republic of Congo (Zaire) (%)
Place of birth for the foreign-born population - Other Middle Africa (%)
Place of birth for the foreign-born population - Egypt (%)
Place of birth for the foreign-born population - Morocco (%)
Place of birth for the foreign-born population - Sudan (%)
Place of birth for the foreign-born population - Other Northern Africa (%)
Place of birth for the foreign-born population - South Africa (%)
Place of birth for the foreign-born population - Other Southern Africa (%)
Place of birth for the foreign-born population - Cabo Verde (%)
Place of birth for the foreign-born population - Ghana (%)
Place of birth for the foreign-born population - Liberia (%)
Place of birth for the foreign-born population - Nigeria (%)
Place of birth for the foreign-born population - Senegal (%)
Place of birth for the foreign-born population - Sierra Leone (%)
Place of birth for the foreign-born population - Other Western Africa (%)
Place of birth for the foreign-born population - Australia (%)
Place of birth for the foreign-born population - New Zealand (%)
Place of birth for the foreign-born population - Fiji (%)
Place of birth for the foreign-born population - Micronesia (%)
Place of birth for the foreign-born population - Bahamas (%)
Place of birth for the foreign-born population - Barbados (%)
Place of birth for the foreign-born population - Cuba (%)
Place of birth for the foreign-born population - Dominica (%)
Place of birth for the foreign-born population - Dominican Republic (%)
Place of birth for the foreign-born population - Grenada (%)
Place of birth for the foreign-born population - Haiti (%)
Place of birth for the foreign-born population - Jamaica (%)
Place of birth for the foreign-born population - St. Vincent and the Grenadines (%)
Place of birth for the foreign-born population - Trinidad and Tobago (%)
Place of birth for the foreign-born population - West Indies (%)
Place of birth for the foreign-born population - Other Caribbean (%)
Place of birth for the foreign-born population - Belize (%)
Place of birth for the foreign-born population - Costa Rica (%)
Place of birth for the foreign-born population - El Salvador (%)
Place of birth for the foreign-born population - Guatemala (%)
Place of birth for the foreign-born population - Honduras (%)
Place of birth for the foreign-born population - Mexico (%)
Place of birth for the foreign-born population - Nicaragua (%)
Place of birth for the foreign-born population - Panama (%)
Place of birth for the foreign-born population - Other Central America (%)
Place of birth for the foreign-born population - Argentina (%)
Place of birth for the foreign-born population - Bolivia (%)
Place of birth for the foreign-born population - Brazil (%)
Place of birth for the foreign-born population - Chile (%)
Place of birth for the foreign-born population - Colombia (%)
Place of birth for the foreign-born population - Ecuador (%)
Place of birth for the foreign-born population - Guyana (%)
Place of birth for the foreign-born population - Peru (%)
Place of birth for the foreign-born population - Uruguay (%)
Place of birth for the foreign-born population - Venezuela (%)
Place of birth for the foreign-born population - Other South America (%)
Place of birth for the foreign-born population - Canada (%)
Place of birth for the foreign-born population - Other Northern America (%)
Place of birth for the foreign-born population - Other (%)
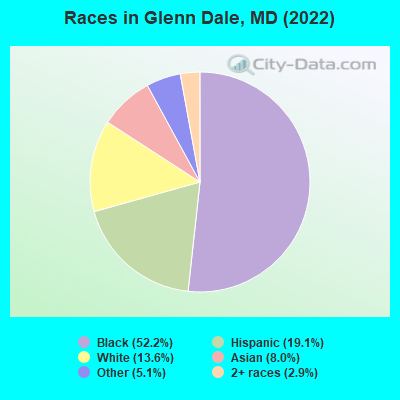
According to 2022 data, the most numerous races in Glenn Dale, MD are White alone (2,049 residents), Black alone (7,867 residents), and Hispanic (2,873 residents). 65.0% of Glenn Dale residents speak English at home. 27.0% of Glenn Dale, MD residents are foreign-born (11.4% born in Africa, 7.4% born in Latin America, 5.5% born in Asia), which is 40.7% greater than the foreign-born rate of 16.0% across the entire state of Maryland.
Race distribution in Glenn Dale
2000 2022
3,286,547 62.1% White alone 1,464,735 27.7% Black alone 227,916 4.3% Hispanic 209,738 4.0% Asian alone 82,946 1.6% Two or more races 13,312 0.3% American Indian alone 9,379 0.2% Other race alone 1,913 0.04% Native Hawaiian and Other
2,906,492 47.1% White alone 1,800,914 29.2% Black alone 705,842 11.4% Hispanic 401,818 6.5% Asian alone 291,317 4.7% Two or more races 46,930 0.8% Other race alone 8,930 0.1% American Indian alone 2,417 0.04% Native Hawaiian and Other
Income and house value in Glenn Dale Median household income in 2022 $136,478 White non-Hispanic householders$146,775 Black householders$107,423 Asian householders$81,117 Some other race householders$174,161 Two or more races householders$83,452 Hispanic or Latino race householdersMedian 2022 house value $502,064 White Non-Hispanic householders$563,100 Black or African American householders$607,662 American Indian or Alaska Native householders $590,107 Asian householders$425,363 Some other race householders$580,114 Two or more races householders$438,867 Hispanic or Latino householders
Median age by race in Glenn Dale
40.5 Median age for White residents39.5 45.7 44.1 Median age for Black or African American residents40.2 46.1 -780,410,741.7 Median age for American Indian / Alaska Native residents-888,297,871.5 -689,905,591.2 44.6 Median age for Asian residents42.2 45.0 -571,600,480.8 Median age for Native Hawaiian / Pacific Islander residents-720,061,021.4 -760,942,760.2 34.2 Median age for Other race residents25.8 42.2 17.7 Median age for Two or more races residents20.1 17.8 57.8 Median age for White alone residents51.1 58.3 19.2 Median age for Hispanic or Latino residents17.3 23.7
Owner/renter occupied households by race in Glenn Dale
House owners and renters - White residents 869 91.6% Owner occupied80 8.4% Renter occupiedHouse owners and renters - Black or African American residents 2,350 86.1% Owner occupied378 13.9% Renter occupiedHouse owners and renters - Asian residents 446 100.0% Owner occupiedHouse owners and renters - Native Hawaiian / Pacific Islander residents 3 100.0% Owner occupiedHouse owners and renters - Other race residents 391 90.2% Owner occupied42 9.8% Renter occupiedHouse owners and renters - Two or more races residents 145 100.0% Owner occupiedHouse owners and renters - White alone residents 711 98.2% Owner occupied13 1.8% Renter occupiedHouse owners and renters - Hispanic or Latino residents 440 79.6% Owner occupied113 20.4% Renter occupied
Language usage in Glenn Dale
English speakers - Total 65.0% of residents of Glenn Dale speak English at home.
16.4% of residents speak Spanish at home 1,503 65.0% Speak English very well809 35.0% Speak English less than very well20.0% of residents speak other language at home 2,474 88.0% Speak English very well338 12.0% Speak English less than very well
English speakers - Born in the United States 91.3% of residents of Glenn Dale speak English at home.
7.3% of residents speak Spanish at home 382 93.6% Speak English very well26 6.4% Speak English less than very well0.8% of residents speak other language at home 33 75.0% Speak English very well11 25.0% Speak English less than very well
English speakers - Native, born elsewhere 10.1% of residents of Glenn Dale speak English at home.
46.9% of residents speak Spanish at home 82 51.9% Speak English very well76 48.1% Speak English less than very well17.5% of residents speak other language at home 59 100.0% Speak English very well
English speakers - Foreign-born 23.5% of residents of Glenn Dale speak English at home.
24.0% of residents speak Spanish at home 357 36.3% Speak English very well627 63.7% Speak English less than very well55.9% of residents speak other language at home 1,970 85.9% Speak English very well324 14.1% Speak English less than very well
White (Caucasian) - Speak only English Native:
86.5% (1,851)Foreign-born:
21.7% (42)
White (Caucasian) - Speak another language Native:
13.2% (282)Foreign-born:
77.2% (148)
Black or African American - Speak only English Native:
93.9% (5,265)Foreign-born:
35.9% (807)
Black or African American - Speak another language Native:
6.4% (361)Foreign-born:
64.3% (1,445)
Asian - Speak only English Native:
60.2% (301)Foreign-born:
13.5% (93)
Asian - Speak another language Native:
28.2% (141)Foreign-born:
86.3% (597)
Other race - Speak only English Native:
34.9% (455)Foreign-born:
1.2% (9)
Other race - Speak another language Native:
67.9% (886)Foreign-born:
99.2% (781)
Two or more races - Speak only English Native:
73.4% (334)Foreign-born:
13.8% (9)
Two or more races - Speak another language Native:
27.0% (123)Foreign-born:
88.0% (56)
White alone - Speak only English Native:
94.4% (1,731)Foreign-born:
35.0% (47)
White alone - Speak another language Native:
5.6% (103)Foreign-born:
65.2% (87)
Hispanic or Latino - Speak only English Native:
18.6% (243)Foreign-born:
1.0% (9)
Hispanic or Latino - Speak another language Native:
81.0% (1,058)Foreign-born:
99.6% (896)
Foreign-born residents in Glenn Dale 4,069 residents are foreign born (11.4% Africa , 7.4% Latin America , 5.5% Asia ).
This city:
27.0%Maryland:
15.7%
Marital status for residents in Glenn Dale Marital status - White (Caucasian) population 15 years and over
Males 19.0% Never married72.9% Now married0.0% Separated3.4% Widowed4.7% DivorcedFemales 11.1% Never married63.0% Now married0.0% Separated20.1% Widowed5.7% DivorcedWomen who gave birth in the past 12 months Now married:
100.0% (22)Unmarried:
0.0% (0)
Women who did not give birth in the past 12 months Now married:
67.8% (264)Unmarried:
32.2% (126)
Marital status - Black or African American population 15 years and over
Males 39.5% Never married53.9% Now married0.5% Separated2.1% Widowed4.1% DivorcedFemales 36.4% Never married45.6% Now married0.0% Separated3.0% Widowed15.1% DivorcedWomen who gave birth in the past 12 months Now married:
75.0% (48)Unmarried:
25.0% (16)
Women who did not give birth in the past 12 months Now married:
38.4% (725)Unmarried:
61.6% (1,163)
Marital status - Asian population 15 years and over
Males 28.8% Never married71.2% Now married0.0% Separated0.0% Widowed0.0% DivorcedFemales 22.2% Never married60.8% Now married0.0% Separated8.2% Widowed8.9% DivorcedWomen who gave birth in the past 12 months Now married:
100.0% (11)Unmarried:
0.0% (0)
Women who did not give birth in the past 12 months Now married:
61.3% (158)Unmarried:
38.7% (100)
Marital status - Other race population 15 years and over
Males 35.8% Never married60.0% Now married4.2% Separated0.0% Widowed0.0% DivorcedFemales 32.0% Never married57.6% Now married0.0% Separated0.0% Widowed10.4% DivorcedWomen who gave birth in the past 12 months Now married:
100.0% (54)Unmarried:
0.0% (0)
Women who did not give birth in the past 12 months Now married:
33.0% (192)Unmarried:
67.0% (391)
Marital status - Two or more races population 15 years and over
Males 70.1% Never married25.4% Now married4.5% Separated0.0% Widowed0.0% DivorcedFemales 68.7% Never married21.4% Now married0.0% Separated0.0% Widowed9.9% DivorcedWomen who did not give birth in the past 12 months Now married:
17.4% (21)Unmarried:
82.6% (98)
Marital status - White alone, not Hispanic / Latino population 15 years and over
Males 17.9% Never married73.1% Now married0.0% Separated4.3% Widowed4.7% DivorcedFemales 11.4% Never married60.2% Now married0.0% Separated22.1% Widowed6.2% DivorcedWomen who gave birth in the past 12 months Now married:
100.0% (24)Unmarried:
0.0% (0)
Women who did not give birth in the past 12 months Now married:
63.5% (226)Unmarried:
36.5% (129)
Marital status - Hispanic or Latino population 15 years and over
Males 34.7% Never married59.0% Now married5.0% Separated0.0% Widowed1.3% DivorcedFemales 34.5% Never married52.7% Now married0.0% Separated0.0% Widowed12.8% DivorcedWomen who gave birth in the past 12 months Now married:
100.0% (35)Unmarried:
0.0% (0)
Women who did not give birth in the past 12 months Now married:
43.8% (254)Unmarried:
56.2% (326)
Ancestries in Glenn Dale
944 10.0% Nigerian461 4.9% African427 4.5% Zimbabwean388 4.1% American242 2.6% Sierra Leonean132 1.4% Ethiopian120 1.3% English86 0.9% Liberian76 0.8% Afghan67 0.7% Irish60 0.6% Jamaican54 0.6% Trinidadian and Tobagonian42 0.4% Polish41 0.4% Haitian40 0.4% German39 0.4% Italian28 0.3% European28 0.3% Scandinavian24 0.3% Turkish15 0.2% Swedish15 0.2% Welsh12 0.1% Guyanese11 0.1% Norwegian11 0.1% Scottish10 0.1% Russian9 0.10% Slovak7 0.07% French Canadian3 0.03% Czechoslovakian
Geographical mobility in Glenn Dale Same house 1 year ago 2,629 95.6% White (Caucasian)7,231 92.3% Black or African American1,197 98.4% Asian3 100.0% Native Hawaiian / Pacific Islander1,952 90.5% Other race572 77.2% Two or more races1,933 95.5% White alone, not Hispanic / Latino2,455 87.1% Hispanic or LatinoMoved within same county 288 3.7% Black or African American15 1.2% Asian62 2.9% Other race50 6.8% Two or more races75 2.7% Hispanic or LatinoMoved within same state 61 2.2% White / Caucasian329 4.2% Black or African American9 0.8% Asian42 2.0% Other race20 1.0% White alone, not Hispanic / Latino117 4.2% Hispanic or LatinoMoved from different state 60 2.2% White / Caucasian61 0.8% Black or African American11 70.3% American Indian / Alaska Native71 3.3% Other race84 11.3% Two or more races65 3.2% White alone, not Hispanic / Latino134 4.7% Hispanic or LatinoMoved from abroad 21 0.8% White21 1.0% White alone, not Hispanic / Latino
Children Nativity (place of birth) in Glenn Dale
Children under 6 years - Living with two parents Both parents native 386 100.0% NativeBoth parents foreign-born 344 100.0% NativeOne native, one foreign-born parent 156 100.0% NativeChildren under 6 years - Living with one parent Native parent 137 100.0% NativeChildren 6 to 17 years - Living with two parents Both parents native 168 100.0% Native0 0.0% Foreign-bornBoth parents foreign-born 1,142 98.2% Native20 1.8% Foreign-bornOne native, one foreign-born parent 431 100.0% NativeChildren 6 to 17 years - Living with one parent Native parent 42 100.0% NativeForeign-born parent 410 65.1% Native220 34.9% Foreign-born
Grandparents responsible for own grandchildren in Glenn Dale
Grandparents (30 to 59 years) White / Caucasian 13 100.0% Responsible for grandchildrenBlack or African American 33 65.9% Responsible for grandchildren17 34.1% Not responsible for grandchildrenOther race 72 100.0% Not responsible for grandchildrenWhite alone, not Hispanic / Latino 13 100.0% Responsible for grandchildrenHispanic or Latino 56 100.0% Not responsible for grandchildrenGrandparents (60 years and over) Black or African American 65 35.8% Responsible for grandchildren117 64.2% Not responsible for grandchildren