Races in Glassmanor, Maryland (MD) Detailed Stats
Data:
Races - White alone (%)
Races - White alone (% change since 2000)
Races - Black alone (%)
Races - Black alone (% change since 2000)
Races - American Indian alone (%)
Races - American Indian alone (% change since 2000)
Races - Asian alone (%)
Races - Asian alone (% change since 2000)
Races - Hispanic (%)
Races - Hispanic (% change since 2000)
Races - Native Hawaiian and Other Pacific Islander alone (%)
Races - Native Hawaiian and Other Pacific Islander alone (% change since 2000)
Races - Two or more races(%)
Races - Two or more races(% change since 2000)
Races - Other race alone (%)
Races - Other race alone (% change since 2000)
Racial diversity
Place of birth - Born in state of residence (%)
Place of birth - Born in state of residence (%) - White
Place of birth - Born in state of residence (%) - Black or African American
Place of birth - Born in state of residence (%) - Asian
Place of birth - Born in state of residence (%) - Hispanic or Latino
Place of birth - Born in state of residence (%) - American Indian and Alaska Native
Place of birth - Born in state of residence (%) - Multirace
Place of birth - Born in state of residence (%) - Other Race
Place of birth - Born in other state (%)
Place of birth - Born in other state (%) - White
Place of birth - Born in other state (%) - Black or African American
Place of birth - Born in other state (%) - Asian
Place of birth - Born in other state (%) - Hispanic or Latino
Place of birth - Born in other state (%) - American Indian and Alaska Native
Place of birth - Born in other state (%) - Multirace
Place of birth - Born in other state (%) - Other Race
Place of birth - Native, outside of US (%)
Place of birth - Native, outside of US (%) - White
Place of birth - Native, outside of US (%) - Black or African American
Place of birth - Native, outside of US (%) - Asian
Place of birth - Native, outside of US (%) - Hispanic or Latino
Place of birth - Native, outside of US (%) - American Indian and Alaska Native
Place of birth - Native, outside of US (%) - Multirace
Place of birth - Native, outside of US (%) - Other Race
Place of birth - Foreign born (%)
Place of birth - Foreign born (%) - White
Place of birth - Foreign born (%) - Black or African American
Place of birth - Foreign born (%) - Asian
Place of birth - Foreign born (%) - Hispanic or Latino
Place of birth - Foreign born (%) - American Indian and Alaska Native
Place of birth - Foreign born (%) - Multirace
Place of birth - Foreign born (%) - Other Race
Residents speaking English at home (%)
Residents speaking English at home - Born in the United States (%)
Residents speaking English at home - Native, born elsewhere (%)
Residents speaking English at home - Foreign born (%)
Residents speaking Spanish at home (%)
Residents speaking Spanish at home - Born in the United States (%)
Residents speaking Spanish at home - Native, born elsewhere (%)
Residents speaking Spanish at home - Foreign born (%)
Residents speaking other language at home (%)
Residents speaking other language at home - Born in the United States (%)
Residents speaking other language at home - Native, born elsewhere (%)
Residents speaking other language at home - Foreign born (%)
Marital status - Never married (%)
Marital status - Now married (%)
Marital status - Separated (%)
Marital status - Widowed (%)
Marital status - Divorced (%)
Ancestries Reported - Arab (%)
Ancestries Reported - Czech (%)
Ancestries Reported - Danish (%)
Ancestries Reported - Dutch (%)
Ancestries Reported - English (%)
Ancestries Reported - French (%)
Ancestries Reported - French Canadian (%)
Ancestries Reported - German (%)
Ancestries Reported - Greek (%)
Ancestries Reported - Hungarian (%)
Ancestries Reported - Irish (%)
Ancestries Reported - Italian (%)
Ancestries Reported - Lithuanian (%)
Ancestries Reported - Norwegian (%)
Ancestries Reported - Polish (%)
Ancestries Reported - Portuguese (%)
Ancestries Reported - Russian (%)
Ancestries Reported - Scotch-Irish (%)
Ancestries Reported - Scottish (%)
Ancestries Reported - Slovak (%)
Ancestries Reported - Subsaharan African (%)
Ancestries Reported - Swedish (%)
Ancestries Reported - Swiss (%)
Ancestries Reported - Ukrainian (%)
Ancestries Reported - United States (%)
Ancestries Reported - Welsh (%)
Ancestries Reported - West Indian (%)
Ancestries Reported - Other (%)
Geographical mobility - Same house 1 year ago (%)
Geographical mobility - Same house 1 year ago (%) - White
Geographical mobility - Same house 1 year ago (%) - Black or African American
Geographical mobility - Same house 1 year ago (%) - Asian
Geographical mobility - Same house 1 year ago (%) - Hispanic or Latino
Geographical mobility - Same house 1 year ago (%) - American Indian and Alaska Native
Geographical mobility - Same house 1 year ago (%) - Multirace
Geographical mobility - Same house 1 year ago (%) - Other Race
Geographical mobility - Moved within same county (%)
Geographical mobility - Moved within same county (%) - White
Geographical mobility - Moved within same county (%) - Black or African American
Geographical mobility - Moved within same county (%) - Asian
Geographical mobility - Moved within same county (%) - Hispanic or Latino
Geographical mobility - Moved within same county (%) - American Indian and Alaska Native
Geographical mobility - Moved within same county (%) - Multirace
Geographical mobility - Moved within same county (%) - Other Race
Geographical mobility - Moved from different county within same state (%)
Geographical mobility - Moved from different county within same state (%) - White
Geographical mobility - Moved from different county within same state (%) - Black or African American
Geographical mobility - Moved from different county within same state (%) - Asian
Geographical mobility - Moved from different county within same state (%) - Hispanic or Latino
Geographical mobility - Moved from different county within same state (%) - American Indian and Alaska Native
Geographical mobility - Moved from different county within same state (%) - Multirace
Geographical mobility - Moved from different county within same state (%) - Other Race
Geographical mobility - Moved from different state (%)
Geographical mobility - Moved from different state (%) - White
Geographical mobility - Moved from different state (%) - Black or African American
Geographical mobility - Moved from different state (%) - Asian
Geographical mobility - Moved from different state (%) - Hispanic or Latino
Geographical mobility - Moved from different state (%) - American Indian and Alaska Native
Geographical mobility - Moved from different state (%) - Multirace
Geographical mobility - Moved from different state (%) - Other Race
Geographical mobility - Moved from abroad (%)
Geographical mobility - Moved from abroad (%) - White
Geographical mobility - Moved from abroad (%) - Black or African American
Geographical mobility - Moved from abroad (%) - Asian
Geographical mobility - Moved from abroad (%) - Hispanic or Latino
Geographical mobility - Moved from abroad (%) - American Indian and Alaska Native
Geographical mobility - Moved from abroad (%) - Multirace
Geographical mobility - Moved from abroad (%) - Other Race
Place of birth for the foreign-born population - Ireland (%)
Place of birth for the foreign-born population - Denmark (%)
Place of birth for the foreign-born population - Norway (%)
Place of birth for the foreign-born population - Sweden (%)
Place of birth for the foreign-born population - United Kingdom (%)
Place of birth for the foreign-born population - England (%)
Place of birth for the foreign-born population - Scotland (%)
Place of birth for the foreign-born population - Other Northern Europe (%)
Place of birth for the foreign-born population - Austria (%)
Place of birth for the foreign-born population - Belgium (%)
Place of birth for the foreign-born population - France (%)
Place of birth for the foreign-born population - Germany (%)
Place of birth for the foreign-born population - Netherlands (%)
Place of birth for the foreign-born population - Switzerland (%)
Place of birth for the foreign-born population - Other Western Europe (%)
Place of birth for the foreign-born population - Greece (%)
Place of birth for the foreign-born population - Italy (%)
Place of birth for the foreign-born population - Portugal (%)
Place of birth for the foreign-born population - Spain (%)
Place of birth for the foreign-born population - Other Southern Europe (%)
Place of birth for the foreign-born population - Albania (%)
Place of birth for the foreign-born population - Belarus (%)
Place of birth for the foreign-born population - Bosnia and Herzegovina (%)
Place of birth for the foreign-born population - Bulgaria (%)
Place of birth for the foreign-born population - Croatia (%)
Place of birth for the foreign-born population - Czechoslovakia (%)
Place of birth for the foreign-born population - Hungary (%)
Place of birth for the foreign-born population - Latvia (%)
Place of birth for the foreign-born population - Lithuania (%)
Place of birth for the foreign-born population - North Macedonia (Macedonia) (%)
Place of birth for the foreign-born population - Moldova (%)
Place of birth for the foreign-born population - Poland (%)
Place of birth for the foreign-born population - Romania (%)
Place of birth for the foreign-born population - Russia (%)
Place of birth for the foreign-born population - Serbia (%)
Place of birth for the foreign-born population - Ukraine (%)
Place of birth for the foreign-born population - Other Eastern Europe (%)
Place of birth for the foreign-born population - China (%)
Place of birth for the foreign-born population - Hong Kong (%)
Place of birth for the foreign-born population - Taiwan (%)
Place of birth for the foreign-born population - Japan (%)
Place of birth for the foreign-born population - Korea (%)
Place of birth for the foreign-born population - Other Eastern Asia (%)
Place of birth for the foreign-born population - Afghanistan (%)
Place of birth for the foreign-born population - Bangladesh (%)
Place of birth for the foreign-born population - India (%)
Place of birth for the foreign-born population - Iran (%)
Place of birth for the foreign-born population - Kazakhstan (%)
Place of birth for the foreign-born population - Nepal (%)
Place of birth for the foreign-born population - Pakistan (%)
Place of birth for the foreign-born population - Sri Lanka (%)
Place of birth for the foreign-born population - Uzbekistan (%)
Place of birth for the foreign-born population - Other South Central Asia (%)
Place of birth for the foreign-born population - Burma (%)
Place of birth for the foreign-born population - Cambodia (%)
Place of birth for the foreign-born population - Indonesia (%)
Place of birth for the foreign-born population - Laos (%)
Place of birth for the foreign-born population - Malaysia (%)
Place of birth for the foreign-born population - Philippines (%)
Place of birth for the foreign-born population - Singapore (%)
Place of birth for the foreign-born population - Thailand (%)
Place of birth for the foreign-born population - Vietnam (%)
Place of birth for the foreign-born population - Other South Eastern Asia (%)
Place of birth for the foreign-born population - Armenia (%)
Place of birth for the foreign-born population - Iraq (%)
Place of birth for the foreign-born population - Israel (%)
Place of birth for the foreign-born population - Jordan (%)
Place of birth for the foreign-born population - Kuwait (%)
Place of birth for the foreign-born population - Lebanon (%)
Place of birth for the foreign-born population - Saudi Arabia (%)
Place of birth for the foreign-born population - Syria (%)
Place of birth for the foreign-born population - Turkey (%)
Place of birth for the foreign-born population - Yemen (%)
Place of birth for the foreign-born population - Other Western Asia (%)
Place of birth for the foreign-born population - Eritrea (%)
Place of birth for the foreign-born population - Ethiopia (%)
Place of birth for the foreign-born population - Kenya (%)
Place of birth for the foreign-born population - Somalia (%)
Place of birth for the foreign-born population - Uganda (%)
Place of birth for the foreign-born population - Zimbabwe (%)
Place of birth for the foreign-born population - Other Eastern Africa (%)
Place of birth for the foreign-born population - Cameroon (%)
Place of birth for the foreign-born population - Congo (%)
Place of birth for the foreign-born population - Democratic Republic of Congo (Zaire) (%)
Place of birth for the foreign-born population - Other Middle Africa (%)
Place of birth for the foreign-born population - Egypt (%)
Place of birth for the foreign-born population - Morocco (%)
Place of birth for the foreign-born population - Sudan (%)
Place of birth for the foreign-born population - Other Northern Africa (%)
Place of birth for the foreign-born population - South Africa (%)
Place of birth for the foreign-born population - Other Southern Africa (%)
Place of birth for the foreign-born population - Cabo Verde (%)
Place of birth for the foreign-born population - Ghana (%)
Place of birth for the foreign-born population - Liberia (%)
Place of birth for the foreign-born population - Nigeria (%)
Place of birth for the foreign-born population - Senegal (%)
Place of birth for the foreign-born population - Sierra Leone (%)
Place of birth for the foreign-born population - Other Western Africa (%)
Place of birth for the foreign-born population - Australia (%)
Place of birth for the foreign-born population - New Zealand (%)
Place of birth for the foreign-born population - Fiji (%)
Place of birth for the foreign-born population - Micronesia (%)
Place of birth for the foreign-born population - Bahamas (%)
Place of birth for the foreign-born population - Barbados (%)
Place of birth for the foreign-born population - Cuba (%)
Place of birth for the foreign-born population - Dominica (%)
Place of birth for the foreign-born population - Dominican Republic (%)
Place of birth for the foreign-born population - Grenada (%)
Place of birth for the foreign-born population - Haiti (%)
Place of birth for the foreign-born population - Jamaica (%)
Place of birth for the foreign-born population - St. Vincent and the Grenadines (%)
Place of birth for the foreign-born population - Trinidad and Tobago (%)
Place of birth for the foreign-born population - West Indies (%)
Place of birth for the foreign-born population - Other Caribbean (%)
Place of birth for the foreign-born population - Belize (%)
Place of birth for the foreign-born population - Costa Rica (%)
Place of birth for the foreign-born population - El Salvador (%)
Place of birth for the foreign-born population - Guatemala (%)
Place of birth for the foreign-born population - Honduras (%)
Place of birth for the foreign-born population - Mexico (%)
Place of birth for the foreign-born population - Nicaragua (%)
Place of birth for the foreign-born population - Panama (%)
Place of birth for the foreign-born population - Other Central America (%)
Place of birth for the foreign-born population - Argentina (%)
Place of birth for the foreign-born population - Bolivia (%)
Place of birth for the foreign-born population - Brazil (%)
Place of birth for the foreign-born population - Chile (%)
Place of birth for the foreign-born population - Colombia (%)
Place of birth for the foreign-born population - Ecuador (%)
Place of birth for the foreign-born population - Guyana (%)
Place of birth for the foreign-born population - Peru (%)
Place of birth for the foreign-born population - Uruguay (%)
Place of birth for the foreign-born population - Venezuela (%)
Place of birth for the foreign-born population - Other South America (%)
Place of birth for the foreign-born population - Canada (%)
Place of birth for the foreign-born population - Other Northern America (%)
Place of birth for the foreign-born population - Other (%)
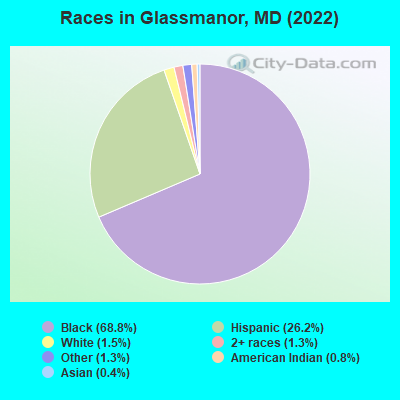
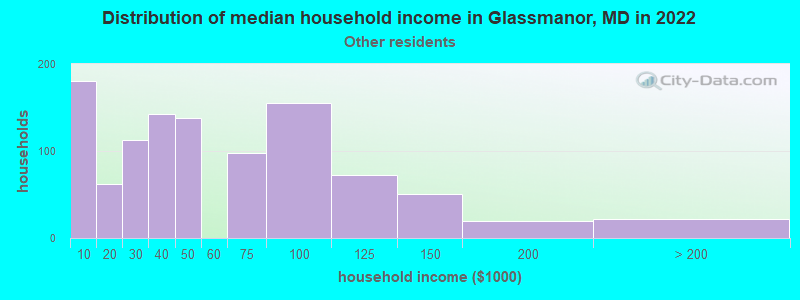
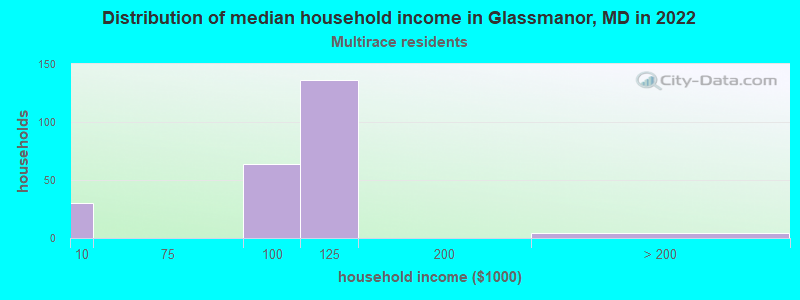
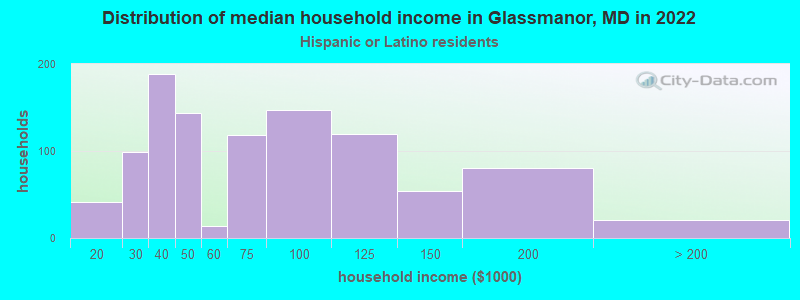
According to 2022 data, the most numerous races in Glassmanor, MD are White alone (249 residents), Black alone (11,807 residents), and Hispanic (4,500 residents). 73.3% of Glassmanor residents speak English at home.
Race distribution in Glassmanor 11,807 68.8% Black alone 4,500 26.2% Hispanic 249 1.5% White alone 226 1.3% Two or more races 220 1.3% Other race alone 131 0.8% American Indian alone 73 0.4% Asian alone 17 0.10% Native Hawaiian and Other
2000 2022
3,286,547 62.1% White alone 1,464,735 27.7% Black alone 227,916 4.3% Hispanic 209,738 4.0% Asian alone 82,946 1.6% Two or more races 13,312 0.3% American Indian alone 9,379 0.2% Other race alone 1,913 0.04% Native Hawaiian and Other
2,906,492 47.1% White alone 1,800,914 29.2% Black alone 705,842 11.4% Hispanic 401,818 6.5% Asian alone 291,317 4.7% Two or more races 46,930 0.8% Other race alone 8,930 0.1% American Indian alone 2,417 0.04% Native Hawaiian and Other
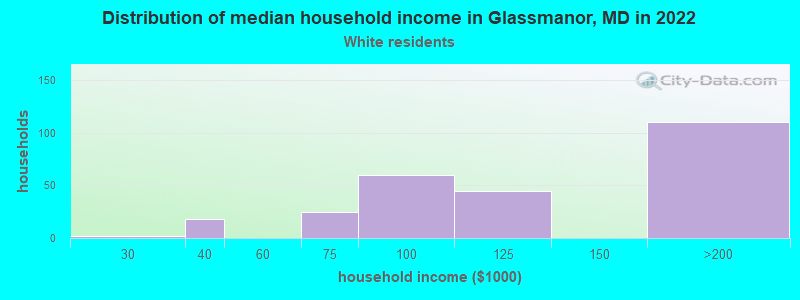
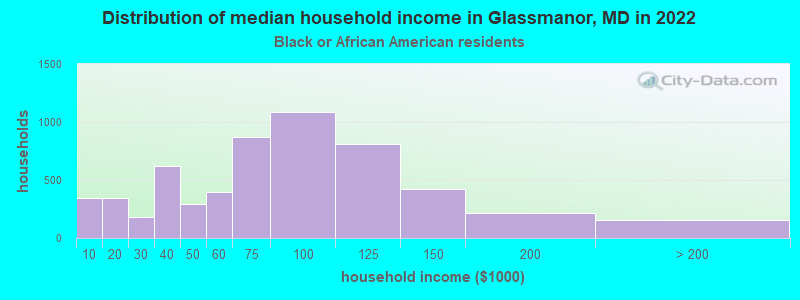
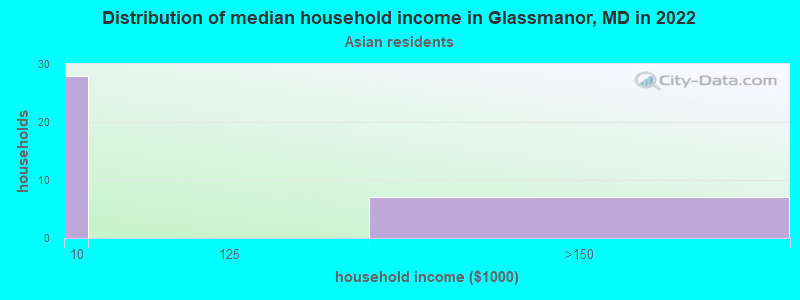
Income and house value in Glassmanor Median household income in 2022 $113,155 White non-Hispanic householders$69,786 Black householders$106,025 Two or more races householders$68,526 Hispanic or Latino race householders
Median age by race in Glassmanor
42.3 Median age for White residents45.2 30.0 38.6 Median age for Black or African American residents35.0 44.6 4.4 Median age for American Indian / Alaska Native residents-888,297,871.5 -689,905,591.2 35.3 Median age for Asian residents19.6 -716,586,150.7 -571,600,480.8 Median age for Native Hawaiian / Pacific Islander residents-720,061,021.4 -760,942,760.2 22.9 Median age for Other race residents20.8 23.8 29.7 Median age for Two or more races residents58.4 30.0 47.5 Median age for White alone residents57.1 46.6 22.1 Median age for Hispanic or Latino residents22.8 21.7
Owner/renter occupied households by race in Glassmanor
House owners and renters - White residents 115 43.5% Owner occupied150 56.5% Renter occupiedHouse owners and renters - Black or African American residents 1,843 32.1% Owner occupied3,894 67.9% Renter occupiedHouse owners and renters - American Indian / Alaska Native residents 55 100.0% Renter occupiedHouse owners and renters - Asian residents 8 33.7% Owner occupied16 66.3% Renter occupiedHouse owners and renters - Native Hawaiian / Pacific Islander residents 18 100.0% Renter occupiedHouse owners and renters - Other race residents 241 24.5% Owner occupied744 75.5% Renter occupiedHouse owners and renters - Two or more races residents 118 70.5% Owner occupied49 29.5% Renter occupiedHouse owners and renters - White alone residents 120 63.9% Owner occupied68 36.1% Renter occupiedHouse owners and renters - Hispanic or Latino residents 304 31.9% Owner occupied650 68.1% Renter occupied
Language usage in Glassmanor
English speakers - Total 73.3% of residents of Glassmanor speak English at home.
23.2% of residents speak Spanish at home 1,785 48.9% Speak English very well1,862 51.1% Speak English less than very well1.7% of residents speak other language at home 137 51.7% Speak English very well128 48.3% Speak English less than very well
English speakers - Born in the United States 88.0% of residents of Glassmanor speak English at home.
11.1% of residents speak Spanish at home 947 88.8% Speak English very well120 11.2% Speak English less than very well0.6% of residents speak other language at home 27 50.9% Speak English very well26 49.1% Speak English less than very well
English speakers - Native, born elsewhere 91.2% of residents of Glassmanor speak English at home.
20.8% of residents speak Spanish at home 50 100.0% Speak English less than very well
English speakers - Foreign-born 8.2% of residents of Glassmanor speak English at home.
80.7% of residents speak Spanish at home 576 25.3% Speak English very well1,705 74.7% Speak English less than very well7.5% of residents speak other language at home 111 52.6% Speak English very well100 47.4% Speak English less than very well
White (Caucasian) - Speak another language Native:
15.0% (44)Foreign-born:
90.7% (164)
Black or African American - Speak only English Native:
98.7% (10,386)Foreign-born:
38.5% (99)
Black or African American - Speak another language Native:
0.9% (100)Foreign-born:
61.3% (157)
Other race - Speak another language Native:
85.5% (1,218)Foreign-born:
100.0% (1,974)
Two or more races - Speak only English Native:
68.3% (196)Foreign-born:
60.7% (157)
Two or more races - Speak another language Native:
32.6% (94)Foreign-born:
29.6% (76)
Hispanic or Latino - Speak only English Native:
1.6% (22)Foreign-born:
5.5% (135)
Hispanic or Latino - Speak another language Native:
96.7% (1,359)Foreign-born:
94.1% (2,316)
Foreign-born residents in Glassmanor
Marital status for residents in Glassmanor Marital status - White (Caucasian) population 15 years and over
Males 48.7% Never married29.0% Now married0.0% Separated17.9% Widowed4.5% DivorcedFemales 37.9% Never married57.5% Now married0.0% Separated3.7% Widowed0.9% DivorcedWomen who gave birth in the past 12 months Now married:
0.0% (0)Unmarried:
100.0% (2)
Women who did not give birth in the past 12 months Now married:
59.5% (102)Unmarried:
40.5% (70)
Marital status - Black or African American population 15 years and over
Males 55.4% Never married25.4% Now married6.9% Separated2.7% Widowed9.5% DivorcedFemales 57.2% Never married15.9% Now married4.1% Separated6.8% Widowed16.0% DivorcedWomen who gave birth in the past 12 months Now married:
16.3% (13)Unmarried:
83.7% (68)
Women who did not give birth in the past 12 months Now married:
13.5% (417)Unmarried:
86.5% (2,669)
Marital status - Asian population 15 years and over
Males 12.5% Never married87.5% Now married0.0% Separated0.0% Widowed0.0% DivorcedFemales 0.0% Never married75.0% Now married0.0% Separated0.0% Widowed25.0% DivorcedWomen who gave birth in the past 12 months Now married:
100.0% (20)Unmarried:
0.0% (0)
Marital status - Other race population 15 years and over
Males 51.0% Never married40.1% Now married8.9% Separated0.0% Widowed0.0% DivorcedFemales 37.1% Never married34.7% Now married19.2% Separated5.4% Widowed3.5% DivorcedWomen who gave birth in the past 12 months Now married:
0.0% (0)Unmarried:
100.0% (128)
Women who did not give birth in the past 12 months Now married:
55.9% (460)Unmarried:
44.1% (362)
Marital status - Two or more races population 15 years and over
Males 11.5% Never married81.2% Now married0.0% Separated0.0% Widowed7.3% DivorcedFemales 30.8% Never married46.9% Now married0.0% Separated4.2% Widowed18.1% DivorcedWomen who did not give birth in the past 12 months Now married:
41.7% (90)Unmarried:
58.3% (126)
Marital status - White alone, not Hispanic / Latino population 15 years and over
Males 47.5% Never married11.5% Now married0.0% Separated32.8% Widowed8.2% DivorcedFemales 24.4% Never married73.2% Now married0.0% Separated0.0% Widowed2.4% DivorcedWomen who gave birth in the past 12 months Now married:
0.0% (0)Unmarried:
100.0% (2)
Women who did not give birth in the past 12 months Now married:
74.6% (50)Unmarried:
25.4% (17)
Marital status - Hispanic or Latino population 15 years and over
Males 50.9% Never married41.2% Now married7.9% Separated0.0% Widowed0.0% DivorcedFemales 42.8% Never married40.6% Now married3.7% Separated6.7% Widowed6.1% DivorcedWomen who gave birth in the past 12 months Now married:
0.0% (0)Unmarried:
100.0% (118)
Women who did not give birth in the past 12 months Now married:
51.9% (580)Unmarried:
48.1% (536)
Ancestries in Glassmanor
281 2.3% American190 1.5% Nigerian71 0.6% Irish44 0.4% German34 0.3% African29 0.2% Guyanese29 0.2% Senegalese19 0.2% Norwegian3 0.02% Albanian
Children Nativity (place of birth) in Glassmanor
Children under 6 years - Living with two parents Both parents native 187 100.0% NativeBoth parents foreign-born 207 64.3% Native115 35.7% Foreign-bornChildren under 6 years - Living with one parent Native parent 641 99.8% Native1 0.2% Foreign-bornForeign-born parent 343 48.7% Native361 51.3% Foreign-bornChildren 6 to 17 years - Living with two parents Both parents native 63 99.3% Native0 0.7% Foreign-bornBoth parents foreign-born 683 84.9% Native121 15.1% Foreign-bornChildren 6 to 17 years - Living with one parent Native parent 870 100.0% NativeForeign-born parent 473 51.9% Native439 48.1% Foreign-born
Grandparents responsible for own grandchildren in Glassmanor
Grandparents (30 to 59 years) Black or African American 152 66.7% Responsible for grandchildren76 33.3% Not responsible for grandchildrenOther race 76 100.0% Responsible for grandchildrenTwo or more races 74 100.0% Not responsible for grandchildrenHispanic or Latino 72 71.5% Responsible for grandchildren28 28.5% Not responsible for grandchildrenGrandparents (60 years and over) Black or African American 89 42.3% Responsible for grandchildren121 57.7% Not responsible for grandchildrenTwo or more races 6 100.0% Not responsible for grandchildren