Races in Geneva, Illinois (IL) Detailed Stats
Data:
Races - White alone (%)
Races - White alone (% change since 2000)
Races - Black alone (%)
Races - Black alone (% change since 2000)
Races - American Indian alone (%)
Races - American Indian alone (% change since 2000)
Races - Asian alone (%)
Races - Asian alone (% change since 2000)
Races - Hispanic (%)
Races - Hispanic (% change since 2000)
Races - Native Hawaiian and Other Pacific Islander alone (%)
Races - Native Hawaiian and Other Pacific Islander alone (% change since 2000)
Races - Two or more races(%)
Races - Two or more races(% change since 2000)
Races - Other race alone (%)
Races - Other race alone (% change since 2000)
Racial diversity
Place of birth - Born in state of residence (%)
Place of birth - Born in state of residence (%) - White
Place of birth - Born in state of residence (%) - Black or African American
Place of birth - Born in state of residence (%) - Asian
Place of birth - Born in state of residence (%) - Hispanic or Latino
Place of birth - Born in state of residence (%) - American Indian and Alaska Native
Place of birth - Born in state of residence (%) - Multirace
Place of birth - Born in state of residence (%) - Other Race
Place of birth - Born in other state (%)
Place of birth - Born in other state (%) - White
Place of birth - Born in other state (%) - Black or African American
Place of birth - Born in other state (%) - Asian
Place of birth - Born in other state (%) - Hispanic or Latino
Place of birth - Born in other state (%) - American Indian and Alaska Native
Place of birth - Born in other state (%) - Multirace
Place of birth - Born in other state (%) - Other Race
Place of birth - Native, outside of US (%)
Place of birth - Native, outside of US (%) - White
Place of birth - Native, outside of US (%) - Black or African American
Place of birth - Native, outside of US (%) - Asian
Place of birth - Native, outside of US (%) - Hispanic or Latino
Place of birth - Native, outside of US (%) - American Indian and Alaska Native
Place of birth - Native, outside of US (%) - Multirace
Place of birth - Native, outside of US (%) - Other Race
Place of birth - Foreign born (%)
Place of birth - Foreign born (%) - White
Place of birth - Foreign born (%) - Black or African American
Place of birth - Foreign born (%) - Asian
Place of birth - Foreign born (%) - Hispanic or Latino
Place of birth - Foreign born (%) - American Indian and Alaska Native
Place of birth - Foreign born (%) - Multirace
Place of birth - Foreign born (%) - Other Race
Residents speaking English at home (%)
Residents speaking English at home - Born in the United States (%)
Residents speaking English at home - Native, born elsewhere (%)
Residents speaking English at home - Foreign born (%)
Residents speaking Spanish at home (%)
Residents speaking Spanish at home - Born in the United States (%)
Residents speaking Spanish at home - Native, born elsewhere (%)
Residents speaking Spanish at home - Foreign born (%)
Residents speaking other language at home (%)
Residents speaking other language at home - Born in the United States (%)
Residents speaking other language at home - Native, born elsewhere (%)
Residents speaking other language at home - Foreign born (%)
Marital status - Never married (%)
Marital status - Now married (%)
Marital status - Separated (%)
Marital status - Widowed (%)
Marital status - Divorced (%)
Ancestries Reported - Arab (%)
Ancestries Reported - Czech (%)
Ancestries Reported - Danish (%)
Ancestries Reported - Dutch (%)
Ancestries Reported - English (%)
Ancestries Reported - French (%)
Ancestries Reported - French Canadian (%)
Ancestries Reported - German (%)
Ancestries Reported - Greek (%)
Ancestries Reported - Hungarian (%)
Ancestries Reported - Irish (%)
Ancestries Reported - Italian (%)
Ancestries Reported - Lithuanian (%)
Ancestries Reported - Norwegian (%)
Ancestries Reported - Polish (%)
Ancestries Reported - Portuguese (%)
Ancestries Reported - Russian (%)
Ancestries Reported - Scotch-Irish (%)
Ancestries Reported - Scottish (%)
Ancestries Reported - Slovak (%)
Ancestries Reported - Subsaharan African (%)
Ancestries Reported - Swedish (%)
Ancestries Reported - Swiss (%)
Ancestries Reported - Ukrainian (%)
Ancestries Reported - United States (%)
Ancestries Reported - Welsh (%)
Ancestries Reported - West Indian (%)
Ancestries Reported - Other (%)
Geographical mobility - Same house 1 year ago (%)
Geographical mobility - Same house 1 year ago (%) - White
Geographical mobility - Same house 1 year ago (%) - Black or African American
Geographical mobility - Same house 1 year ago (%) - Asian
Geographical mobility - Same house 1 year ago (%) - Hispanic or Latino
Geographical mobility - Same house 1 year ago (%) - American Indian and Alaska Native
Geographical mobility - Same house 1 year ago (%) - Multirace
Geographical mobility - Same house 1 year ago (%) - Other Race
Geographical mobility - Moved within same county (%)
Geographical mobility - Moved within same county (%) - White
Geographical mobility - Moved within same county (%) - Black or African American
Geographical mobility - Moved within same county (%) - Asian
Geographical mobility - Moved within same county (%) - Hispanic or Latino
Geographical mobility - Moved within same county (%) - American Indian and Alaska Native
Geographical mobility - Moved within same county (%) - Multirace
Geographical mobility - Moved within same county (%) - Other Race
Geographical mobility - Moved from different county within same state (%)
Geographical mobility - Moved from different county within same state (%) - White
Geographical mobility - Moved from different county within same state (%) - Black or African American
Geographical mobility - Moved from different county within same state (%) - Asian
Geographical mobility - Moved from different county within same state (%) - Hispanic or Latino
Geographical mobility - Moved from different county within same state (%) - American Indian and Alaska Native
Geographical mobility - Moved from different county within same state (%) - Multirace
Geographical mobility - Moved from different county within same state (%) - Other Race
Geographical mobility - Moved from different state (%)
Geographical mobility - Moved from different state (%) - White
Geographical mobility - Moved from different state (%) - Black or African American
Geographical mobility - Moved from different state (%) - Asian
Geographical mobility - Moved from different state (%) - Hispanic or Latino
Geographical mobility - Moved from different state (%) - American Indian and Alaska Native
Geographical mobility - Moved from different state (%) - Multirace
Geographical mobility - Moved from different state (%) - Other Race
Geographical mobility - Moved from abroad (%)
Geographical mobility - Moved from abroad (%) - White
Geographical mobility - Moved from abroad (%) - Black or African American
Geographical mobility - Moved from abroad (%) - Asian
Geographical mobility - Moved from abroad (%) - Hispanic or Latino
Geographical mobility - Moved from abroad (%) - American Indian and Alaska Native
Geographical mobility - Moved from abroad (%) - Multirace
Geographical mobility - Moved from abroad (%) - Other Race
Place of birth for the foreign-born population - Ireland (%)
Place of birth for the foreign-born population - Denmark (%)
Place of birth for the foreign-born population - Norway (%)
Place of birth for the foreign-born population - Sweden (%)
Place of birth for the foreign-born population - United Kingdom (%)
Place of birth for the foreign-born population - England (%)
Place of birth for the foreign-born population - Scotland (%)
Place of birth for the foreign-born population - Other Northern Europe (%)
Place of birth for the foreign-born population - Austria (%)
Place of birth for the foreign-born population - Belgium (%)
Place of birth for the foreign-born population - France (%)
Place of birth for the foreign-born population - Germany (%)
Place of birth for the foreign-born population - Netherlands (%)
Place of birth for the foreign-born population - Switzerland (%)
Place of birth for the foreign-born population - Other Western Europe (%)
Place of birth for the foreign-born population - Greece (%)
Place of birth for the foreign-born population - Italy (%)
Place of birth for the foreign-born population - Portugal (%)
Place of birth for the foreign-born population - Spain (%)
Place of birth for the foreign-born population - Other Southern Europe (%)
Place of birth for the foreign-born population - Albania (%)
Place of birth for the foreign-born population - Belarus (%)
Place of birth for the foreign-born population - Bosnia and Herzegovina (%)
Place of birth for the foreign-born population - Bulgaria (%)
Place of birth for the foreign-born population - Croatia (%)
Place of birth for the foreign-born population - Czechoslovakia (%)
Place of birth for the foreign-born population - Hungary (%)
Place of birth for the foreign-born population - Latvia (%)
Place of birth for the foreign-born population - Lithuania (%)
Place of birth for the foreign-born population - North Macedonia (Macedonia) (%)
Place of birth for the foreign-born population - Moldova (%)
Place of birth for the foreign-born population - Poland (%)
Place of birth for the foreign-born population - Romania (%)
Place of birth for the foreign-born population - Russia (%)
Place of birth for the foreign-born population - Serbia (%)
Place of birth for the foreign-born population - Ukraine (%)
Place of birth for the foreign-born population - Other Eastern Europe (%)
Place of birth for the foreign-born population - China (%)
Place of birth for the foreign-born population - Hong Kong (%)
Place of birth for the foreign-born population - Taiwan (%)
Place of birth for the foreign-born population - Japan (%)
Place of birth for the foreign-born population - Korea (%)
Place of birth for the foreign-born population - Other Eastern Asia (%)
Place of birth for the foreign-born population - Afghanistan (%)
Place of birth for the foreign-born population - Bangladesh (%)
Place of birth for the foreign-born population - India (%)
Place of birth for the foreign-born population - Iran (%)
Place of birth for the foreign-born population - Kazakhstan (%)
Place of birth for the foreign-born population - Nepal (%)
Place of birth for the foreign-born population - Pakistan (%)
Place of birth for the foreign-born population - Sri Lanka (%)
Place of birth for the foreign-born population - Uzbekistan (%)
Place of birth for the foreign-born population - Other South Central Asia (%)
Place of birth for the foreign-born population - Burma (%)
Place of birth for the foreign-born population - Cambodia (%)
Place of birth for the foreign-born population - Indonesia (%)
Place of birth for the foreign-born population - Laos (%)
Place of birth for the foreign-born population - Malaysia (%)
Place of birth for the foreign-born population - Philippines (%)
Place of birth for the foreign-born population - Singapore (%)
Place of birth for the foreign-born population - Thailand (%)
Place of birth for the foreign-born population - Vietnam (%)
Place of birth for the foreign-born population - Other South Eastern Asia (%)
Place of birth for the foreign-born population - Armenia (%)
Place of birth for the foreign-born population - Iraq (%)
Place of birth for the foreign-born population - Israel (%)
Place of birth for the foreign-born population - Jordan (%)
Place of birth for the foreign-born population - Kuwait (%)
Place of birth for the foreign-born population - Lebanon (%)
Place of birth for the foreign-born population - Saudi Arabia (%)
Place of birth for the foreign-born population - Syria (%)
Place of birth for the foreign-born population - Turkey (%)
Place of birth for the foreign-born population - Yemen (%)
Place of birth for the foreign-born population - Other Western Asia (%)
Place of birth for the foreign-born population - Eritrea (%)
Place of birth for the foreign-born population - Ethiopia (%)
Place of birth for the foreign-born population - Kenya (%)
Place of birth for the foreign-born population - Somalia (%)
Place of birth for the foreign-born population - Uganda (%)
Place of birth for the foreign-born population - Zimbabwe (%)
Place of birth for the foreign-born population - Other Eastern Africa (%)
Place of birth for the foreign-born population - Cameroon (%)
Place of birth for the foreign-born population - Congo (%)
Place of birth for the foreign-born population - Democratic Republic of Congo (Zaire) (%)
Place of birth for the foreign-born population - Other Middle Africa (%)
Place of birth for the foreign-born population - Egypt (%)
Place of birth for the foreign-born population - Morocco (%)
Place of birth for the foreign-born population - Sudan (%)
Place of birth for the foreign-born population - Other Northern Africa (%)
Place of birth for the foreign-born population - South Africa (%)
Place of birth for the foreign-born population - Other Southern Africa (%)
Place of birth for the foreign-born population - Cabo Verde (%)
Place of birth for the foreign-born population - Ghana (%)
Place of birth for the foreign-born population - Liberia (%)
Place of birth for the foreign-born population - Nigeria (%)
Place of birth for the foreign-born population - Senegal (%)
Place of birth for the foreign-born population - Sierra Leone (%)
Place of birth for the foreign-born population - Other Western Africa (%)
Place of birth for the foreign-born population - Australia (%)
Place of birth for the foreign-born population - New Zealand (%)
Place of birth for the foreign-born population - Fiji (%)
Place of birth for the foreign-born population - Micronesia (%)
Place of birth for the foreign-born population - Bahamas (%)
Place of birth for the foreign-born population - Barbados (%)
Place of birth for the foreign-born population - Cuba (%)
Place of birth for the foreign-born population - Dominica (%)
Place of birth for the foreign-born population - Dominican Republic (%)
Place of birth for the foreign-born population - Grenada (%)
Place of birth for the foreign-born population - Haiti (%)
Place of birth for the foreign-born population - Jamaica (%)
Place of birth for the foreign-born population - St. Vincent and the Grenadines (%)
Place of birth for the foreign-born population - Trinidad and Tobago (%)
Place of birth for the foreign-born population - West Indies (%)
Place of birth for the foreign-born population - Other Caribbean (%)
Place of birth for the foreign-born population - Belize (%)
Place of birth for the foreign-born population - Costa Rica (%)
Place of birth for the foreign-born population - El Salvador (%)
Place of birth for the foreign-born population - Guatemala (%)
Place of birth for the foreign-born population - Honduras (%)
Place of birth for the foreign-born population - Mexico (%)
Place of birth for the foreign-born population - Nicaragua (%)
Place of birth for the foreign-born population - Panama (%)
Place of birth for the foreign-born population - Other Central America (%)
Place of birth for the foreign-born population - Argentina (%)
Place of birth for the foreign-born population - Bolivia (%)
Place of birth for the foreign-born population - Brazil (%)
Place of birth for the foreign-born population - Chile (%)
Place of birth for the foreign-born population - Colombia (%)
Place of birth for the foreign-born population - Ecuador (%)
Place of birth for the foreign-born population - Guyana (%)
Place of birth for the foreign-born population - Peru (%)
Place of birth for the foreign-born population - Uruguay (%)
Place of birth for the foreign-born population - Venezuela (%)
Place of birth for the foreign-born population - Other South America (%)
Place of birth for the foreign-born population - Canada (%)
Place of birth for the foreign-born population - Other Northern America (%)
Place of birth for the foreign-born population - Other (%)
Latest news about races in Geneva, IL collected exclusively by city-data.com from local newspapers, TV, and radio stations
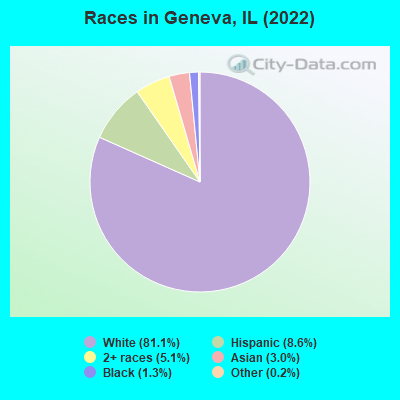
According to 2022 data, the most numerous races in Geneva, IL are White alone (17,244 residents), Hispanic (1,836 residents), and Black alone (278 residents). 91.6% of Geneva residents speak English at home. 5.3% of Geneva, IL residents are foreign-born (2.2% born in Latin America, 1.6% born in Asia, 1.0% born in Europe), which is 166.3% less than the foreign-born rate of 14.0% across the entire state of Illinois.
Race distribution in Geneva
2000 2022
8,424,140 67.8% White alone 1,856,152 14.9% Black alone 1,530,262 12.3% Hispanic 419,916 3.4% Asian alone 153,996 1.2% Two or more races 13,479 0.1% Other race alone 18,232 0.1% American Indian alone 3,116 0.03% Native Hawaiian and Other
7,356,301 58.5% White alone 2,299,726 18.3% Hispanic 1,660,423 13.2% Black alone 747,296 5.9% Asian alone 458,599 3.6% Two or more races 45,386 0.4% Other race alone 10,405 0.08% American Indian alone 3,896 0.03% Native Hawaiian and Other
Income and house value in Geneva Median household income in 2022 $133,050 White non-Hispanic householders$114,582 Black householders$109,836 Asian householders$86,133 Some other race householdersover $200,000 Two or more races householders$110,741 Hispanic or Latino race householdersMedian 2022 house value $418,024 White Non-Hispanic householders$668,991 Black or African American householders $330,482 Asian householders$281,932 Some other race householders$430,066 Two or more races householders$292,636 Hispanic or Latino householders
Median age by race in Geneva
47.2 Median age for White residents45.9 47.9 41.8 Median age for Black or African American residents49.7 39.2 70.6 Median age for American Indian / Alaska Native residents-505,112,473.9 -949,999,999.1 33.0 Median age for Asian residents41.5 32.1 -593,236,714.4 Median age for Native Hawaiian / Pacific Islander residents-658,536,584.7 -576,015,108.0 36.0 Median age for Other race residents13.7 40.3 17.8 Median age for Two or more races residents22.4 15.5 45.3 Median age for White alone residents44.2 46.4 35.8 Median age for Hispanic or Latino residents41.7 31.7
Owner/renter occupied households by race in Geneva
House owners and renters - White residents 5,851 86.5% Owner occupied914 13.5% Renter occupiedHouse owners and renters - Black or African American residents 38 71.5% Owner occupied15 28.5% Renter occupiedHouse owners and renters - Asian residents 164 92.7% Owner occupied13 7.3% Renter occupiedHouse owners and renters - Other race residents 129 52.5% Owner occupied117 47.5% Renter occupiedHouse owners and renters - Two or more races residents 377 89.6% Owner occupied44 10.4% Renter occupiedHouse owners and renters - White alone residents 5,997 85.2% Owner occupied1,042 14.8% Renter occupiedHouse owners and renters - Hispanic or Latino residents 462 79.9% Owner occupied116 20.1% Renter occupied
Language usage in Geneva
English speakers - Total 91.6% of residents of Geneva speak English at home.
4.5% of residents speak Spanish at home 668 73.0% Speak English very well247 27.0% Speak English less than very well3.6% of residents speak other language at home 590 79.3% Speak English very well154 20.7% Speak English less than very well
English speakers - Born in the United States 96.1% of residents of Geneva speak English at home.
1.7% of residents speak Spanish at home 81 100.0% Speak English very well2.8% of residents speak other language at home 130 100.0% Speak English very well
English speakers - Native, born elsewhere 51.1% of residents of Geneva speak English at home.
23.4% of residents speak Spanish at home 76 100.0% Speak English very well26.5% of residents speak other language at home 86 100.0% Speak English very well
English speakers - Foreign-born 29.7% of residents of Geneva speak English at home.
33.4% of residents speak Spanish at home 163 42.2% Speak English very well223 57.8% Speak English less than very well39.9% of residents speak other language at home 326 70.7% Speak English very well135 29.3% Speak English less than very well
White (Caucasian) - Speak only English Native:
100.0% (16,023)Foreign-born:
73.8% (121)
White (Caucasian) - Speak another language Native:
0.8% (134)Foreign-born:
47.4% (78)
Black or African American - Speak only English Native:
100.0% (195)Foreign-born:
100.0% (49)
American Indian / Alaska Native - Speak another language Native:
100.0% (15)Foreign-born:
100.0% (125)
Asian - Speak only English Native:
39.9% (125)Foreign-born:
16.7% (56)
Asian - Speak another language Native:
63.6% (199)Foreign-born:
83.3% (280)
Other race - Speak another language Native:
71.0% (272)Foreign-born:
97.5% (246)
Two or more races - Speak only English Native:
88.0% (1,048)Foreign-born:
17.6% (31)
Two or more races - Speak another language Native:
14.1% (168)Foreign-born:
83.9% (148)
White alone - Speak only English Native:
99.2% (16,303)Foreign-born:
50.4% (136)
White alone - Speak another language Native:
0.9% (154)Foreign-born:
48.5% (131)
Hispanic or Latino - Speak only English Native:
67.5% (943)Foreign-born:
3.3% (13)
Hispanic or Latino - Speak another language Native:
33.1% (462)Foreign-born:
96.2% (392)
Foreign-born residents in Geneva 1,118 residents are foreign born (2.2% Latin America , 1.6% Asia , 1.0% Europe ).
This city:
5.3%Illinois:
14.1%
Marital status for residents in Geneva Marital status - White (Caucasian) population 15 years and over
Males 26.0% Never married64.8% Now married0.2% Separated1.5% Widowed7.4% DivorcedFemales 24.3% Never married54.8% Now married0.5% Separated9.8% Widowed10.6% DivorcedWomen who gave birth in the past 12 months Now married:
100.0% (69)Unmarried:
0.0% (0)
Women who did not give birth in the past 12 months Now married:
46.8% (1,498)Unmarried:
53.2% (1,701)
Marital status - Black or African American population 15 years and over
Males 0.0% Never married67.3% Now married32.7% Separated0.0% Widowed0.0% DivorcedFemales 50.6% Never married49.4% Now married0.0% Separated0.0% Widowed0.0% DivorcedWomen who did not give birth in the past 12 months Now married:
8.2% (6)Unmarried:
91.8% (69)
Marital status - American Indian / Alaska Native population 15 years and over
Males 0.0% Never married100.0% Now married0.0% Separated0.0% Widowed0.0% DivorcedFemales 47.8% Never married0.0% Now married0.0% Separated52.2% Widowed0.0% DivorcedWomen who did not give birth in the past 12 months Now married:
0.0% (0)Unmarried:
100.0% (18)
Marital status - Asian population 15 years and over
Males 42.6% Never married57.4% Now married0.0% Separated0.0% Widowed0.0% DivorcedFemales 18.4% Never married68.4% Now married0.0% Separated0.0% Widowed13.3% DivorcedWomen who gave birth in the past 12 months Now married:
100.0% (18)Unmarried:
0.0% (0)
Women who did not give birth in the past 12 months Now married:
61.3% (188)Unmarried:
38.7% (119)
Marital status - Other race population 15 years and over
Males 2.9% Never married82.7% Now married0.0% Separated0.0% Widowed14.4% DivorcedFemales 11.5% Never married43.8% Now married0.0% Separated5.3% Widowed39.4% DivorcedWomen who did not give birth in the past 12 months Now married:
51.6% (126)Unmarried:
48.4% (118)
Marital status - Two or more races population 15 years and over
Males 38.7% Never married53.8% Now married5.2% Separated0.0% Widowed2.3% DivorcedFemales 37.7% Never married54.0% Now married0.0% Separated8.3% Widowed0.0% DivorcedWomen who did not give birth in the past 12 months Now married:
49.2% (147)Unmarried:
50.8% (152)
Marital status - White alone, not Hispanic / Latino population 15 years and over
Males 26.3% Never married64.3% Now married0.2% Separated1.6% Widowed7.6% DivorcedFemales 23.6% Never married55.5% Now married0.5% Separated10.0% Widowed10.4% DivorcedWomen who gave birth in the past 12 months Now married:
100.0% (80)Unmarried:
0.0% (0)
Women who did not give birth in the past 12 months Now married:
47.4% (1,618)Unmarried:
52.6% (1,798)
Marital status - Hispanic or Latino population 15 years and over
Males 13.0% Never married79.9% Now married3.4% Separated0.0% Widowed3.8% DivorcedFemales 30.6% Never married44.4% Now married0.0% Separated7.0% Widowed18.0% DivorcedWomen who did not give birth in the past 12 months Now married:
45.1% (256)Unmarried:
54.9% (312)
Ancestries in Geneva
1,480 19.2% German749 9.7% Italian701 9.1% Irish545 7.1% Polish465 6.0% European387 5.0% English374 4.9% American229 3.0% Swedish163 2.1% Norwegian88 1.1% French Canadian72 0.9% Northern European71 0.9% Eastern European60 0.8% Czech44 0.6% Ukrainian42 0.5% Scotch-Irish41 0.5% Greek37 0.5% Danish37 0.5% Lithuanian35 0.5% Scottish34 0.4% Hungarian34 0.4% Jamaican31 0.4% British27 0.4% Luxembourger23 0.3% Czechoslovakian22 0.3% Croatian22 0.3% French22 0.3% Scandinavian20 0.3% Finnish20 0.3% Russian15 0.2% Welsh14 0.2% Serbian14 0.2% Turkish8 0.1% Slovene7 0.09% Swiss6 0.08% Dutch
Children Nativity (place of birth) in Geneva
Children under 6 years - Living with two parents Both parents native 1,132 100.0% NativeBoth parents foreign-born 7 100.0% NativeChildren under 6 years - Living with one parent Native parent 57 100.0% NativeChildren 6 to 17 years - Living with two parents Both parents native 2,331 100.0% NativeBoth parents foreign-born 179 89.0% Native22 11.0% Foreign-bornOne native, one foreign-born parent 80 100.0% NativeChildren 6 to 17 years - Living with one parent Native parent 593 68.9% Native267 31.1% Foreign-bornForeign-born parent 167 91.9% Native15 8.1% Foreign-born