Races in Garfield, New Jersey (NJ) Detailed Stats
Data:
Races - White alone (%)
Races - White alone (% change since 2000)
Races - Black alone (%)
Races - Black alone (% change since 2000)
Races - American Indian alone (%)
Races - American Indian alone (% change since 2000)
Races - Asian alone (%)
Races - Asian alone (% change since 2000)
Races - Hispanic (%)
Races - Hispanic (% change since 2000)
Races - Native Hawaiian and Other Pacific Islander alone (%)
Races - Native Hawaiian and Other Pacific Islander alone (% change since 2000)
Races - Two or more races(%)
Races - Two or more races(% change since 2000)
Races - Other race alone (%)
Races - Other race alone (% change since 2000)
Racial diversity
Place of birth - Born in state of residence (%)
Place of birth - Born in state of residence (%) - White
Place of birth - Born in state of residence (%) - Black or African American
Place of birth - Born in state of residence (%) - Asian
Place of birth - Born in state of residence (%) - Hispanic or Latino
Place of birth - Born in state of residence (%) - American Indian and Alaska Native
Place of birth - Born in state of residence (%) - Multirace
Place of birth - Born in state of residence (%) - Other Race
Place of birth - Born in other state (%)
Place of birth - Born in other state (%) - White
Place of birth - Born in other state (%) - Black or African American
Place of birth - Born in other state (%) - Asian
Place of birth - Born in other state (%) - Hispanic or Latino
Place of birth - Born in other state (%) - American Indian and Alaska Native
Place of birth - Born in other state (%) - Multirace
Place of birth - Born in other state (%) - Other Race
Place of birth - Native, outside of US (%)
Place of birth - Native, outside of US (%) - White
Place of birth - Native, outside of US (%) - Black or African American
Place of birth - Native, outside of US (%) - Asian
Place of birth - Native, outside of US (%) - Hispanic or Latino
Place of birth - Native, outside of US (%) - American Indian and Alaska Native
Place of birth - Native, outside of US (%) - Multirace
Place of birth - Native, outside of US (%) - Other Race
Place of birth - Foreign born (%)
Place of birth - Foreign born (%) - White
Place of birth - Foreign born (%) - Black or African American
Place of birth - Foreign born (%) - Asian
Place of birth - Foreign born (%) - Hispanic or Latino
Place of birth - Foreign born (%) - American Indian and Alaska Native
Place of birth - Foreign born (%) - Multirace
Place of birth - Foreign born (%) - Other Race
Residents speaking English at home (%)
Residents speaking English at home - Born in the United States (%)
Residents speaking English at home - Native, born elsewhere (%)
Residents speaking English at home - Foreign born (%)
Residents speaking Spanish at home (%)
Residents speaking Spanish at home - Born in the United States (%)
Residents speaking Spanish at home - Native, born elsewhere (%)
Residents speaking Spanish at home - Foreign born (%)
Residents speaking other language at home (%)
Residents speaking other language at home - Born in the United States (%)
Residents speaking other language at home - Native, born elsewhere (%)
Residents speaking other language at home - Foreign born (%)
Marital status - Never married (%)
Marital status - Now married (%)
Marital status - Separated (%)
Marital status - Widowed (%)
Marital status - Divorced (%)
Ancestries Reported - Arab (%)
Ancestries Reported - Czech (%)
Ancestries Reported - Danish (%)
Ancestries Reported - Dutch (%)
Ancestries Reported - English (%)
Ancestries Reported - French (%)
Ancestries Reported - French Canadian (%)
Ancestries Reported - German (%)
Ancestries Reported - Greek (%)
Ancestries Reported - Hungarian (%)
Ancestries Reported - Irish (%)
Ancestries Reported - Italian (%)
Ancestries Reported - Lithuanian (%)
Ancestries Reported - Norwegian (%)
Ancestries Reported - Polish (%)
Ancestries Reported - Portuguese (%)
Ancestries Reported - Russian (%)
Ancestries Reported - Scotch-Irish (%)
Ancestries Reported - Scottish (%)
Ancestries Reported - Slovak (%)
Ancestries Reported - Subsaharan African (%)
Ancestries Reported - Swedish (%)
Ancestries Reported - Swiss (%)
Ancestries Reported - Ukrainian (%)
Ancestries Reported - United States (%)
Ancestries Reported - Welsh (%)
Ancestries Reported - West Indian (%)
Ancestries Reported - Other (%)
Geographical mobility - Same house 1 year ago (%)
Geographical mobility - Same house 1 year ago (%) - White
Geographical mobility - Same house 1 year ago (%) - Black or African American
Geographical mobility - Same house 1 year ago (%) - Asian
Geographical mobility - Same house 1 year ago (%) - Hispanic or Latino
Geographical mobility - Same house 1 year ago (%) - American Indian and Alaska Native
Geographical mobility - Same house 1 year ago (%) - Multirace
Geographical mobility - Same house 1 year ago (%) - Other Race
Geographical mobility - Moved within same county (%)
Geographical mobility - Moved within same county (%) - White
Geographical mobility - Moved within same county (%) - Black or African American
Geographical mobility - Moved within same county (%) - Asian
Geographical mobility - Moved within same county (%) - Hispanic or Latino
Geographical mobility - Moved within same county (%) - American Indian and Alaska Native
Geographical mobility - Moved within same county (%) - Multirace
Geographical mobility - Moved within same county (%) - Other Race
Geographical mobility - Moved from different county within same state (%)
Geographical mobility - Moved from different county within same state (%) - White
Geographical mobility - Moved from different county within same state (%) - Black or African American
Geographical mobility - Moved from different county within same state (%) - Asian
Geographical mobility - Moved from different county within same state (%) - Hispanic or Latino
Geographical mobility - Moved from different county within same state (%) - American Indian and Alaska Native
Geographical mobility - Moved from different county within same state (%) - Multirace
Geographical mobility - Moved from different county within same state (%) - Other Race
Geographical mobility - Moved from different state (%)
Geographical mobility - Moved from different state (%) - White
Geographical mobility - Moved from different state (%) - Black or African American
Geographical mobility - Moved from different state (%) - Asian
Geographical mobility - Moved from different state (%) - Hispanic or Latino
Geographical mobility - Moved from different state (%) - American Indian and Alaska Native
Geographical mobility - Moved from different state (%) - Multirace
Geographical mobility - Moved from different state (%) - Other Race
Geographical mobility - Moved from abroad (%)
Geographical mobility - Moved from abroad (%) - White
Geographical mobility - Moved from abroad (%) - Black or African American
Geographical mobility - Moved from abroad (%) - Asian
Geographical mobility - Moved from abroad (%) - Hispanic or Latino
Geographical mobility - Moved from abroad (%) - American Indian and Alaska Native
Geographical mobility - Moved from abroad (%) - Multirace
Geographical mobility - Moved from abroad (%) - Other Race
Place of birth for the foreign-born population - Ireland (%)
Place of birth for the foreign-born population - Denmark (%)
Place of birth for the foreign-born population - Norway (%)
Place of birth for the foreign-born population - Sweden (%)
Place of birth for the foreign-born population - United Kingdom (%)
Place of birth for the foreign-born population - England (%)
Place of birth for the foreign-born population - Scotland (%)
Place of birth for the foreign-born population - Other Northern Europe (%)
Place of birth for the foreign-born population - Austria (%)
Place of birth for the foreign-born population - Belgium (%)
Place of birth for the foreign-born population - France (%)
Place of birth for the foreign-born population - Germany (%)
Place of birth for the foreign-born population - Netherlands (%)
Place of birth for the foreign-born population - Switzerland (%)
Place of birth for the foreign-born population - Other Western Europe (%)
Place of birth for the foreign-born population - Greece (%)
Place of birth for the foreign-born population - Italy (%)
Place of birth for the foreign-born population - Portugal (%)
Place of birth for the foreign-born population - Spain (%)
Place of birth for the foreign-born population - Other Southern Europe (%)
Place of birth for the foreign-born population - Albania (%)
Place of birth for the foreign-born population - Belarus (%)
Place of birth for the foreign-born population - Bosnia and Herzegovina (%)
Place of birth for the foreign-born population - Bulgaria (%)
Place of birth for the foreign-born population - Croatia (%)
Place of birth for the foreign-born population - Czechoslovakia (%)
Place of birth for the foreign-born population - Hungary (%)
Place of birth for the foreign-born population - Latvia (%)
Place of birth for the foreign-born population - Lithuania (%)
Place of birth for the foreign-born population - North Macedonia (Macedonia) (%)
Place of birth for the foreign-born population - Moldova (%)
Place of birth for the foreign-born population - Poland (%)
Place of birth for the foreign-born population - Romania (%)
Place of birth for the foreign-born population - Russia (%)
Place of birth for the foreign-born population - Serbia (%)
Place of birth for the foreign-born population - Ukraine (%)
Place of birth for the foreign-born population - Other Eastern Europe (%)
Place of birth for the foreign-born population - China (%)
Place of birth for the foreign-born population - Hong Kong (%)
Place of birth for the foreign-born population - Taiwan (%)
Place of birth for the foreign-born population - Japan (%)
Place of birth for the foreign-born population - Korea (%)
Place of birth for the foreign-born population - Other Eastern Asia (%)
Place of birth for the foreign-born population - Afghanistan (%)
Place of birth for the foreign-born population - Bangladesh (%)
Place of birth for the foreign-born population - India (%)
Place of birth for the foreign-born population - Iran (%)
Place of birth for the foreign-born population - Kazakhstan (%)
Place of birth for the foreign-born population - Nepal (%)
Place of birth for the foreign-born population - Pakistan (%)
Place of birth for the foreign-born population - Sri Lanka (%)
Place of birth for the foreign-born population - Uzbekistan (%)
Place of birth for the foreign-born population - Other South Central Asia (%)
Place of birth for the foreign-born population - Burma (%)
Place of birth for the foreign-born population - Cambodia (%)
Place of birth for the foreign-born population - Indonesia (%)
Place of birth for the foreign-born population - Laos (%)
Place of birth for the foreign-born population - Malaysia (%)
Place of birth for the foreign-born population - Philippines (%)
Place of birth for the foreign-born population - Singapore (%)
Place of birth for the foreign-born population - Thailand (%)
Place of birth for the foreign-born population - Vietnam (%)
Place of birth for the foreign-born population - Other South Eastern Asia (%)
Place of birth for the foreign-born population - Armenia (%)
Place of birth for the foreign-born population - Iraq (%)
Place of birth for the foreign-born population - Israel (%)
Place of birth for the foreign-born population - Jordan (%)
Place of birth for the foreign-born population - Kuwait (%)
Place of birth for the foreign-born population - Lebanon (%)
Place of birth for the foreign-born population - Saudi Arabia (%)
Place of birth for the foreign-born population - Syria (%)
Place of birth for the foreign-born population - Turkey (%)
Place of birth for the foreign-born population - Yemen (%)
Place of birth for the foreign-born population - Other Western Asia (%)
Place of birth for the foreign-born population - Eritrea (%)
Place of birth for the foreign-born population - Ethiopia (%)
Place of birth for the foreign-born population - Kenya (%)
Place of birth for the foreign-born population - Somalia (%)
Place of birth for the foreign-born population - Uganda (%)
Place of birth for the foreign-born population - Zimbabwe (%)
Place of birth for the foreign-born population - Other Eastern Africa (%)
Place of birth for the foreign-born population - Cameroon (%)
Place of birth for the foreign-born population - Congo (%)
Place of birth for the foreign-born population - Democratic Republic of Congo (Zaire) (%)
Place of birth for the foreign-born population - Other Middle Africa (%)
Place of birth for the foreign-born population - Egypt (%)
Place of birth for the foreign-born population - Morocco (%)
Place of birth for the foreign-born population - Sudan (%)
Place of birth for the foreign-born population - Other Northern Africa (%)
Place of birth for the foreign-born population - South Africa (%)
Place of birth for the foreign-born population - Other Southern Africa (%)
Place of birth for the foreign-born population - Cabo Verde (%)
Place of birth for the foreign-born population - Ghana (%)
Place of birth for the foreign-born population - Liberia (%)
Place of birth for the foreign-born population - Nigeria (%)
Place of birth for the foreign-born population - Senegal (%)
Place of birth for the foreign-born population - Sierra Leone (%)
Place of birth for the foreign-born population - Other Western Africa (%)
Place of birth for the foreign-born population - Australia (%)
Place of birth for the foreign-born population - New Zealand (%)
Place of birth for the foreign-born population - Fiji (%)
Place of birth for the foreign-born population - Micronesia (%)
Place of birth for the foreign-born population - Bahamas (%)
Place of birth for the foreign-born population - Barbados (%)
Place of birth for the foreign-born population - Cuba (%)
Place of birth for the foreign-born population - Dominica (%)
Place of birth for the foreign-born population - Dominican Republic (%)
Place of birth for the foreign-born population - Grenada (%)
Place of birth for the foreign-born population - Haiti (%)
Place of birth for the foreign-born population - Jamaica (%)
Place of birth for the foreign-born population - St. Vincent and the Grenadines (%)
Place of birth for the foreign-born population - Trinidad and Tobago (%)
Place of birth for the foreign-born population - West Indies (%)
Place of birth for the foreign-born population - Other Caribbean (%)
Place of birth for the foreign-born population - Belize (%)
Place of birth for the foreign-born population - Costa Rica (%)
Place of birth for the foreign-born population - El Salvador (%)
Place of birth for the foreign-born population - Guatemala (%)
Place of birth for the foreign-born population - Honduras (%)
Place of birth for the foreign-born population - Mexico (%)
Place of birth for the foreign-born population - Nicaragua (%)
Place of birth for the foreign-born population - Panama (%)
Place of birth for the foreign-born population - Other Central America (%)
Place of birth for the foreign-born population - Argentina (%)
Place of birth for the foreign-born population - Bolivia (%)
Place of birth for the foreign-born population - Brazil (%)
Place of birth for the foreign-born population - Chile (%)
Place of birth for the foreign-born population - Colombia (%)
Place of birth for the foreign-born population - Ecuador (%)
Place of birth for the foreign-born population - Guyana (%)
Place of birth for the foreign-born population - Peru (%)
Place of birth for the foreign-born population - Uruguay (%)
Place of birth for the foreign-born population - Venezuela (%)
Place of birth for the foreign-born population - Other South America (%)
Place of birth for the foreign-born population - Canada (%)
Place of birth for the foreign-born population - Other Northern America (%)
Place of birth for the foreign-born population - Other (%)
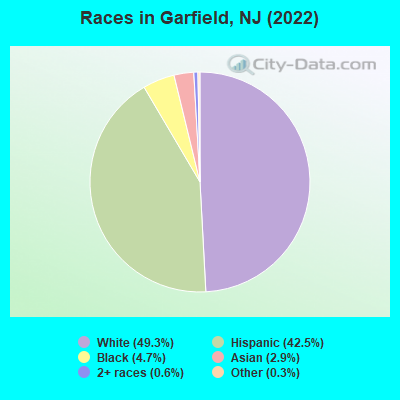
According to 2022 data, the most numerous races in Garfield, NJ are White alone (15,991 residents), Hispanic (13,791 residents), and Black alone (1,520 residents). 32.4% of Garfield residents speak English at home. 47.7% of Garfield, NJ residents are foreign-born (22.1% born in Latin America, 20.2% born in Europe), which is 51.8% greater than the foreign-born rate of 23.0% across the entire state of New Jersey.
Race distribution in Garfield
2000 2022
5,557,209 66.0% White alone 1,117,191 13.3% Hispanic 1,096,171 13.0% Black alone 477,012 5.7% Asian alone 133,689 1.6% Two or more races 19,565 0.2% Other race alone 11,338 0.1% American Indian alone 2,175 0.03% Native Hawaiian and Other
4,766,476 51.5% White alone 2,028,470 21.9% Hispanic 1,111,632 12.0% Black alone 923,546 10.0% Asian alone 332,237 3.6% Two or more races 89,847 1.0% Other race alone 8,557 0.09% American Indian alone 934 0.01% Native Hawaiian and Other
Income and house value in Garfield Median household income in 2022 $68,879 White non-Hispanic householders$81,247 Black householders$69,116 Asian householders$83,156 Some other race householders$64,215 Two or more races householders$74,265 Hispanic or Latino race householdersMedian 2022 house value $398,851 White Non-Hispanic householders$392,137 Black or African American householders$341,908 American Indian or Alaska Native householders $341,908 Asian householders$417,998 Some other race householders$404,073 Two or more races householders$425,209 Hispanic or Latino householders
Median age by race in Garfield
40.9 Median age for White residents40.3 41.5 32.6 Median age for Black or African American residents35.6 27.0 -766,197,182.3 Median age for American Indian / Alaska Native residents-686,322,685.6 -753,722,794.2 44.7 Median age for Asian residents46.3 45.0 -510,460,250.5 Median age for Native Hawaiian / Pacific Islander residents-514,767,932.0 -713,070,378.3 39.2 Median age for Other race residents40.5 37.7 40.6 Median age for Two or more races residents42.6 34.2 43.8 Median age for White alone residents42.2 45.2 35.6 Median age for Hispanic or Latino residents37.2 34.2
Owner/renter occupied households by race in Garfield
House owners and renters - White residents 3,606 49.7% Owner occupied3,642 50.3% Renter occupiedHouse owners and renters - Black or African American residents 307 53.2% Owner occupied270 46.8% Renter occupiedHouse owners and renters - American Indian / Alaska Native residents 33 100.0% Renter occupiedHouse owners and renters - Asian residents 186 46.0% Owner occupied218 54.0% Renter occupiedHouse owners and renters - Other race residents 1,016 48.4% Owner occupied1,084 51.6% Renter occupiedHouse owners and renters - Two or more races residents 761 45.6% Owner occupied907 54.4% Renter occupiedHouse owners and renters - White alone residents 3,379 52.5% Owner occupied3,054 47.5% Renter occupiedHouse owners and renters - Hispanic or Latino residents 1,665 39.6% Owner occupied2,538 60.4% Renter occupied
Language usage in Garfield
English speakers - Total 32.4% of residents of Garfield speak English at home.
38.7% of residents speak Spanish at home 6,445 54.5% Speak English very well5,388 45.5% Speak English less than very well31.2% of residents speak other language at home 4,771 50.0% Speak English very well4,780 50.0% Speak English less than very well
English speakers - Born in the United States 53.0% of residents of Garfield speak English at home.
47.3% of residents speak Spanish at home 1,422 94.9% Speak English very well76 5.1% Speak English less than very well5.2% of residents speak other language at home 151 91.5% Speak English very well14 8.5% Speak English less than very well
English speakers - Native, born elsewhere 12.5% of residents of Garfield speak English at home.
84.7% of residents speak Spanish at home 385 61.9% Speak English very well237 38.1% Speak English less than very well9.9% of residents speak other language at home 41 56.2% Speak English very well32 43.8% Speak English less than very well
English speakers - Foreign-born 6.0% of residents of Garfield speak English at home.
45.9% of residents speak Spanish at home 2,320 32.8% Speak English very well4,761 67.2% Speak English less than very well49.8% of residents speak other language at home 3,066 39.9% Speak English very well4,614 60.1% Speak English less than very well
White (Caucasian) - Speak only English Native:
67.5% (6,742)Foreign-born:
6.8% (504)
White (Caucasian) - Speak another language Native:
27.1% (2,702)Foreign-born:
89.7% (6,654)
Black or African American - Speak only English Native:
93.5% (1,376)Foreign-born:
62.9% (154)
Black or African American - Speak another language Native:
6.5% (95)Foreign-born:
36.7% (90)
Asian - Speak only English Native:
78.5% (154)Foreign-born:
8.8% (62)
Asian - Speak another language Native:
23.0% (45)Foreign-born:
91.3% (643)
Other race - Speak only English Native:
12.9% (297)Foreign-born:
3.5% (133)
Other race - Speak another language Native:
91.1% (2,095)Foreign-born:
97.9% (3,772)
Two or more races - Speak only English Native:
22.6% (437)Foreign-born:
0.3% (8)
Two or more races - Speak another language Native:
82.0% (1,585)Foreign-born:
100.0% (2,889)
White alone - Speak only English Native:
77.2% (6,365)Foreign-born:
6.3% (435)
White alone - Speak another language Native:
22.0% (1,814)Foreign-born:
94.2% (6,492)
Hispanic or Latino - Speak only English Native:
21.5% (1,198)Foreign-born:
3.7% (274)
Hispanic or Latino - Speak another language Native:
82.0% (4,567)Foreign-born:
95.5% (7,051)
Foreign-born residents in Garfield 15,501 residents are foreign born (22.1% Latin America , 20.2% Europe ).
This city:
47.7%New Jersey:
23.2%
Marital status for residents in Garfield Marital status - White (Caucasian) population 15 years and over
Males 35.2% Never married48.4% Now married1.8% Separated2.8% Widowed11.7% DivorcedFemales 28.7% Never married48.3% Now married1.7% Separated11.3% Widowed10.0% DivorcedWomen who gave birth in the past 12 months Now married:
69.7% (273)Unmarried:
30.3% (119)
Women who did not give birth in the past 12 months Now married:
44.9% (1,680)Unmarried:
55.1% (2,063)
Marital status - Black or African American population 15 years and over
Males 47.8% Never married42.2% Now married0.0% Separated4.5% Widowed5.5% DivorcedFemales 62.2% Never married25.5% Now married5.4% Separated6.0% Widowed0.9% DivorcedWomen who gave birth in the past 12 months Now married:
10.3% (4)Unmarried:
89.7% (36)
Women who did not give birth in the past 12 months Now married:
36.2% (160)Unmarried:
63.8% (281)
Marital status - Asian population 15 years and over
Males 48.7% Never married47.8% Now married0.0% Separated1.3% Widowed2.2% DivorcedFemales 19.1% Never married68.3% Now married7.3% Separated3.0% Widowed2.3% DivorcedWomen who gave birth in the past 12 months Now married:
0.0% (0)Unmarried:
100.0% (9)
Women who did not give birth in the past 12 months Now married:
71.6% (175)Unmarried:
28.4% (69)
Marital status - Other race population 15 years and over
Males 39.9% Never married51.8% Now married1.3% Separated1.5% Widowed5.5% DivorcedFemales 31.0% Never married47.7% Now married12.2% Separated3.3% Widowed5.8% DivorcedWomen who gave birth in the past 12 months Now married:
100.0% (35)Unmarried:
0.0% (0)
Women who did not give birth in the past 12 months Now married:
55.9% (959)Unmarried:
44.1% (758)
Marital status - Two or more races population 15 years and over
Males 41.9% Never married51.2% Now married3.8% Separated0.0% Widowed3.2% DivorcedFemales 52.1% Never married34.3% Now married0.0% Separated0.6% Widowed13.0% DivorcedWomen who gave birth in the past 12 months Now married:
0.0% (0)Unmarried:
100.0% (32)
Women who did not give birth in the past 12 months Now married:
26.0% (439)Unmarried:
74.0% (1,250)
Marital status - White alone, not Hispanic / Latino population 15 years and over
Males 35.2% Never married46.8% Now married1.3% Separated3.7% Widowed13.1% DivorcedFemales 26.8% Never married49.7% Now married1.8% Separated13.8% Widowed7.8% DivorcedWomen who gave birth in the past 12 months Now married:
75.2% (221)Unmarried:
24.8% (73)
Women who did not give birth in the past 12 months Now married:
43.8% (1,343)Unmarried:
56.2% (1,722)
Marital status - Hispanic or Latino population 15 years and over
Males 38.9% Never married52.0% Now married2.7% Separated0.5% Widowed5.8% DivorcedFemales 38.9% Never married41.6% Now married4.5% Separated2.3% Widowed12.8% DivorcedWomen who gave birth in the past 12 months Now married:
57.0% (123)Unmarried:
43.0% (93)
Women who did not give birth in the past 12 months Now married:
42.9% (1,553)Unmarried:
57.1% (2,065)
Ancestries in Garfield
4,373 20.7% Polish1,470 6.9% Italian732 3.5% Macedonian530 2.5% Albanian366 1.7% American341 1.6% Turkish244 1.2% Yugoslavian243 1.1% Irish229 1.1% Jamaican209 1.0% German187 0.9% Portuguese173 0.8% Bulgarian159 0.8% Hungarian156 0.7% Ukrainian132 0.6% Slovak114 0.5% Egyptian101 0.5% Moroccan94 0.4% Russian87 0.4% English86 0.4% Haitian65 0.3% Syrian63 0.3% Dutch59 0.3% Slovene51 0.2% Brazilian46 0.2% Greek41 0.2% Romanian37 0.2% Croatian27 0.1% Scotch-Irish23 0.1% British West Indian16 0.08% Scottish15 0.07% Jordanian14 0.07% Czech12 0.06% British11 0.05% Armenian10 0.05% Czechoslovakian8 0.04% Lebanese8 0.04% Norwegian8 0.04% Eastern European7 0.03% Serbian6 0.03% Iranian6 0.03% European3 0.01% French2 0.01% Austrian
Geographical mobility in Garfield Same house 1 year ago 18,202 94.1% White (Caucasian)1,495 84.0% Black or African American31 96.6% American Indian / Alaska Native790 84.7% Asian14 100.0% Native Hawaiian / Pacific Islander5,988 92.7% Other race4,446 93.7% Two or more races14,612 92.6% White alone, not Hispanic / Latino12,867 93.6% Hispanic or LatinoMoved within same county 555 2.9% White / Caucasian40 2.2% Black or African American39 4.2% Asian193 3.0% Other race137 2.9% Two or more races530 3.4% White alone, not Hispanic / Latino385 2.8% Hispanic or LatinoMoved within same state 169 0.9% White / Caucasian134 7.5% Black or African American63 1.0% Other race102 2.1% Two or more races163 1.0% White alone, not Hispanic / Latino235 1.7% Hispanic or LatinoMoved from different state 255 1.3% White / Caucasian39 4.2% Asian51 0.8% Other race276 1.7% White alone, not Hispanic / Latino58 0.4% Hispanic or LatinoMoved from abroad 166 0.9% White126 7.1% Black or African American88 9.5% Asian121 1.9% Other race54 1.1% Two or more races240 1.5% White alone, not Hispanic / Latino147 1.1% Hispanic or Latino
Children Nativity (place of birth) in Garfield
Children under 6 years - Living with two parents Both parents native 348 100.0% NativeBoth parents foreign-born 639 93.7% Native43 6.3% Foreign-bornOne native, one foreign-born parent 494 100.0% NativeChildren under 6 years - Living with one parent Native parent 165 100.0% NativeForeign-born parent 476 100.0% NativeChildren 6 to 17 years - Living with two parents Both parents native 452 88.3% Native60 11.7% Foreign-bornBoth parents foreign-born 1,353 78.5% Native370 21.5% Foreign-bornOne native, one foreign-born parent 423 91.9% Native37 8.1% Foreign-bornChildren 6 to 17 years - Living with one parent Native parent 202 100.0% NativeForeign-born parent 806 52.2% Native738 47.8% Foreign-born
Place of birth for residents in Garfield 7,372 Americas7,362 Latin America6,716 Europe6,050 Eastern Europe3,310 Caribbean2,716 South America1,335 Central America1,155 Asia534 Southern Europe457 Western Asia269 Eastern Asia253 South Central Asia243 Africa136 Northern Africa135 South Eastern Asia120 Western Europe101 China45 Eastern Africa31 Western Africa13 Oceania13 Australia and New Zealand Subregion11 Northern Europe11 Southern Africa9 Northern America3,744 Poland2,418 Dominican Republic1,147 Peru938 North Macedonia (Macedonia)906 Colombia786 Mexico561 Cuba507 Albania358 Ecuador335 El Salvador320 Italy275 Turkey243 Jamaica176 Portugal158 Pakistan157 Korea149 Costa Rica128 Philippines116 Bulgaria99 Argentina86 Ukraine86 Syria84 Czechoslovakia77 Germany77 Egypt71 Brazil61 Hungary59 China58 Morocco57 Venezuela54 Dominica54 Bolivia50 Bosnia and Herzegovina47 Honduras45 Tanzania42 Taiwan36 Greece33 France33 Georgia31 Haiti28 Bangladesh27 Russia27 Saudi Arabia25 India21 Lebanon21 Afghanistan20 Nigeria19 Serbia17 Croatia17 Guatemala13 New Zealand12 Israel11 England11 South Africa10 Japan9 Belgium9 Canada7 Vietnam
Grandparents responsible for own grandchildren in Garfield
Grandparents (30 to 59 years) White / Caucasian 25 33.5% Responsible for grandchildren49 66.5% Not responsible for grandchildrenBlack or African American 24 100.0% Responsible for grandchildrenAsian 7 100.0% Not responsible for grandchildrenOther race 89 100.0% Not responsible for grandchildrenTwo or more races 30 100.0% Not responsible for grandchildrenWhite alone, not Hispanic / Latino 28 31.9% Responsible for grandchildren59 68.1% Not responsible for grandchildrenHispanic or Latino 45 100.0% Not responsible for grandchildrenGrandparents (60 years and over) White / Caucasian 41 19.9% Responsible for grandchildren163 80.1% Not responsible for grandchildrenBlack or African American 39 100.0% Not responsible for grandchildrenAsian 7 100.0% Not responsible for grandchildrenOther race 418 100.0% Not responsible for grandchildrenWhite alone, not Hispanic / Latino 56 27.4% Responsible for grandchildren149 72.6% Not responsible for grandchildrenHispanic or Latino 449 100.0% Not responsible for grandchildren