Races in Gallatin, Tennessee (TN) Detailed Stats
Data:
Races - White alone (%)
Races - White alone (% change since 2000)
Races - Black alone (%)
Races - Black alone (% change since 2000)
Races - American Indian alone (%)
Races - American Indian alone (% change since 2000)
Races - Asian alone (%)
Races - Asian alone (% change since 2000)
Races - Hispanic (%)
Races - Hispanic (% change since 2000)
Races - Native Hawaiian and Other Pacific Islander alone (%)
Races - Native Hawaiian and Other Pacific Islander alone (% change since 2000)
Races - Two or more races(%)
Races - Two or more races(% change since 2000)
Races - Other race alone (%)
Races - Other race alone (% change since 2000)
Racial diversity
Place of birth - Born in state of residence (%)
Place of birth - Born in state of residence (%) - White
Place of birth - Born in state of residence (%) - Black or African American
Place of birth - Born in state of residence (%) - Asian
Place of birth - Born in state of residence (%) - Hispanic or Latino
Place of birth - Born in state of residence (%) - American Indian and Alaska Native
Place of birth - Born in state of residence (%) - Multirace
Place of birth - Born in state of residence (%) - Other Race
Place of birth - Born in other state (%)
Place of birth - Born in other state (%) - White
Place of birth - Born in other state (%) - Black or African American
Place of birth - Born in other state (%) - Asian
Place of birth - Born in other state (%) - Hispanic or Latino
Place of birth - Born in other state (%) - American Indian and Alaska Native
Place of birth - Born in other state (%) - Multirace
Place of birth - Born in other state (%) - Other Race
Place of birth - Native, outside of US (%)
Place of birth - Native, outside of US (%) - White
Place of birth - Native, outside of US (%) - Black or African American
Place of birth - Native, outside of US (%) - Asian
Place of birth - Native, outside of US (%) - Hispanic or Latino
Place of birth - Native, outside of US (%) - American Indian and Alaska Native
Place of birth - Native, outside of US (%) - Multirace
Place of birth - Native, outside of US (%) - Other Race
Place of birth - Foreign born (%)
Place of birth - Foreign born (%) - White
Place of birth - Foreign born (%) - Black or African American
Place of birth - Foreign born (%) - Asian
Place of birth - Foreign born (%) - Hispanic or Latino
Place of birth - Foreign born (%) - American Indian and Alaska Native
Place of birth - Foreign born (%) - Multirace
Place of birth - Foreign born (%) - Other Race
Residents speaking English at home (%)
Residents speaking English at home - Born in the United States (%)
Residents speaking English at home - Native, born elsewhere (%)
Residents speaking English at home - Foreign born (%)
Residents speaking Spanish at home (%)
Residents speaking Spanish at home - Born in the United States (%)
Residents speaking Spanish at home - Native, born elsewhere (%)
Residents speaking Spanish at home - Foreign born (%)
Residents speaking other language at home (%)
Residents speaking other language at home - Born in the United States (%)
Residents speaking other language at home - Native, born elsewhere (%)
Residents speaking other language at home - Foreign born (%)
Marital status - Never married (%)
Marital status - Now married (%)
Marital status - Separated (%)
Marital status - Widowed (%)
Marital status - Divorced (%)
Ancestries Reported - Arab (%)
Ancestries Reported - Czech (%)
Ancestries Reported - Danish (%)
Ancestries Reported - Dutch (%)
Ancestries Reported - English (%)
Ancestries Reported - French (%)
Ancestries Reported - French Canadian (%)
Ancestries Reported - German (%)
Ancestries Reported - Greek (%)
Ancestries Reported - Hungarian (%)
Ancestries Reported - Irish (%)
Ancestries Reported - Italian (%)
Ancestries Reported - Lithuanian (%)
Ancestries Reported - Norwegian (%)
Ancestries Reported - Polish (%)
Ancestries Reported - Portuguese (%)
Ancestries Reported - Russian (%)
Ancestries Reported - Scotch-Irish (%)
Ancestries Reported - Scottish (%)
Ancestries Reported - Slovak (%)
Ancestries Reported - Subsaharan African (%)
Ancestries Reported - Swedish (%)
Ancestries Reported - Swiss (%)
Ancestries Reported - Ukrainian (%)
Ancestries Reported - United States (%)
Ancestries Reported - Welsh (%)
Ancestries Reported - West Indian (%)
Ancestries Reported - Other (%)
Geographical mobility - Same house 1 year ago (%)
Geographical mobility - Same house 1 year ago (%) - White
Geographical mobility - Same house 1 year ago (%) - Black or African American
Geographical mobility - Same house 1 year ago (%) - Asian
Geographical mobility - Same house 1 year ago (%) - Hispanic or Latino
Geographical mobility - Same house 1 year ago (%) - American Indian and Alaska Native
Geographical mobility - Same house 1 year ago (%) - Multirace
Geographical mobility - Same house 1 year ago (%) - Other Race
Geographical mobility - Moved within same county (%)
Geographical mobility - Moved within same county (%) - White
Geographical mobility - Moved within same county (%) - Black or African American
Geographical mobility - Moved within same county (%) - Asian
Geographical mobility - Moved within same county (%) - Hispanic or Latino
Geographical mobility - Moved within same county (%) - American Indian and Alaska Native
Geographical mobility - Moved within same county (%) - Multirace
Geographical mobility - Moved within same county (%) - Other Race
Geographical mobility - Moved from different county within same state (%)
Geographical mobility - Moved from different county within same state (%) - White
Geographical mobility - Moved from different county within same state (%) - Black or African American
Geographical mobility - Moved from different county within same state (%) - Asian
Geographical mobility - Moved from different county within same state (%) - Hispanic or Latino
Geographical mobility - Moved from different county within same state (%) - American Indian and Alaska Native
Geographical mobility - Moved from different county within same state (%) - Multirace
Geographical mobility - Moved from different county within same state (%) - Other Race
Geographical mobility - Moved from different state (%)
Geographical mobility - Moved from different state (%) - White
Geographical mobility - Moved from different state (%) - Black or African American
Geographical mobility - Moved from different state (%) - Asian
Geographical mobility - Moved from different state (%) - Hispanic or Latino
Geographical mobility - Moved from different state (%) - American Indian and Alaska Native
Geographical mobility - Moved from different state (%) - Multirace
Geographical mobility - Moved from different state (%) - Other Race
Geographical mobility - Moved from abroad (%)
Geographical mobility - Moved from abroad (%) - White
Geographical mobility - Moved from abroad (%) - Black or African American
Geographical mobility - Moved from abroad (%) - Asian
Geographical mobility - Moved from abroad (%) - Hispanic or Latino
Geographical mobility - Moved from abroad (%) - American Indian and Alaska Native
Geographical mobility - Moved from abroad (%) - Multirace
Geographical mobility - Moved from abroad (%) - Other Race
Place of birth for the foreign-born population - Ireland (%)
Place of birth for the foreign-born population - Denmark (%)
Place of birth for the foreign-born population - Norway (%)
Place of birth for the foreign-born population - Sweden (%)
Place of birth for the foreign-born population - United Kingdom (%)
Place of birth for the foreign-born population - England (%)
Place of birth for the foreign-born population - Scotland (%)
Place of birth for the foreign-born population - Other Northern Europe (%)
Place of birth for the foreign-born population - Austria (%)
Place of birth for the foreign-born population - Belgium (%)
Place of birth for the foreign-born population - France (%)
Place of birth for the foreign-born population - Germany (%)
Place of birth for the foreign-born population - Netherlands (%)
Place of birth for the foreign-born population - Switzerland (%)
Place of birth for the foreign-born population - Other Western Europe (%)
Place of birth for the foreign-born population - Greece (%)
Place of birth for the foreign-born population - Italy (%)
Place of birth for the foreign-born population - Portugal (%)
Place of birth for the foreign-born population - Spain (%)
Place of birth for the foreign-born population - Other Southern Europe (%)
Place of birth for the foreign-born population - Albania (%)
Place of birth for the foreign-born population - Belarus (%)
Place of birth for the foreign-born population - Bosnia and Herzegovina (%)
Place of birth for the foreign-born population - Bulgaria (%)
Place of birth for the foreign-born population - Croatia (%)
Place of birth for the foreign-born population - Czechoslovakia (%)
Place of birth for the foreign-born population - Hungary (%)
Place of birth for the foreign-born population - Latvia (%)
Place of birth for the foreign-born population - Lithuania (%)
Place of birth for the foreign-born population - North Macedonia (Macedonia) (%)
Place of birth for the foreign-born population - Moldova (%)
Place of birth for the foreign-born population - Poland (%)
Place of birth for the foreign-born population - Romania (%)
Place of birth for the foreign-born population - Russia (%)
Place of birth for the foreign-born population - Serbia (%)
Place of birth for the foreign-born population - Ukraine (%)
Place of birth for the foreign-born population - Other Eastern Europe (%)
Place of birth for the foreign-born population - China (%)
Place of birth for the foreign-born population - Hong Kong (%)
Place of birth for the foreign-born population - Taiwan (%)
Place of birth for the foreign-born population - Japan (%)
Place of birth for the foreign-born population - Korea (%)
Place of birth for the foreign-born population - Other Eastern Asia (%)
Place of birth for the foreign-born population - Afghanistan (%)
Place of birth for the foreign-born population - Bangladesh (%)
Place of birth for the foreign-born population - India (%)
Place of birth for the foreign-born population - Iran (%)
Place of birth for the foreign-born population - Kazakhstan (%)
Place of birth for the foreign-born population - Nepal (%)
Place of birth for the foreign-born population - Pakistan (%)
Place of birth for the foreign-born population - Sri Lanka (%)
Place of birth for the foreign-born population - Uzbekistan (%)
Place of birth for the foreign-born population - Other South Central Asia (%)
Place of birth for the foreign-born population - Burma (%)
Place of birth for the foreign-born population - Cambodia (%)
Place of birth for the foreign-born population - Indonesia (%)
Place of birth for the foreign-born population - Laos (%)
Place of birth for the foreign-born population - Malaysia (%)
Place of birth for the foreign-born population - Philippines (%)
Place of birth for the foreign-born population - Singapore (%)
Place of birth for the foreign-born population - Thailand (%)
Place of birth for the foreign-born population - Vietnam (%)
Place of birth for the foreign-born population - Other South Eastern Asia (%)
Place of birth for the foreign-born population - Armenia (%)
Place of birth for the foreign-born population - Iraq (%)
Place of birth for the foreign-born population - Israel (%)
Place of birth for the foreign-born population - Jordan (%)
Place of birth for the foreign-born population - Kuwait (%)
Place of birth for the foreign-born population - Lebanon (%)
Place of birth for the foreign-born population - Saudi Arabia (%)
Place of birth for the foreign-born population - Syria (%)
Place of birth for the foreign-born population - Turkey (%)
Place of birth for the foreign-born population - Yemen (%)
Place of birth for the foreign-born population - Other Western Asia (%)
Place of birth for the foreign-born population - Eritrea (%)
Place of birth for the foreign-born population - Ethiopia (%)
Place of birth for the foreign-born population - Kenya (%)
Place of birth for the foreign-born population - Somalia (%)
Place of birth for the foreign-born population - Uganda (%)
Place of birth for the foreign-born population - Zimbabwe (%)
Place of birth for the foreign-born population - Other Eastern Africa (%)
Place of birth for the foreign-born population - Cameroon (%)
Place of birth for the foreign-born population - Congo (%)
Place of birth for the foreign-born population - Democratic Republic of Congo (Zaire) (%)
Place of birth for the foreign-born population - Other Middle Africa (%)
Place of birth for the foreign-born population - Egypt (%)
Place of birth for the foreign-born population - Morocco (%)
Place of birth for the foreign-born population - Sudan (%)
Place of birth for the foreign-born population - Other Northern Africa (%)
Place of birth for the foreign-born population - South Africa (%)
Place of birth for the foreign-born population - Other Southern Africa (%)
Place of birth for the foreign-born population - Cabo Verde (%)
Place of birth for the foreign-born population - Ghana (%)
Place of birth for the foreign-born population - Liberia (%)
Place of birth for the foreign-born population - Nigeria (%)
Place of birth for the foreign-born population - Senegal (%)
Place of birth for the foreign-born population - Sierra Leone (%)
Place of birth for the foreign-born population - Other Western Africa (%)
Place of birth for the foreign-born population - Australia (%)
Place of birth for the foreign-born population - New Zealand (%)
Place of birth for the foreign-born population - Fiji (%)
Place of birth for the foreign-born population - Micronesia (%)
Place of birth for the foreign-born population - Bahamas (%)
Place of birth for the foreign-born population - Barbados (%)
Place of birth for the foreign-born population - Cuba (%)
Place of birth for the foreign-born population - Dominica (%)
Place of birth for the foreign-born population - Dominican Republic (%)
Place of birth for the foreign-born population - Grenada (%)
Place of birth for the foreign-born population - Haiti (%)
Place of birth for the foreign-born population - Jamaica (%)
Place of birth for the foreign-born population - St. Vincent and the Grenadines (%)
Place of birth for the foreign-born population - Trinidad and Tobago (%)
Place of birth for the foreign-born population - West Indies (%)
Place of birth for the foreign-born population - Other Caribbean (%)
Place of birth for the foreign-born population - Belize (%)
Place of birth for the foreign-born population - Costa Rica (%)
Place of birth for the foreign-born population - El Salvador (%)
Place of birth for the foreign-born population - Guatemala (%)
Place of birth for the foreign-born population - Honduras (%)
Place of birth for the foreign-born population - Mexico (%)
Place of birth for the foreign-born population - Nicaragua (%)
Place of birth for the foreign-born population - Panama (%)
Place of birth for the foreign-born population - Other Central America (%)
Place of birth for the foreign-born population - Argentina (%)
Place of birth for the foreign-born population - Bolivia (%)
Place of birth for the foreign-born population - Brazil (%)
Place of birth for the foreign-born population - Chile (%)
Place of birth for the foreign-born population - Colombia (%)
Place of birth for the foreign-born population - Ecuador (%)
Place of birth for the foreign-born population - Guyana (%)
Place of birth for the foreign-born population - Peru (%)
Place of birth for the foreign-born population - Uruguay (%)
Place of birth for the foreign-born population - Venezuela (%)
Place of birth for the foreign-born population - Other South America (%)
Place of birth for the foreign-born population - Canada (%)
Place of birth for the foreign-born population - Other Northern America (%)
Place of birth for the foreign-born population - Other (%)
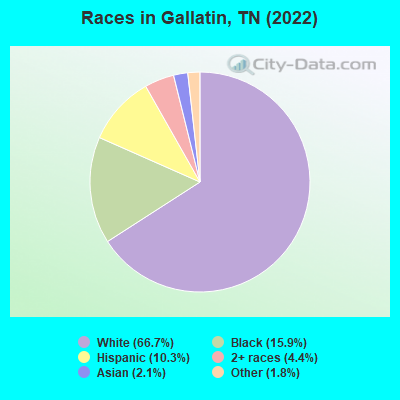
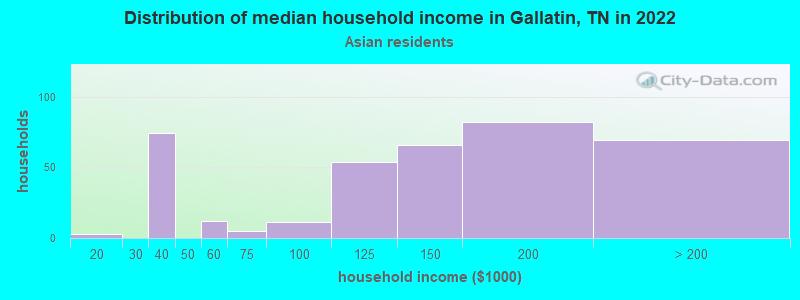
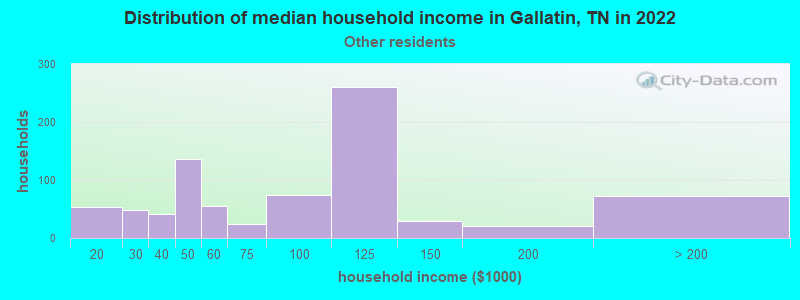
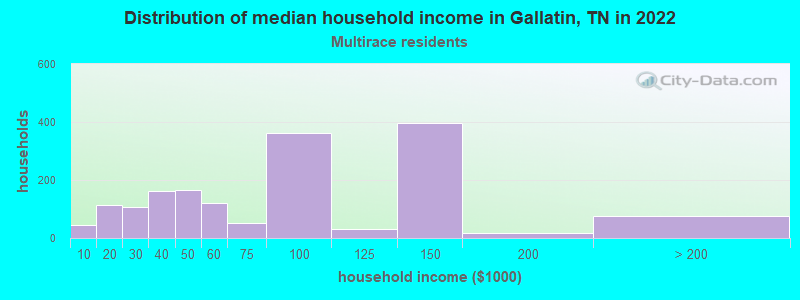
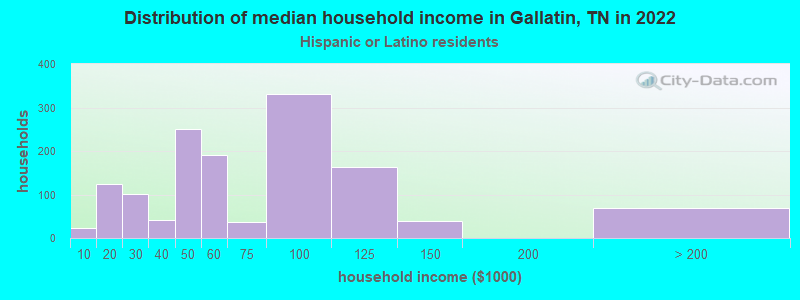
According to 2022 data, the most numerous races in Gallatin, TN are White alone (31,047 residents), Black alone (7,410 residents), and Hispanic (4,780 residents). 90.7% of Gallatin residents speak English at home. 6.1% of Gallatin, TN residents are foreign-born (3.1% born in Latin America, 1.8% born in Asia), which is 17.5% greater than the foreign-born rate of 5.0% across the entire state of Tennessee.
Race distribution in Gallatin
2000 2022
4,505,930 79.2% White alone 928,204 16.3% Black alone 123,838 2.2% Hispanic 54,824 1.0% Two or more races 56,077 1.0% Asian alone 13,820 0.2% American Indian alone 4,780 0.08% Other race alone 1,810 0.03% Native Hawaiian and Other
5,070,026 71.9% White alone 1,089,738 15.5% Black alone 442,629 6.3% Hispanic 279,381 4.0% Two or more races 131,817 1.9% Asian alone 26,972 0.4% Other race alone 6,387 0.09% American Indian alone 4,389 0.06% Native Hawaiian and Other
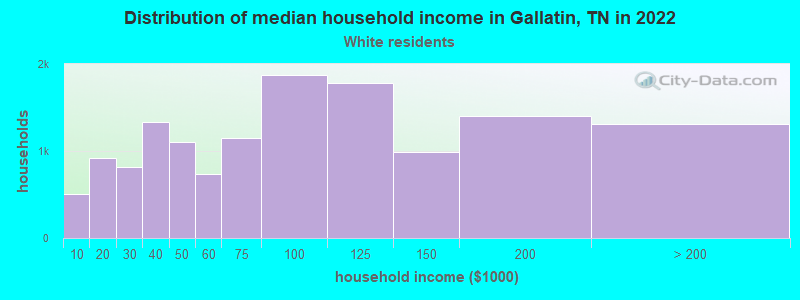
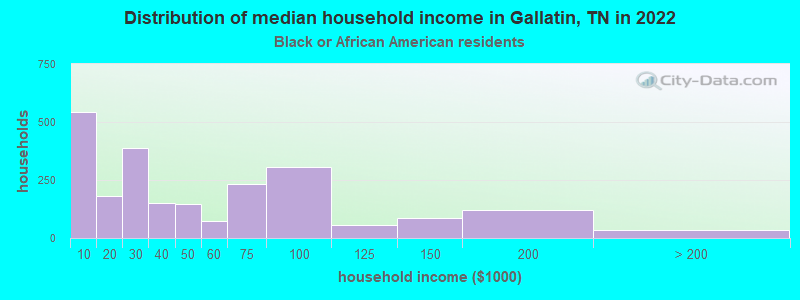
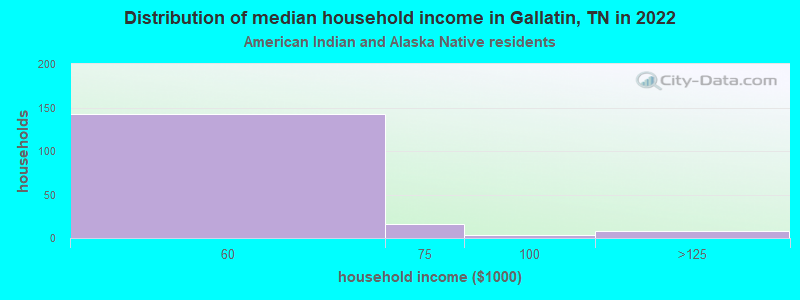
Income and house value in Gallatin Median household income in 2022 $77,734 White non-Hispanic householders$28,761 Black householders$52,641 American Indian and Alaska Native householdersover $200,000 Asian householders$126,289 Some other race householders$82,985 Two or more races householders$68,802 Hispanic or Latino race householdersMedian 2022 house value $405,830 White Non-Hispanic householders$265,379 Black or African American householders $345,953 Asian householders$415,809 Some other race householders$600,614 Two or more races householders$409,896 Hispanic or Latino householders
Median age by race in Gallatin
44.7 Median age for White residents44.8 45.4 24.7 Median age for Black or African American residents24.9 25.4 42.7 Median age for American Indian / Alaska Native residents51.6 59.4 37.4 Median age for Asian residents40.6 38.1 -885,813,147.9 Median age for Native Hawaiian / Pacific Islander residents-951,707,890.7 -735,930,735.2 24.3 Median age for Other race residents26.0 20.6 29.2 Median age for Two or more races residents28.0 33.0 44.9 Median age for White alone residents44.4 46.0 26.8 Median age for Hispanic or Latino residents26.5 26.7
Owner/renter occupied households by race in Gallatin
House owners and renters - White residents 9,490 66.7% Owner occupied4,740 33.3% Renter occupiedHouse owners and renters - Black or African American residents 945 38.4% Owner occupied1,519 61.6% Renter occupiedHouse owners and renters - American Indian / Alaska Native residents 14 14.9% Owner occupied82 85.1% Renter occupiedHouse owners and renters - Asian residents 155 45.6% Owner occupied185 54.4% Renter occupiedHouse owners and renters - Other race residents 358 36.0% Owner occupied637 64.0% Renter occupiedHouse owners and renters - Two or more races residents 650 63.9% Owner occupied367 36.1% Renter occupiedHouse owners and renters - White alone residents 9,367 66.4% Owner occupied4,733 33.6% Renter occupiedHouse owners and renters - Hispanic or Latino residents 637 42.3% Owner occupied868 57.7% Renter occupied
Language usage in Gallatin
English speakers - Total 90.7% of residents of Gallatin speak English at home.
6.8% of residents speak Spanish at home 2,076 69.5% Speak English very well911 30.5% Speak English less than very well3.6% of residents speak other language at home 999 62.8% Speak English very well592 37.2% Speak English less than very well
English speakers - Born in the United States 93.9% of residents of Gallatin speak English at home.
5.6% of residents speak Spanish at home 1,187 96.7% Speak English very well40 3.3% Speak English less than very well1.6% of residents speak other language at home 356 100.0% Speak English very well
English speakers - Native, born elsewhere 47.0% of residents of Gallatin speak English at home.
65.4% of residents speak Spanish at home 84 24.4% Speak English very well260 75.6% Speak English less than very well1.7% of residents speak other language at home 9 100.0% Speak English very well
English speakers - Foreign-born 22.5% of residents of Gallatin speak English at home.
37.9% of residents speak Spanish at home 351 36.4% Speak English very well613 63.6% Speak English less than very well46.9% of residents speak other language at home 609 51.0% Speak English very well584 49.0% Speak English less than very well
White (Caucasian) - Speak only English Native:
97.6% (29,343)Foreign-born:
68.3% (226)
White (Caucasian) - Speak another language Native:
2.4% (731)Foreign-born:
37.0% (123)
Black or African American - Speak only English Native:
98.0% (5,929)Foreign-born:
8.4% (21)
Black or African American - Speak another language Native:
2.0% (120)Foreign-born:
89.5% (220)
Asian - Speak only English Native:
78.9% (214)Foreign-born:
10.4% (75)
Asian - Speak another language Native:
19.8% (53)Foreign-born:
89.7% (644)
Other race - Speak only English Native:
46.4% (1,018)Foreign-born:
30.6% (117)
Other race - Speak another language Native:
53.4% (1,171)Foreign-born:
90.6% (347)
Two or more races - Speak only English Native:
89.6% (2,545)Foreign-born:
14.5% (108)
Two or more races - Speak another language Native:
10.3% (293)Foreign-born:
77.0% (576)
White alone - Speak only English Native:
98.5% (29,161)Foreign-born:
73.9% (170)
White alone - Speak another language Native:
1.5% (456)Foreign-born:
31.1% (72)
Hispanic or Latino - Speak only English Native:
48.2% (1,576)Foreign-born:
16.7% (178)
Hispanic or Latino - Speak another language Native:
52.8% (1,726)Foreign-born:
90.8% (968)
Foreign-born residents in Gallatin 2,821 residents are foreign born (3.1% Latin America , 1.8% Asia ).
This city:
6.1%Tennessee:
5.4%
Marital status for residents in Gallatin Marital status - White (Caucasian) population 15 years and over
Males 26.9% Never married57.9% Now married0.5% Separated4.4% Widowed10.3% DivorcedFemales 22.6% Never married52.0% Now married0.5% Separated10.1% Widowed14.8% DivorcedWomen who gave birth in the past 12 months Now married:
66.3% (217)Unmarried:
33.7% (110)
Women who did not give birth in the past 12 months Now married:
46.9% (3,052)Unmarried:
53.1% (3,451)
Marital status - Black or African American population 15 years and over
Males 59.4% Never married26.1% Now married1.8% Separated5.8% Widowed6.9% DivorcedFemales 40.8% Never married20.4% Now married1.8% Separated9.0% Widowed27.9% DivorcedWomen who gave birth in the past 12 months Now married:
77.9% (93)Unmarried:
22.1% (26)
Women who did not give birth in the past 12 months Now married:
16.3% (382)Unmarried:
83.7% (1,962)
Marital status - American Indian / Alaska Native population 15 years and over
Males 20.2% Never married58.8% Now married0.0% Separated0.0% Widowed21.1% DivorcedFemales 0.0% Never married73.9% Now married0.0% Separated0.0% Widowed26.1% DivorcedWomen who did not give birth in the past 12 months Now married:
68.4% (15)Unmarried:
31.6% (7)
Marital status - Asian population 15 years and over
Males 23.0% Never married69.9% Now married0.0% Separated7.2% Widowed0.0% DivorcedFemales 16.7% Never married66.4% Now married0.0% Separated13.6% Widowed3.3% DivorcedWomen who gave birth in the past 12 months Now married:
100.0% (28)Unmarried:
0.0% (0)
Women who did not give birth in the past 12 months Now married:
74.7% (213)Unmarried:
25.3% (72)
Marital status - Other race population 15 years and over
Males 67.0% Never married24.5% Now married0.0% Separated0.0% Widowed8.5% DivorcedFemales 63.7% Never married33.8% Now married0.0% Separated0.0% Widowed2.5% DivorcedWomen who gave birth in the past 12 months Now married:
0.0% (0)Unmarried:
100.0% (141)
Women who did not give birth in the past 12 months Now married:
28.8% (131)Unmarried:
71.2% (324)
Marital status - Two or more races population 15 years and over
Males 58.8% Never married39.2% Now married0.0% Separated0.6% Widowed1.4% DivorcedFemales 37.2% Never married55.3% Now married1.3% Separated0.6% Widowed5.6% DivorcedWomen who gave birth in the past 12 months Now married:
20.0% (30)Unmarried:
80.0% (119)
Women who did not give birth in the past 12 months Now married:
35.4% (253)Unmarried:
64.6% (462)
Marital status - White alone, not Hispanic / Latino population 15 years and over
Males 26.8% Never married57.8% Now married0.6% Separated4.4% Widowed10.4% DivorcedFemales 21.8% Never married52.4% Now married0.5% Separated10.4% Widowed15.0% DivorcedWomen who gave birth in the past 12 months Now married:
67.1% (207)Unmarried:
32.9% (101)
Women who did not give birth in the past 12 months Now married:
47.5% (2,981)Unmarried:
52.5% (3,291)
Marital status - Hispanic or Latino population 15 years and over
Males 63.3% Never married30.2% Now married0.0% Separated1.1% Widowed5.5% DivorcedFemales 53.2% Never married39.4% Now married1.2% Separated1.6% Widowed4.5% DivorcedWomen who gave birth in the past 12 months Now married:
8.6% (14)Unmarried:
91.4% (147)
Women who did not give birth in the past 12 months Now married:
36.4% (351)Unmarried:
63.6% (615)
Ancestries in Gallatin
5,345 21.7% American2,930 11.9% English1,523 6.2% Irish1,305 5.3% German808 3.3% European392 1.6% Italian329 1.3% Scottish290 1.2% French218 0.9% Scotch-Irish159 0.6% African124 0.5% Ghanaian91 0.4% British89 0.4% Norwegian89 0.4% Eastern European89 0.4% Albanian75 0.3% Polish69 0.3% Greek67 0.3% Swedish66 0.3% Scandinavian58 0.2% French Canadian40 0.2% Pennsylvania German34 0.1% Russian33 0.1% Dutch31 0.1% Danish24 0.10% Northern European24 0.10% Swiss21 0.09% Belizean16 0.06% Czech15 0.06% Slovak11 0.04% Welsh10 0.04% Hungarian8 0.03% Celtic6 0.02% Nigerian6 0.02% Finnish
Geographical mobility in Gallatin Same house 1 year ago 26,062 83.1% White (Caucasian)6,777 87.1% Black or African American95 63.6% American Indian / Alaska Native913 84.1% Asian1,775 69.5% Other race3,085 83.9% Two or more races25,515 82.9% White alone, not Hispanic / Latino3,505 79.1% Hispanic or LatinoMoved within same county 2,774 8.8% White / Caucasian171 2.2% Black or African American37 25.0% American Indian / Alaska Native214 8.4% Other race233 6.3% Two or more races2,787 9.1% White alone, not Hispanic / Latino143 3.2% Hispanic or LatinoMoved within same state 1,041 3.3% White / Caucasian154 2.0% Black or African American33 22.4% American Indian / Alaska Native38 3.5% Asian177 6.9% Other race30 0.8% Two or more races1,027 3.3% White alone, not Hispanic / Latino185 4.2% Hispanic or LatinoMoved from different state 1,458 4.7% White / Caucasian841 10.8% Black or African American47 4.4% Asian277 10.9% Other race517 14.1% Two or more races1,398 4.5% White alone, not Hispanic / Latino422 9.5% Hispanic or LatinoMoved from abroad 51 0.2% White136 12.6% Asian179 7.0% Other race14 0.4% Two or more races47 0.2% White alone, not Hispanic / Latino121 2.7% Hispanic or Latino
Children Nativity (place of birth) in Gallatin
Children under 6 years - Living with two parents Both parents native 1,646 98.5% Native25 1.5% Foreign-bornBoth parents foreign-born 311 81.8% Native69 18.2% Foreign-bornOne native, one foreign-born parent 49 100.0% NativeChildren under 6 years - Living with one parent Native parent 941 100.0% NativeForeign-born parent 82 100.0% NativeChildren 6 to 17 years - Living with two parents Both parents native 2,972 99.8% Native5 0.2% Foreign-bornBoth parents foreign-born 520 71.4% Native208 28.6% Foreign-bornOne native, one foreign-born parent 146 98.4% Native2 1.6% Foreign-bornChildren 6 to 17 years - Living with one parent Native parent 2,506 100.0% NativeForeign-born parent 251 52.9% Native223 47.1% Foreign-born
Grandparents responsible for own grandchildren in Gallatin
Grandparents (30 to 59 years) White / Caucasian 105 60.9% Responsible for grandchildren68 39.1% Not responsible for grandchildrenBlack or African American 25 100.0% Not responsible for grandchildrenOther race 38 100.0% Not responsible for grandchildrenTwo or more races 57 100.0% Not responsible for grandchildrenWhite alone, not Hispanic / Latino 105 60.9% Responsible for grandchildren68 39.1% Not responsible for grandchildrenHispanic or Latino 44 100.0% Not responsible for grandchildrenGrandparents (60 years and over) White / Caucasian 32 22.4% Responsible for grandchildren110 77.6% Not responsible for grandchildrenBlack or African American 20 100.0% Responsible for grandchildrenTwo or more races 18 100.0% Not responsible for grandchildrenWhite alone, not Hispanic / Latino 32 23.3% Responsible for grandchildren104 76.7% Not responsible for grandchildrenHispanic or Latino 11 100.0% Not responsible for grandchildren