Races in Fremont, Nebraska (NE) Detailed Stats
Data:
Races - White alone (%)
Races - White alone (% change since 2000)
Races - Black alone (%)
Races - Black alone (% change since 2000)
Races - American Indian alone (%)
Races - American Indian alone (% change since 2000)
Races - Asian alone (%)
Races - Asian alone (% change since 2000)
Races - Hispanic (%)
Races - Hispanic (% change since 2000)
Races - Native Hawaiian and Other Pacific Islander alone (%)
Races - Native Hawaiian and Other Pacific Islander alone (% change since 2000)
Races - Two or more races(%)
Races - Two or more races(% change since 2000)
Races - Other race alone (%)
Races - Other race alone (% change since 2000)
Racial diversity
Place of birth - Born in state of residence (%)
Place of birth - Born in state of residence (%) - White
Place of birth - Born in state of residence (%) - Black or African American
Place of birth - Born in state of residence (%) - Asian
Place of birth - Born in state of residence (%) - Hispanic or Latino
Place of birth - Born in state of residence (%) - American Indian and Alaska Native
Place of birth - Born in state of residence (%) - Multirace
Place of birth - Born in state of residence (%) - Other Race
Place of birth - Born in other state (%)
Place of birth - Born in other state (%) - White
Place of birth - Born in other state (%) - Black or African American
Place of birth - Born in other state (%) - Asian
Place of birth - Born in other state (%) - Hispanic or Latino
Place of birth - Born in other state (%) - American Indian and Alaska Native
Place of birth - Born in other state (%) - Multirace
Place of birth - Born in other state (%) - Other Race
Place of birth - Native, outside of US (%)
Place of birth - Native, outside of US (%) - White
Place of birth - Native, outside of US (%) - Black or African American
Place of birth - Native, outside of US (%) - Asian
Place of birth - Native, outside of US (%) - Hispanic or Latino
Place of birth - Native, outside of US (%) - American Indian and Alaska Native
Place of birth - Native, outside of US (%) - Multirace
Place of birth - Native, outside of US (%) - Other Race
Place of birth - Foreign born (%)
Place of birth - Foreign born (%) - White
Place of birth - Foreign born (%) - Black or African American
Place of birth - Foreign born (%) - Asian
Place of birth - Foreign born (%) - Hispanic or Latino
Place of birth - Foreign born (%) - American Indian and Alaska Native
Place of birth - Foreign born (%) - Multirace
Place of birth - Foreign born (%) - Other Race
Residents speaking English at home (%)
Residents speaking English at home - Born in the United States (%)
Residents speaking English at home - Native, born elsewhere (%)
Residents speaking English at home - Foreign born (%)
Residents speaking Spanish at home (%)
Residents speaking Spanish at home - Born in the United States (%)
Residents speaking Spanish at home - Native, born elsewhere (%)
Residents speaking Spanish at home - Foreign born (%)
Residents speaking other language at home (%)
Residents speaking other language at home - Born in the United States (%)
Residents speaking other language at home - Native, born elsewhere (%)
Residents speaking other language at home - Foreign born (%)
Marital status - Never married (%)
Marital status - Now married (%)
Marital status - Separated (%)
Marital status - Widowed (%)
Marital status - Divorced (%)
Ancestries Reported - Arab (%)
Ancestries Reported - Czech (%)
Ancestries Reported - Danish (%)
Ancestries Reported - Dutch (%)
Ancestries Reported - English (%)
Ancestries Reported - French (%)
Ancestries Reported - French Canadian (%)
Ancestries Reported - German (%)
Ancestries Reported - Greek (%)
Ancestries Reported - Hungarian (%)
Ancestries Reported - Irish (%)
Ancestries Reported - Italian (%)
Ancestries Reported - Lithuanian (%)
Ancestries Reported - Norwegian (%)
Ancestries Reported - Polish (%)
Ancestries Reported - Portuguese (%)
Ancestries Reported - Russian (%)
Ancestries Reported - Scotch-Irish (%)
Ancestries Reported - Scottish (%)
Ancestries Reported - Slovak (%)
Ancestries Reported - Subsaharan African (%)
Ancestries Reported - Swedish (%)
Ancestries Reported - Swiss (%)
Ancestries Reported - Ukrainian (%)
Ancestries Reported - United States (%)
Ancestries Reported - Welsh (%)
Ancestries Reported - West Indian (%)
Ancestries Reported - Other (%)
Geographical mobility - Same house 1 year ago (%)
Geographical mobility - Same house 1 year ago (%) - White
Geographical mobility - Same house 1 year ago (%) - Black or African American
Geographical mobility - Same house 1 year ago (%) - Asian
Geographical mobility - Same house 1 year ago (%) - Hispanic or Latino
Geographical mobility - Same house 1 year ago (%) - American Indian and Alaska Native
Geographical mobility - Same house 1 year ago (%) - Multirace
Geographical mobility - Same house 1 year ago (%) - Other Race
Geographical mobility - Moved within same county (%)
Geographical mobility - Moved within same county (%) - White
Geographical mobility - Moved within same county (%) - Black or African American
Geographical mobility - Moved within same county (%) - Asian
Geographical mobility - Moved within same county (%) - Hispanic or Latino
Geographical mobility - Moved within same county (%) - American Indian and Alaska Native
Geographical mobility - Moved within same county (%) - Multirace
Geographical mobility - Moved within same county (%) - Other Race
Geographical mobility - Moved from different county within same state (%)
Geographical mobility - Moved from different county within same state (%) - White
Geographical mobility - Moved from different county within same state (%) - Black or African American
Geographical mobility - Moved from different county within same state (%) - Asian
Geographical mobility - Moved from different county within same state (%) - Hispanic or Latino
Geographical mobility - Moved from different county within same state (%) - American Indian and Alaska Native
Geographical mobility - Moved from different county within same state (%) - Multirace
Geographical mobility - Moved from different county within same state (%) - Other Race
Geographical mobility - Moved from different state (%)
Geographical mobility - Moved from different state (%) - White
Geographical mobility - Moved from different state (%) - Black or African American
Geographical mobility - Moved from different state (%) - Asian
Geographical mobility - Moved from different state (%) - Hispanic or Latino
Geographical mobility - Moved from different state (%) - American Indian and Alaska Native
Geographical mobility - Moved from different state (%) - Multirace
Geographical mobility - Moved from different state (%) - Other Race
Geographical mobility - Moved from abroad (%)
Geographical mobility - Moved from abroad (%) - White
Geographical mobility - Moved from abroad (%) - Black or African American
Geographical mobility - Moved from abroad (%) - Asian
Geographical mobility - Moved from abroad (%) - Hispanic or Latino
Geographical mobility - Moved from abroad (%) - American Indian and Alaska Native
Geographical mobility - Moved from abroad (%) - Multirace
Geographical mobility - Moved from abroad (%) - Other Race
Place of birth for the foreign-born population - Ireland (%)
Place of birth for the foreign-born population - Denmark (%)
Place of birth for the foreign-born population - Norway (%)
Place of birth for the foreign-born population - Sweden (%)
Place of birth for the foreign-born population - United Kingdom (%)
Place of birth for the foreign-born population - England (%)
Place of birth for the foreign-born population - Scotland (%)
Place of birth for the foreign-born population - Other Northern Europe (%)
Place of birth for the foreign-born population - Austria (%)
Place of birth for the foreign-born population - Belgium (%)
Place of birth for the foreign-born population - France (%)
Place of birth for the foreign-born population - Germany (%)
Place of birth for the foreign-born population - Netherlands (%)
Place of birth for the foreign-born population - Switzerland (%)
Place of birth for the foreign-born population - Other Western Europe (%)
Place of birth for the foreign-born population - Greece (%)
Place of birth for the foreign-born population - Italy (%)
Place of birth for the foreign-born population - Portugal (%)
Place of birth for the foreign-born population - Spain (%)
Place of birth for the foreign-born population - Other Southern Europe (%)
Place of birth for the foreign-born population - Albania (%)
Place of birth for the foreign-born population - Belarus (%)
Place of birth for the foreign-born population - Bosnia and Herzegovina (%)
Place of birth for the foreign-born population - Bulgaria (%)
Place of birth for the foreign-born population - Croatia (%)
Place of birth for the foreign-born population - Czechoslovakia (%)
Place of birth for the foreign-born population - Hungary (%)
Place of birth for the foreign-born population - Latvia (%)
Place of birth for the foreign-born population - Lithuania (%)
Place of birth for the foreign-born population - North Macedonia (Macedonia) (%)
Place of birth for the foreign-born population - Moldova (%)
Place of birth for the foreign-born population - Poland (%)
Place of birth for the foreign-born population - Romania (%)
Place of birth for the foreign-born population - Russia (%)
Place of birth for the foreign-born population - Serbia (%)
Place of birth for the foreign-born population - Ukraine (%)
Place of birth for the foreign-born population - Other Eastern Europe (%)
Place of birth for the foreign-born population - China (%)
Place of birth for the foreign-born population - Hong Kong (%)
Place of birth for the foreign-born population - Taiwan (%)
Place of birth for the foreign-born population - Japan (%)
Place of birth for the foreign-born population - Korea (%)
Place of birth for the foreign-born population - Other Eastern Asia (%)
Place of birth for the foreign-born population - Afghanistan (%)
Place of birth for the foreign-born population - Bangladesh (%)
Place of birth for the foreign-born population - India (%)
Place of birth for the foreign-born population - Iran (%)
Place of birth for the foreign-born population - Kazakhstan (%)
Place of birth for the foreign-born population - Nepal (%)
Place of birth for the foreign-born population - Pakistan (%)
Place of birth for the foreign-born population - Sri Lanka (%)
Place of birth for the foreign-born population - Uzbekistan (%)
Place of birth for the foreign-born population - Other South Central Asia (%)
Place of birth for the foreign-born population - Burma (%)
Place of birth for the foreign-born population - Cambodia (%)
Place of birth for the foreign-born population - Indonesia (%)
Place of birth for the foreign-born population - Laos (%)
Place of birth for the foreign-born population - Malaysia (%)
Place of birth for the foreign-born population - Philippines (%)
Place of birth for the foreign-born population - Singapore (%)
Place of birth for the foreign-born population - Thailand (%)
Place of birth for the foreign-born population - Vietnam (%)
Place of birth for the foreign-born population - Other South Eastern Asia (%)
Place of birth for the foreign-born population - Armenia (%)
Place of birth for the foreign-born population - Iraq (%)
Place of birth for the foreign-born population - Israel (%)
Place of birth for the foreign-born population - Jordan (%)
Place of birth for the foreign-born population - Kuwait (%)
Place of birth for the foreign-born population - Lebanon (%)
Place of birth for the foreign-born population - Saudi Arabia (%)
Place of birth for the foreign-born population - Syria (%)
Place of birth for the foreign-born population - Turkey (%)
Place of birth for the foreign-born population - Yemen (%)
Place of birth for the foreign-born population - Other Western Asia (%)
Place of birth for the foreign-born population - Eritrea (%)
Place of birth for the foreign-born population - Ethiopia (%)
Place of birth for the foreign-born population - Kenya (%)
Place of birth for the foreign-born population - Somalia (%)
Place of birth for the foreign-born population - Uganda (%)
Place of birth for the foreign-born population - Zimbabwe (%)
Place of birth for the foreign-born population - Other Eastern Africa (%)
Place of birth for the foreign-born population - Cameroon (%)
Place of birth for the foreign-born population - Congo (%)
Place of birth for the foreign-born population - Democratic Republic of Congo (Zaire) (%)
Place of birth for the foreign-born population - Other Middle Africa (%)
Place of birth for the foreign-born population - Egypt (%)
Place of birth for the foreign-born population - Morocco (%)
Place of birth for the foreign-born population - Sudan (%)
Place of birth for the foreign-born population - Other Northern Africa (%)
Place of birth for the foreign-born population - South Africa (%)
Place of birth for the foreign-born population - Other Southern Africa (%)
Place of birth for the foreign-born population - Cabo Verde (%)
Place of birth for the foreign-born population - Ghana (%)
Place of birth for the foreign-born population - Liberia (%)
Place of birth for the foreign-born population - Nigeria (%)
Place of birth for the foreign-born population - Senegal (%)
Place of birth for the foreign-born population - Sierra Leone (%)
Place of birth for the foreign-born population - Other Western Africa (%)
Place of birth for the foreign-born population - Australia (%)
Place of birth for the foreign-born population - New Zealand (%)
Place of birth for the foreign-born population - Fiji (%)
Place of birth for the foreign-born population - Micronesia (%)
Place of birth for the foreign-born population - Bahamas (%)
Place of birth for the foreign-born population - Barbados (%)
Place of birth for the foreign-born population - Cuba (%)
Place of birth for the foreign-born population - Dominica (%)
Place of birth for the foreign-born population - Dominican Republic (%)
Place of birth for the foreign-born population - Grenada (%)
Place of birth for the foreign-born population - Haiti (%)
Place of birth for the foreign-born population - Jamaica (%)
Place of birth for the foreign-born population - St. Vincent and the Grenadines (%)
Place of birth for the foreign-born population - Trinidad and Tobago (%)
Place of birth for the foreign-born population - West Indies (%)
Place of birth for the foreign-born population - Other Caribbean (%)
Place of birth for the foreign-born population - Belize (%)
Place of birth for the foreign-born population - Costa Rica (%)
Place of birth for the foreign-born population - El Salvador (%)
Place of birth for the foreign-born population - Guatemala (%)
Place of birth for the foreign-born population - Honduras (%)
Place of birth for the foreign-born population - Mexico (%)
Place of birth for the foreign-born population - Nicaragua (%)
Place of birth for the foreign-born population - Panama (%)
Place of birth for the foreign-born population - Other Central America (%)
Place of birth for the foreign-born population - Argentina (%)
Place of birth for the foreign-born population - Bolivia (%)
Place of birth for the foreign-born population - Brazil (%)
Place of birth for the foreign-born population - Chile (%)
Place of birth for the foreign-born population - Colombia (%)
Place of birth for the foreign-born population - Ecuador (%)
Place of birth for the foreign-born population - Guyana (%)
Place of birth for the foreign-born population - Peru (%)
Place of birth for the foreign-born population - Uruguay (%)
Place of birth for the foreign-born population - Venezuela (%)
Place of birth for the foreign-born population - Other South America (%)
Place of birth for the foreign-born population - Canada (%)
Place of birth for the foreign-born population - Other Northern America (%)
Place of birth for the foreign-born population - Other (%)
Latest news about races in Fremont, NE collected exclusively by city-data.com from local newspapers, TV, and radio stations
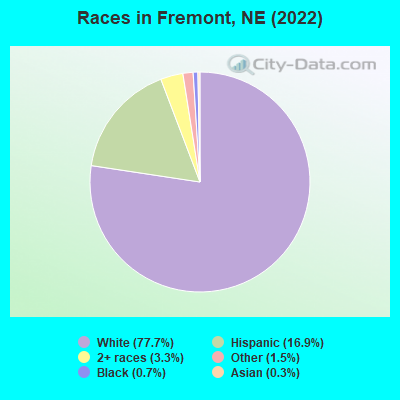
According to 2022 data, the most numerous races in Fremont, NE are White alone (21,261 residents), Hispanic (4,635 residents), and Black alone (183 residents). 86.6% of Fremont residents speak English at home. 6.4% of Fremont, NE residents are foreign-born (5.4% born in Latin America), which is 8.9% less than the foreign-born rate of 7.0% across the entire state of Nebraska.
Race distribution in Fremont
2000 2022
1,494,494 87.3% White alone 94,425 5.5% Hispanic 67,537 3.9% Black alone 21,677 1.3% Asian alone 17,696 1.0% Two or more races 13,460 0.8% American Indian alone 1,327 0.08% Other race alone 647 0.04% Native Hawaiian and Other
1,492,005 75.8% White alone 241,898 12.3% Hispanic 89,520 4.5% Black alone 76,499 3.9% Two or more races 49,261 2.5% Asian alone 10,249 0.5% American Indian alone 7,425 0.4% Other race alone 1,066 0.05% Native Hawaiian and Other
Income and house value in Fremont Median household income in 2022 $58,416 White non-Hispanic householders$34,622 Black householders$77,496 Some other race householders$92,201 Two or more races householders$80,387 Hispanic or Latino race householdersMedian 2022 house value $200,821 White Non-Hispanic householders$103,516 Black or African American householders$88,793 American Indian or Alaska Native householders$181,958 Some other race householders$318,830 Two or more races householders$182,878 Hispanic or Latino householders
Median age by race in Fremont
41.4 Median age for White residents39.6 43.3 42.1 Median age for Black or African American residents38.8 48.2 12.8 Median age for American Indian / Alaska Native residents10.2 19.0 65.4 Median age for Asian residents-708,061,001.5 -691,206,543.3 -699,999,999.3 Median age for Native Hawaiian / Pacific Islander residents-672,108,842.9 -689,223,057.0 32.0 Median age for Other race residents32.1 26.2 18.1 Median age for Two or more races residents21.1 12.7 43.3 Median age for White alone residents41.4 46.3 21.2 Median age for Hispanic or Latino residents21.3 20.9
Owner/renter occupied households by race in Fremont
House owners and renters - White residents 6,068 61.4% Owner occupied3,809 38.6% Renter occupiedHouse owners and renters - Black or African American residents 93 100.0% Renter occupiedHouse owners and renters - American Indian / Alaska Native residents 100 100.0% Renter occupiedHouse owners and renters - Asian residents 80 100.0% Renter occupiedHouse owners and renters - Other race residents 166 73.9% Owner occupied59 26.1% Renter occupiedHouse owners and renters - Two or more races residents 406 55.2% Owner occupied330 44.8% Renter occupiedHouse owners and renters - White alone residents 5,778 60.9% Owner occupied3,703 39.1% Renter occupiedHouse owners and renters - Hispanic or Latino residents 652 59.3% Owner occupied447 40.7% Renter occupied
Language usage in Fremont
English speakers - Total 86.6% of residents of Fremont speak English at home.
11.9% of residents speak Spanish at home 1,807 59.3% Speak English very well1,238 40.7% Speak English less than very well1.1% of residents speak other language at home 98 34.6% Speak English very well185 65.4% Speak English less than very well
English speakers - Born in the United States 86.9% of residents of Fremont speak English at home.
11.7% of residents speak Spanish at home 644 89.8% Speak English very well73 10.2% Speak English less than very well0.7% of residents speak other language at home 40 100.0% Speak English very well
English speakers - Native, born elsewhere 50.9% of residents of Fremont speak English at home.
50.9% of residents speak Spanish at home 117 100.0% Speak English very well
English speakers - Foreign-born 8.5% of residents of Fremont speak English at home.
78.6% of residents speak Spanish at home 253 19.2% Speak English very well1,065 80.8% Speak English less than very well12.8% of residents speak other language at home 39 18.1% Speak English very well176 81.9% Speak English less than very well
White (Caucasian) - Speak only English Native:
96.0% (20,382)Foreign-born:
11.2% (60)
White (Caucasian) - Speak another language Native:
3.5% (737)Foreign-born:
83.9% (447)
American Indian / Alaska Native - Speak another language Native:
100.0% (269)Foreign-born:
100.0% (254)
Asian - Speak another language Native:
91.6% (15)Foreign-born:
1.3% (1)
Other race - Speak only English Native:
63.2% (386)Foreign-born:
2.7% (10)
Other race - Speak another language Native:
40.7% (248)Foreign-born:
98.2% (357)
Two or more races - Speak another language Native:
33.4% (530)Foreign-born:
100.0% (300)
White alone - Speak only English Native:
98.9% (19,986)Foreign-born:
88.1% (49)
Hispanic or Latino - Speak only English Native:
32.2% (784)Foreign-born:
1.6% (23)
Hispanic or Latino - Speak another language Native:
60.4% (1,474)Foreign-born:
99.0% (1,449)
Foreign-born residents in Fremont 1,758 residents are foreign born (5.4% Latin America ).
This city:
6.4%Nebraska:
7.5%
Marital status for residents in Fremont Marital status - White (Caucasian) population 15 years and over
Males 33.4% Never married52.7% Now married0.8% Separated2.7% Widowed10.4% DivorcedFemales 26.3% Never married44.7% Now married1.1% Separated12.4% Widowed15.6% DivorcedWomen who gave birth in the past 12 months Now married:
60.5% (172)Unmarried:
39.5% (112)
Women who did not give birth in the past 12 months Now married:
42.0% (1,918)Unmarried:
58.0% (2,651)
Marital status - Black or African American population 15 years and over
Males 53.6% Never married37.1% Now married0.0% Separated0.0% Widowed9.3% DivorcedFemales 0.0% Never married35.6% Now married0.0% Separated0.0% Widowed64.4% DivorcedWomen who did not give birth in the past 12 months Now married:
24.7% (19)Unmarried:
75.3% (57)
Marital status - American Indian / Alaska Native population 15 years and over
Males 100.0% Never married0.0% Now married0.0% Separated0.0% Widowed0.0% DivorcedFemales 85.0% Never married15.0% Now married0.0% Separated0.0% Widowed0.0% DivorcedWomen who did not give birth in the past 12 months Now married:
15.0% (21)Unmarried:
85.0% (120)
Marital status - Asian population 15 years and over
Males 0.0% Never married0.0% Now married0.0% Separated0.0% Widowed100.0% DivorcedFemales 100.0% Never married0.0% Now married0.0% Separated0.0% Widowed0.0% DivorcedWomen who did not give birth in the past 12 months Now married:
0.0% (0)Unmarried:
100.0% (14)
Marital status - Other race population 15 years and over
Males 35.6% Never married61.6% Now married0.0% Separated0.0% Widowed2.7% DivorcedFemales 19.9% Never married36.7% Now married0.0% Separated18.4% Widowed25.0% DivorcedWomen who gave birth in the past 12 months Now married:
0.0% (0)Unmarried:
100.0% (7)
Women who did not give birth in the past 12 months Now married:
60.0% (98)Unmarried:
40.0% (65)
Marital status - Two or more races population 15 years and over
Males 41.4% Never married52.5% Now married0.0% Separated0.0% Widowed6.1% DivorcedFemales 32.9% Never married59.1% Now married0.0% Separated0.9% Widowed7.1% DivorcedWomen who gave birth in the past 12 months Now married:
70.6% (34)Unmarried:
29.4% (14)
Women who did not give birth in the past 12 months Now married:
46.1% (162)Unmarried:
53.9% (190)
Marital status - White alone, not Hispanic / Latino population 15 years and over
Males 33.0% Never married52.4% Now married0.8% Separated3.0% Widowed10.9% DivorcedFemales 25.1% Never married44.9% Now married1.2% Separated12.8% Widowed16.0% DivorcedWomen who gave birth in the past 12 months Now married:
61.6% (177)Unmarried:
38.4% (110)
Women who did not give birth in the past 12 months Now married:
41.5% (1,666)Unmarried:
58.5% (2,352)
Marital status - Hispanic or Latino population 15 years and over
Males 42.6% Never married54.3% Now married0.0% Separated0.0% Widowed3.0% DivorcedFemales 43.5% Never married36.7% Now married0.0% Separated7.9% Widowed11.9% DivorcedWomen who gave birth in the past 12 months Now married:
46.2% (19)Unmarried:
53.8% (22)
Women who did not give birth in the past 12 months Now married:
40.3% (438)Unmarried:
59.7% (648)
Ancestries in Fremont
3,964 34.0% German1,134 9.7% American694 5.9% Irish477 4.1% Czech365 3.1% Swedish363 3.1% English271 2.3% Norwegian223 1.9% Danish142 1.2% Italian119 1.0% European118 1.0% Scottish94 0.8% French74 0.6% Polish54 0.5% Welsh53 0.5% Scotch-Irish49 0.4% Brazilian43 0.4% Kenyan30 0.3% Sudanese30 0.3% African26 0.2% Northern European18 0.2% Nigerian17 0.1% Czechoslovakian17 0.1% Scandinavian11 0.09% Dutch11 0.09% French Canadian11 0.09% Pennsylvania German5 0.04% Greek
Geographical mobility in Fremont Same house 1 year ago 19,820 87.1% White (Caucasian)159 86.1% Black or African American552 100.0% American Indian / Alaska Native15 15.8% Asian1,088 97.8% Other race1,733 83.8% Two or more races18,351 87.3% White alone, not Hispanic / Latino3,876 88.2% Hispanic or LatinoMoved within same county 1,620 7.1% White / Caucasian1 0.3% Black or African American89 94.6% Asian9 0.8% Other race228 11.0% Two or more races1,425 6.8% White alone, not Hispanic / Latino365 8.3% Hispanic or LatinoMoved within same state 710 3.1% White / Caucasian9 4.7% Black or African American29 2.6% Other race20 1.0% Two or more races673 3.2% White alone, not Hispanic / Latino81 1.8% Hispanic or LatinoMoved from different state 499 2.2% White / Caucasian4 2.4% Black or African American19 1.7% Other race27 1.3% Two or more races472 2.2% White alone, not Hispanic / Latino48 1.1% Hispanic or LatinoMoved from abroad 48 0.2% White27 14.4% Black or African American56 0.3% White alone, not Hispanic / Latino
Children Nativity (place of birth) in Fremont
Children under 6 years - Living with two parents Both parents native 994 100.0% NativeBoth parents foreign-born 201 100.0% NativeOne native, one foreign-born parent 247 100.0% NativeChildren under 6 years - Living with one parent Native parent 428 100.0% NativeForeign-born parent 200 100.0% NativeChildren 6 to 17 years - Living with two parents Both parents native 2,004 100.0% Native0 0.0% Foreign-bornBoth parents foreign-born 364 91.9% Native32 8.1% Foreign-bornOne native, one foreign-born parent 37 100.0% NativeChildren 6 to 17 years - Living with one parent Native parent 1,236 100.0% NativeForeign-born parent 458 50.3% Native452 49.7% Foreign-born
Grandparents responsible for own grandchildren in Fremont
Grandparents (30 to 59 years) White / Caucasian 63 43.5% Responsible for grandchildren82 56.5% Not responsible for grandchildrenOther race 23 100.0% Responsible for grandchildrenWhite alone, not Hispanic / Latino 15 23.6% Responsible for grandchildren48 76.4% Not responsible for grandchildrenHispanic or Latino 103 100.0% Responsible for grandchildren
Grandparents (60 years and over) White / Caucasian 95 100.0% Not responsible for grandchildrenWhite alone, not Hispanic / Latino 66 100.0% Not responsible for grandchildrenHispanic or Latino 43 100.0% Not responsible for grandchildren