Races in Franklin, Tennessee (TN) Detailed Stats
Data:
Races - White alone (%)
Races - White alone (% change since 2000)
Races - Black alone (%)
Races - Black alone (% change since 2000)
Races - American Indian alone (%)
Races - American Indian alone (% change since 2000)
Races - Asian alone (%)
Races - Asian alone (% change since 2000)
Races - Hispanic (%)
Races - Hispanic (% change since 2000)
Races - Native Hawaiian and Other Pacific Islander alone (%)
Races - Native Hawaiian and Other Pacific Islander alone (% change since 2000)
Races - Two or more races(%)
Races - Two or more races(% change since 2000)
Races - Other race alone (%)
Races - Other race alone (% change since 2000)
Racial diversity
Place of birth - Born in state of residence (%)
Place of birth - Born in state of residence (%) - White
Place of birth - Born in state of residence (%) - Black or African American
Place of birth - Born in state of residence (%) - Asian
Place of birth - Born in state of residence (%) - Hispanic or Latino
Place of birth - Born in state of residence (%) - American Indian and Alaska Native
Place of birth - Born in state of residence (%) - Multirace
Place of birth - Born in state of residence (%) - Other Race
Place of birth - Born in other state (%)
Place of birth - Born in other state (%) - White
Place of birth - Born in other state (%) - Black or African American
Place of birth - Born in other state (%) - Asian
Place of birth - Born in other state (%) - Hispanic or Latino
Place of birth - Born in other state (%) - American Indian and Alaska Native
Place of birth - Born in other state (%) - Multirace
Place of birth - Born in other state (%) - Other Race
Place of birth - Native, outside of US (%)
Place of birth - Native, outside of US (%) - White
Place of birth - Native, outside of US (%) - Black or African American
Place of birth - Native, outside of US (%) - Asian
Place of birth - Native, outside of US (%) - Hispanic or Latino
Place of birth - Native, outside of US (%) - American Indian and Alaska Native
Place of birth - Native, outside of US (%) - Multirace
Place of birth - Native, outside of US (%) - Other Race
Place of birth - Foreign born (%)
Place of birth - Foreign born (%) - White
Place of birth - Foreign born (%) - Black or African American
Place of birth - Foreign born (%) - Asian
Place of birth - Foreign born (%) - Hispanic or Latino
Place of birth - Foreign born (%) - American Indian and Alaska Native
Place of birth - Foreign born (%) - Multirace
Place of birth - Foreign born (%) - Other Race
Residents speaking English at home (%)
Residents speaking English at home - Born in the United States (%)
Residents speaking English at home - Native, born elsewhere (%)
Residents speaking English at home - Foreign born (%)
Residents speaking Spanish at home (%)
Residents speaking Spanish at home - Born in the United States (%)
Residents speaking Spanish at home - Native, born elsewhere (%)
Residents speaking Spanish at home - Foreign born (%)
Residents speaking other language at home (%)
Residents speaking other language at home - Born in the United States (%)
Residents speaking other language at home - Native, born elsewhere (%)
Residents speaking other language at home - Foreign born (%)
Marital status - Never married (%)
Marital status - Now married (%)
Marital status - Separated (%)
Marital status - Widowed (%)
Marital status - Divorced (%)
Ancestries Reported - Arab (%)
Ancestries Reported - Czech (%)
Ancestries Reported - Danish (%)
Ancestries Reported - Dutch (%)
Ancestries Reported - English (%)
Ancestries Reported - French (%)
Ancestries Reported - French Canadian (%)
Ancestries Reported - German (%)
Ancestries Reported - Greek (%)
Ancestries Reported - Hungarian (%)
Ancestries Reported - Irish (%)
Ancestries Reported - Italian (%)
Ancestries Reported - Lithuanian (%)
Ancestries Reported - Norwegian (%)
Ancestries Reported - Polish (%)
Ancestries Reported - Portuguese (%)
Ancestries Reported - Russian (%)
Ancestries Reported - Scotch-Irish (%)
Ancestries Reported - Scottish (%)
Ancestries Reported - Slovak (%)
Ancestries Reported - Subsaharan African (%)
Ancestries Reported - Swedish (%)
Ancestries Reported - Swiss (%)
Ancestries Reported - Ukrainian (%)
Ancestries Reported - United States (%)
Ancestries Reported - Welsh (%)
Ancestries Reported - West Indian (%)
Ancestries Reported - Other (%)
Geographical mobility - Same house 1 year ago (%)
Geographical mobility - Same house 1 year ago (%) - White
Geographical mobility - Same house 1 year ago (%) - Black or African American
Geographical mobility - Same house 1 year ago (%) - Asian
Geographical mobility - Same house 1 year ago (%) - Hispanic or Latino
Geographical mobility - Same house 1 year ago (%) - American Indian and Alaska Native
Geographical mobility - Same house 1 year ago (%) - Multirace
Geographical mobility - Same house 1 year ago (%) - Other Race
Geographical mobility - Moved within same county (%)
Geographical mobility - Moved within same county (%) - White
Geographical mobility - Moved within same county (%) - Black or African American
Geographical mobility - Moved within same county (%) - Asian
Geographical mobility - Moved within same county (%) - Hispanic or Latino
Geographical mobility - Moved within same county (%) - American Indian and Alaska Native
Geographical mobility - Moved within same county (%) - Multirace
Geographical mobility - Moved within same county (%) - Other Race
Geographical mobility - Moved from different county within same state (%)
Geographical mobility - Moved from different county within same state (%) - White
Geographical mobility - Moved from different county within same state (%) - Black or African American
Geographical mobility - Moved from different county within same state (%) - Asian
Geographical mobility - Moved from different county within same state (%) - Hispanic or Latino
Geographical mobility - Moved from different county within same state (%) - American Indian and Alaska Native
Geographical mobility - Moved from different county within same state (%) - Multirace
Geographical mobility - Moved from different county within same state (%) - Other Race
Geographical mobility - Moved from different state (%)
Geographical mobility - Moved from different state (%) - White
Geographical mobility - Moved from different state (%) - Black or African American
Geographical mobility - Moved from different state (%) - Asian
Geographical mobility - Moved from different state (%) - Hispanic or Latino
Geographical mobility - Moved from different state (%) - American Indian and Alaska Native
Geographical mobility - Moved from different state (%) - Multirace
Geographical mobility - Moved from different state (%) - Other Race
Geographical mobility - Moved from abroad (%)
Geographical mobility - Moved from abroad (%) - White
Geographical mobility - Moved from abroad (%) - Black or African American
Geographical mobility - Moved from abroad (%) - Asian
Geographical mobility - Moved from abroad (%) - Hispanic or Latino
Geographical mobility - Moved from abroad (%) - American Indian and Alaska Native
Geographical mobility - Moved from abroad (%) - Multirace
Geographical mobility - Moved from abroad (%) - Other Race
Place of birth for the foreign-born population - Ireland (%)
Place of birth for the foreign-born population - Denmark (%)
Place of birth for the foreign-born population - Norway (%)
Place of birth for the foreign-born population - Sweden (%)
Place of birth for the foreign-born population - United Kingdom (%)
Place of birth for the foreign-born population - England (%)
Place of birth for the foreign-born population - Scotland (%)
Place of birth for the foreign-born population - Other Northern Europe (%)
Place of birth for the foreign-born population - Austria (%)
Place of birth for the foreign-born population - Belgium (%)
Place of birth for the foreign-born population - France (%)
Place of birth for the foreign-born population - Germany (%)
Place of birth for the foreign-born population - Netherlands (%)
Place of birth for the foreign-born population - Switzerland (%)
Place of birth for the foreign-born population - Other Western Europe (%)
Place of birth for the foreign-born population - Greece (%)
Place of birth for the foreign-born population - Italy (%)
Place of birth for the foreign-born population - Portugal (%)
Place of birth for the foreign-born population - Spain (%)
Place of birth for the foreign-born population - Other Southern Europe (%)
Place of birth for the foreign-born population - Albania (%)
Place of birth for the foreign-born population - Belarus (%)
Place of birth for the foreign-born population - Bosnia and Herzegovina (%)
Place of birth for the foreign-born population - Bulgaria (%)
Place of birth for the foreign-born population - Croatia (%)
Place of birth for the foreign-born population - Czechoslovakia (%)
Place of birth for the foreign-born population - Hungary (%)
Place of birth for the foreign-born population - Latvia (%)
Place of birth for the foreign-born population - Lithuania (%)
Place of birth for the foreign-born population - North Macedonia (Macedonia) (%)
Place of birth for the foreign-born population - Moldova (%)
Place of birth for the foreign-born population - Poland (%)
Place of birth for the foreign-born population - Romania (%)
Place of birth for the foreign-born population - Russia (%)
Place of birth for the foreign-born population - Serbia (%)
Place of birth for the foreign-born population - Ukraine (%)
Place of birth for the foreign-born population - Other Eastern Europe (%)
Place of birth for the foreign-born population - China (%)
Place of birth for the foreign-born population - Hong Kong (%)
Place of birth for the foreign-born population - Taiwan (%)
Place of birth for the foreign-born population - Japan (%)
Place of birth for the foreign-born population - Korea (%)
Place of birth for the foreign-born population - Other Eastern Asia (%)
Place of birth for the foreign-born population - Afghanistan (%)
Place of birth for the foreign-born population - Bangladesh (%)
Place of birth for the foreign-born population - India (%)
Place of birth for the foreign-born population - Iran (%)
Place of birth for the foreign-born population - Kazakhstan (%)
Place of birth for the foreign-born population - Nepal (%)
Place of birth for the foreign-born population - Pakistan (%)
Place of birth for the foreign-born population - Sri Lanka (%)
Place of birth for the foreign-born population - Uzbekistan (%)
Place of birth for the foreign-born population - Other South Central Asia (%)
Place of birth for the foreign-born population - Burma (%)
Place of birth for the foreign-born population - Cambodia (%)
Place of birth for the foreign-born population - Indonesia (%)
Place of birth for the foreign-born population - Laos (%)
Place of birth for the foreign-born population - Malaysia (%)
Place of birth for the foreign-born population - Philippines (%)
Place of birth for the foreign-born population - Singapore (%)
Place of birth for the foreign-born population - Thailand (%)
Place of birth for the foreign-born population - Vietnam (%)
Place of birth for the foreign-born population - Other South Eastern Asia (%)
Place of birth for the foreign-born population - Armenia (%)
Place of birth for the foreign-born population - Iraq (%)
Place of birth for the foreign-born population - Israel (%)
Place of birth for the foreign-born population - Jordan (%)
Place of birth for the foreign-born population - Kuwait (%)
Place of birth for the foreign-born population - Lebanon (%)
Place of birth for the foreign-born population - Saudi Arabia (%)
Place of birth for the foreign-born population - Syria (%)
Place of birth for the foreign-born population - Turkey (%)
Place of birth for the foreign-born population - Yemen (%)
Place of birth for the foreign-born population - Other Western Asia (%)
Place of birth for the foreign-born population - Eritrea (%)
Place of birth for the foreign-born population - Ethiopia (%)
Place of birth for the foreign-born population - Kenya (%)
Place of birth for the foreign-born population - Somalia (%)
Place of birth for the foreign-born population - Uganda (%)
Place of birth for the foreign-born population - Zimbabwe (%)
Place of birth for the foreign-born population - Other Eastern Africa (%)
Place of birth for the foreign-born population - Cameroon (%)
Place of birth for the foreign-born population - Congo (%)
Place of birth for the foreign-born population - Democratic Republic of Congo (Zaire) (%)
Place of birth for the foreign-born population - Other Middle Africa (%)
Place of birth for the foreign-born population - Egypt (%)
Place of birth for the foreign-born population - Morocco (%)
Place of birth for the foreign-born population - Sudan (%)
Place of birth for the foreign-born population - Other Northern Africa (%)
Place of birth for the foreign-born population - South Africa (%)
Place of birth for the foreign-born population - Other Southern Africa (%)
Place of birth for the foreign-born population - Cabo Verde (%)
Place of birth for the foreign-born population - Ghana (%)
Place of birth for the foreign-born population - Liberia (%)
Place of birth for the foreign-born population - Nigeria (%)
Place of birth for the foreign-born population - Senegal (%)
Place of birth for the foreign-born population - Sierra Leone (%)
Place of birth for the foreign-born population - Other Western Africa (%)
Place of birth for the foreign-born population - Australia (%)
Place of birth for the foreign-born population - New Zealand (%)
Place of birth for the foreign-born population - Fiji (%)
Place of birth for the foreign-born population - Micronesia (%)
Place of birth for the foreign-born population - Bahamas (%)
Place of birth for the foreign-born population - Barbados (%)
Place of birth for the foreign-born population - Cuba (%)
Place of birth for the foreign-born population - Dominica (%)
Place of birth for the foreign-born population - Dominican Republic (%)
Place of birth for the foreign-born population - Grenada (%)
Place of birth for the foreign-born population - Haiti (%)
Place of birth for the foreign-born population - Jamaica (%)
Place of birth for the foreign-born population - St. Vincent and the Grenadines (%)
Place of birth for the foreign-born population - Trinidad and Tobago (%)
Place of birth for the foreign-born population - West Indies (%)
Place of birth for the foreign-born population - Other Caribbean (%)
Place of birth for the foreign-born population - Belize (%)
Place of birth for the foreign-born population - Costa Rica (%)
Place of birth for the foreign-born population - El Salvador (%)
Place of birth for the foreign-born population - Guatemala (%)
Place of birth for the foreign-born population - Honduras (%)
Place of birth for the foreign-born population - Mexico (%)
Place of birth for the foreign-born population - Nicaragua (%)
Place of birth for the foreign-born population - Panama (%)
Place of birth for the foreign-born population - Other Central America (%)
Place of birth for the foreign-born population - Argentina (%)
Place of birth for the foreign-born population - Bolivia (%)
Place of birth for the foreign-born population - Brazil (%)
Place of birth for the foreign-born population - Chile (%)
Place of birth for the foreign-born population - Colombia (%)
Place of birth for the foreign-born population - Ecuador (%)
Place of birth for the foreign-born population - Guyana (%)
Place of birth for the foreign-born population - Peru (%)
Place of birth for the foreign-born population - Uruguay (%)
Place of birth for the foreign-born population - Venezuela (%)
Place of birth for the foreign-born population - Other South America (%)
Place of birth for the foreign-born population - Canada (%)
Place of birth for the foreign-born population - Other Northern America (%)
Place of birth for the foreign-born population - Other (%)
Latest news about races in Franklin, TN collected exclusively by city-data.com from local newspapers, TV, and radio stations
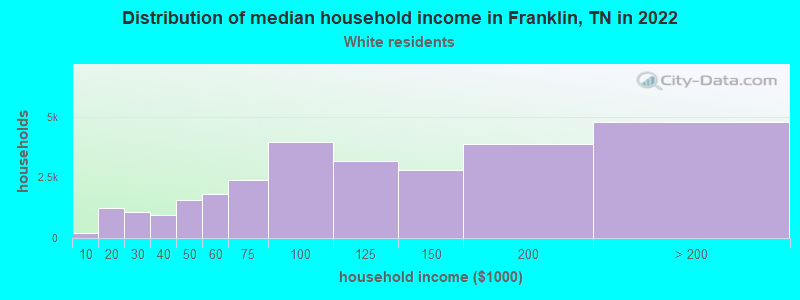
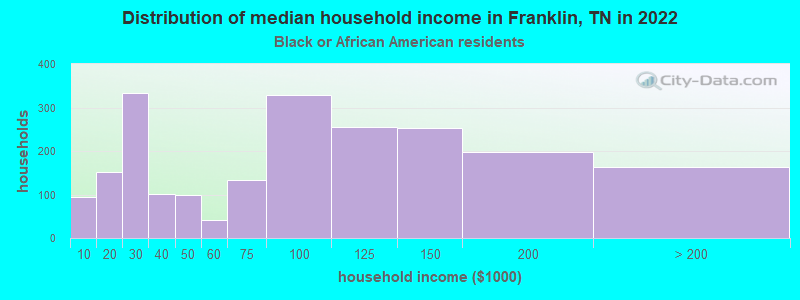
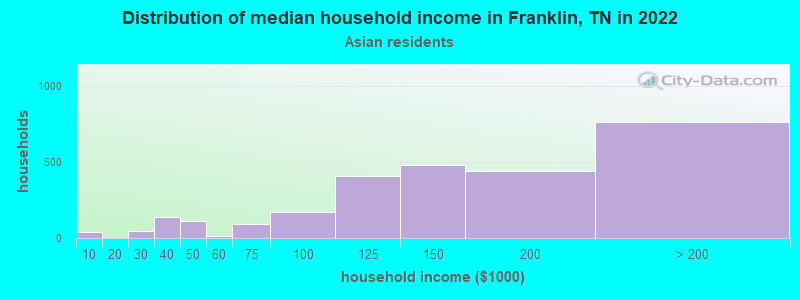
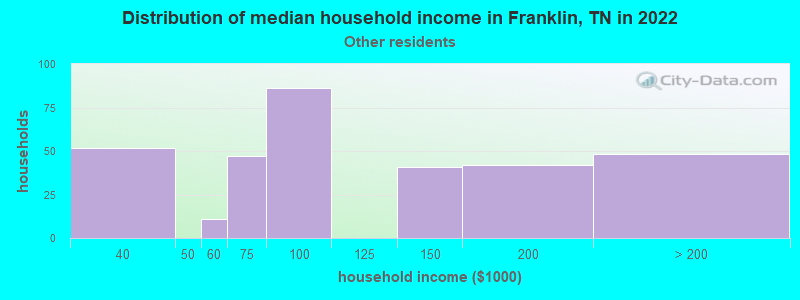
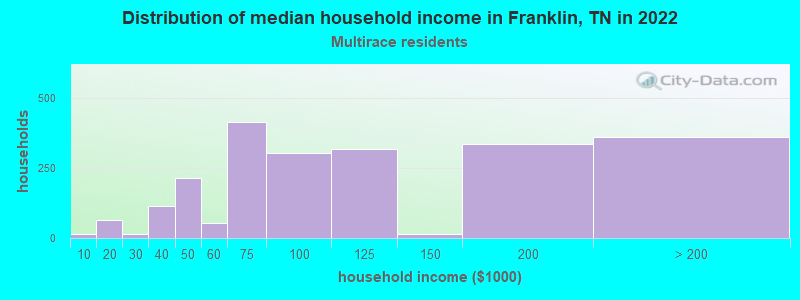
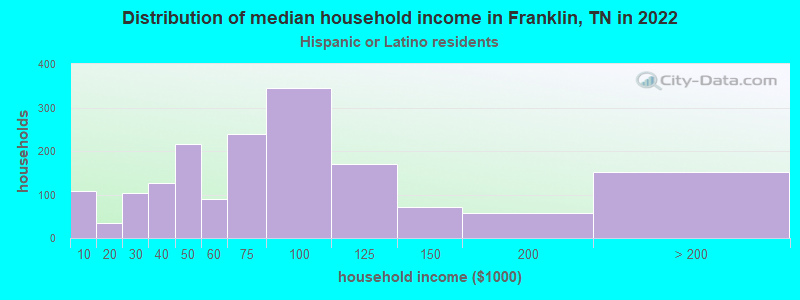
According to 2022 data, the most numerous races in Franklin, TN are White alone (65,366 residents), Black alone (5,597 residents), and Hispanic (5,287 residents). 89.9% of Franklin residents speak English at home. 11.6% of Franklin, TN residents are foreign-born (7.0% born in Asia, 2.9% born in Latin America, 1.2% born in Europe), which is 57.0% greater than the foreign-born rate of 5.0% across the entire state of Tennessee.
Race distribution in Franklin
2000 2022
4,505,930 79.2% White alone 928,204 16.3% Black alone 123,838 2.2% Hispanic 54,824 1.0% Two or more races 56,077 1.0% Asian alone 13,820 0.2% American Indian alone 4,780 0.08% Other race alone 1,810 0.03% Native Hawaiian and Other
5,070,026 71.9% White alone 1,089,738 15.5% Black alone 442,629 6.3% Hispanic 279,381 4.0% Two or more races 131,817 1.9% Asian alone 26,972 0.4% Other race alone 6,387 0.09% American Indian alone 4,389 0.06% Native Hawaiian and Other
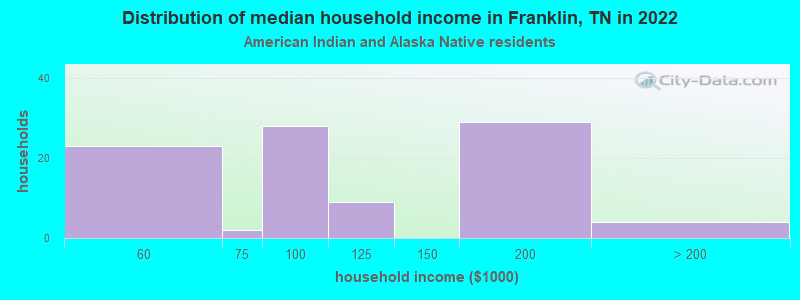
Income and house value in Franklin Median household income in 2022 $105,572 White non-Hispanic householders$91,586 Black householders$156,250 Asian householders$78,414 Some other race householders$121,904 Two or more races householders$78,974 Hispanic or Latino race householdersMedian 2022 house value $734,386 White Non-Hispanic householders$360,213 Black or African American householders$495,536 American Indian or Alaska Native householders $662,266 Asian householders$551,371 Some other race householders$727,019 Two or more races householders$639,389 Hispanic or Latino householders
Median age by race in Franklin
42.6 Median age for White residents41.2 44.1 28.0 Median age for Black or African American residents25.4 28.9 -666,666,666.0 Median age for American Indian / Alaska Native residents-666,666,666.0 -666,666,666.0 35.1 Median age for Asian residents28.8 38.7 -666,666,666.0 Median age for Native Hawaiian / Pacific Islander residents-666,666,666.0 -666,666,666.0 33.6 Median age for Other race residents45.3 33.4 36.4 Median age for Two or more races residents32.7 36.5 42.6 Median age for White alone residents41.2 44.2 37.0 Median age for Hispanic or Latino residents40.2 33.9
Owner/renter occupied households by race in Franklin
House owners and renters - White residents 18,277 65.7% Owner occupied9,563 34.3% Renter occupiedHouse owners and renters - Black or African American residents 1,581 81.9% Owner occupied350 18.1% Renter occupiedHouse owners and renters - American Indian / Alaska Native residents 24 29.4% Owner occupied56 70.6% Renter occupiedHouse owners and renters - Asian residents 630 30.4% Owner occupied1,445 69.6% Renter occupiedHouse owners and renters - Other race residents 135 30.4% Owner occupied310 69.6% Renter occupiedHouse owners and renters - Two or more races residents 935 51.3% Owner occupied887 48.7% Renter occupiedHouse owners and renters - White alone residents 18,028 65.5% Owner occupied9,495 34.5% Renter occupiedHouse owners and renters - Hispanic or Latino residents 530 34.8% Owner occupied991 65.2% Renter occupied
Language usage in Franklin
English speakers - Total 89.9% of residents of Franklin speak English at home.
3.5% of residents speak Spanish at home 1,777 60.9% Speak English very well1,140 39.1% Speak English less than very well6.6% of residents speak other language at home 4,357 78.2% Speak English very well1,212 21.8% Speak English less than very well
English speakers - Born in the United States 96.7% of residents of Franklin speak English at home.
0.8% of residents speak Spanish at home 364 100.0% Speak English very well2.5% of residents speak other language at home 1,089 92.9% Speak English very well83 7.1% Speak English less than very well
English speakers - Native, born elsewhere 86.5% of residents of Franklin speak English at home.
4.8% of residents speak Spanish at home 75 100.0% Speak English very well8.7% of residents speak other language at home 137 100.0% Speak English very well
English speakers - Foreign-born 23.4% of residents of Franklin speak English at home.
25.2% of residents speak Spanish at home 875 43.4% Speak English very well1,140 56.6% Speak English less than very well51.4% of residents speak other language at home 2,979 72.5% Speak English very well1,129 27.5% Speak English less than very well
White (Caucasian) - Speak only English Native:
98.5% (61,208)Foreign-born:
86.1% (1,365)
White (Caucasian) - Speak another language Native:
1.5% (931)Foreign-born:
13.9% (221)
Black or African American - Speak only English Native:
91.6% (4,244)Foreign-born:
97.5% (130)
Black or African American - Speak another language Native:
8.7% (405)Foreign-born:
7.5% (10)
American Indian / Alaska Native - Speak another language Native:
17.2% (11)Foreign-born:
100.0% (81)
Asian - Speak only English Native:
53.3% (904)Foreign-born:
8.8% (376)
Asian - Speak another language Native:
46.7% (791)Foreign-born:
91.2% (3,887)
Other race - Speak only English Native:
89.9% (371)Foreign-born:
12.5% (75)
Other race - Speak another language Native:
13.6% (56)Foreign-born:
84.4% (503)
Two or more races - Speak only English Native:
77.3% (3,598)Foreign-born:
15.4% (307)
Two or more races - Speak another language Native:
24.4% (1,138)Foreign-born:
93.4% (1,858)
White alone - Speak only English Native:
98.7% (60,779)Foreign-born:
85.0% (1,252)
White alone - Speak another language Native:
1.3% (817)Foreign-born:
15.0% (221)
Hispanic or Latino - Speak only English Native:
76.4% (1,732)Foreign-born:
10.6% (239)
Hispanic or Latino - Speak another language Native:
23.6% (535)Foreign-born:
89.4% (2,015)
Foreign-born residents in Franklin 10,179 residents are foreign born (7.0% Asia , 2.9% Latin America , 1.2% Europe ).
This city:
11.6%Tennessee:
5.4%
Marital status for residents in Franklin Marital status - White (Caucasian) population 15 years and over
Males 30.9% Never married59.7% Now married0.6% Separated2.6% Widowed6.2% DivorcedFemales 25.7% Never married53.2% Now married1.2% Separated8.4% Widowed11.5% DivorcedWomen who gave birth in the past 12 months Now married:
100.0% (311)Unmarried:
0.0% (0)
Women who did not give birth in the past 12 months Now married:
43.7% (6,957)Unmarried:
56.3% (8,954)
Marital status - Black or African American population 15 years and over
Males 53.7% Never married35.2% Now married2.3% Separated2.4% Widowed6.4% DivorcedFemales 58.0% Never married19.8% Now married1.1% Separated3.8% Widowed17.3% DivorcedWomen who gave birth in the past 12 months Now married:
0.0% (0)Unmarried:
100.0% (50)
Women who did not give birth in the past 12 months Now married:
16.7% (219)Unmarried:
83.3% (1,090)
Marital status - American Indian / Alaska Native population 15 years and over
Males 43.1% Never married56.9% Now married0.0% Separated0.0% Widowed0.0% DivorcedFemales 89.1% Never married0.0% Now married0.0% Separated6.5% Widowed4.3% DivorcedWomen who did not give birth in the past 12 months Now married:
0.0% (0)Unmarried:
100.0% (48)
Marital status - Asian population 15 years and over
Males 12.8% Never married77.7% Now married4.4% Separated1.4% Widowed3.8% DivorcedFemales 21.5% Never married70.0% Now married0.0% Separated1.5% Widowed7.0% DivorcedWomen who gave birth in the past 12 months Now married:
46.0% (103)Unmarried:
54.0% (121)
Women who did not give birth in the past 12 months Now married:
71.7% (1,644)Unmarried:
28.3% (649)
Marital status - Other race population 15 years and over
Males 6.3% Never married88.5% Now married0.0% Separated0.0% Widowed5.1% DivorcedFemales 19.7% Never married71.4% Now married0.0% Separated0.0% Widowed9.0% DivorcedWomen who gave birth in the past 12 months Now married:
100.0% (32)Unmarried:
0.0% (0)
Women who did not give birth in the past 12 months Now married:
72.7% (244)Unmarried:
27.3% (92)
Marital status - Two or more races population 15 years and over
Males 45.7% Never married50.5% Now married1.3% Separated0.0% Widowed2.5% DivorcedFemales 28.0% Never married51.7% Now married2.5% Separated6.0% Widowed11.9% DivorcedWomen who gave birth in the past 12 months Now married:
100.0% (42)Unmarried:
0.0% (0)
Women who did not give birth in the past 12 months Now married:
51.1% (929)Unmarried:
48.9% (888)
Marital status - White alone, not Hispanic / Latino population 15 years and over
Males 31.1% Never married59.4% Now married0.6% Separated2.6% Widowed6.2% DivorcedFemales 25.9% Never married53.1% Now married1.2% Separated8.2% Widowed11.6% DivorcedWomen who gave birth in the past 12 months Now married:
100.0% (311)Unmarried:
0.0% (0)
Women who did not give birth in the past 12 months Now married:
43.4% (6,844)Unmarried:
56.6% (8,938)
Marital status - Hispanic or Latino population 15 years and over
Males 21.3% Never married74.0% Now married3.6% Separated0.0% Widowed1.1% DivorcedFemales 35.1% Never married44.2% Now married1.8% Separated6.8% Widowed12.1% DivorcedWomen who gave birth in the past 12 months Now married:
100.0% (30)Unmarried:
0.0% (0)
Women who did not give birth in the past 12 months Now married:
45.4% (801)Unmarried:
54.6% (962)
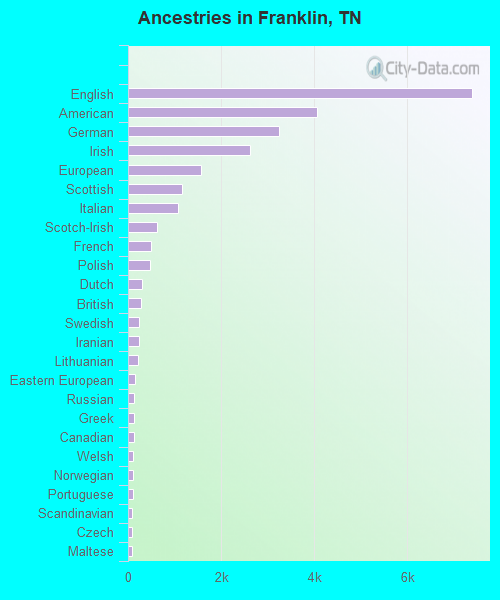
Ancestries in Franklin
7,383 17.9% English4,056 9.8% American3,249 7.9% German2,613 6.3% Irish1,561 3.8% European1,167 2.8% Scottish1,078 2.6% Italian633 1.5% Scotch-Irish493 1.2% French462 1.1% Polish296 0.7% Dutch272 0.7% British232 0.6% Swedish232 0.6% Iranian218 0.5% Lithuanian146 0.4% Eastern European134 0.3% Russian129 0.3% Greek128 0.3% Canadian113 0.3% Welsh98 0.2% Norwegian98 0.2% Portuguese93 0.2% Scandinavian91 0.2% Czech90 0.2% Maltese89 0.2% Armenian89 0.2% Turkish82 0.2% Swiss81 0.2% Ukrainian69 0.2% French Canadian61 0.1% Hungarian56 0.1% Slovak54 0.1% Danish50 0.1% Romanian50 0.1% African49 0.1% British West Indian43 0.1% South African40 0.10% Albanian35 0.08% Bulgarian29 0.07% Yugoslavian27 0.07% Northern European23 0.06% Cajun22 0.05% Austrian19 0.05% Lebanese17 0.04% Brazilian17 0.04% Australian15 0.04% Egyptian15 0.04% Belgian13 0.03% Czechoslovakian12 0.03% Croatian12 0.03% Haitian9 0.02% Nigerian8 0.02% Estonian8 0.02% Serbian
Geographical mobility in Franklin Same house 1 year ago 54,583 83.4% White (Caucasian)4,707 92.2% Black or African American107 83.0% American Indian / Alaska Native5,686 70.2% Asian923 91.7% Other race4,978 73.1% Two or more races53,995 83.4% White alone, not Hispanic / Latino4,192 81.4% Hispanic or LatinoMoved within same county 3,157 4.8% White / Caucasian44 0.9% Black or African American860 10.6% Asian742 10.9% Two or more races3,157 4.9% White alone, not Hispanic / Latino374 7.3% Hispanic or LatinoMoved within same state 3,310 5.1% White / Caucasian221 4.3% Black or African American540 6.7% Asian963 14.1% Two or more races3,310 5.1% White alone, not Hispanic / Latino411 8.0% Hispanic or LatinoMoved from different state 4,364 6.7% White / Caucasian150 2.9% Black or African American29 22.5% American Indian / Alaska Native556 6.9% Asian36 3.6% Other race140 2.1% Two or more races4,296 6.6% White alone, not Hispanic / Latino157 3.1% Hispanic or LatinoMoved from abroad 434 5.4% Asian69 6.9% Other race47 0.9% Hispanic or Latino
Children Nativity (place of birth) in Franklin
Children under 6 years - Living with two parents Both parents native 3,904 100.0% NativeBoth parents foreign-born 860 84.9% Native153 15.1% Foreign-bornOne native, one foreign-born parent 317 100.0% NativeChildren under 6 years - Living with one parent Native parent 567 100.0% NativeForeign-born parent 88 100.0% NativeChildren 6 to 17 years - Living with two parents Both parents native 8,466 97.1% Native256 2.9% Foreign-bornBoth parents foreign-born 883 34.9% Native1,645 65.1% Foreign-bornOne native, one foreign-born parent 254 90.4% Native27 9.6% Foreign-bornChildren 6 to 17 years - Living with one parent Native parent 2,779 100.0% NativeForeign-born parent 305 54.9% Native251 45.1% Foreign-born
Grandparents responsible for own grandchildren in Franklin
Grandparents (30 to 59 years) White / Caucasian 48 32.1% Responsible for grandchildren102 67.9% Not responsible for grandchildrenOther race 4 100.0% Responsible for grandchildrenWhite alone, not Hispanic / Latino 48 40.6% Responsible for grandchildren70 59.4% Not responsible for grandchildrenHispanic or Latino 35 100.0% Not responsible for grandchildrenGrandparents (60 years and over) White / Caucasian 106 31.2% Responsible for grandchildren235 68.8% Not responsible for grandchildrenWhite alone, not Hispanic / Latino 107 31.3% Responsible for grandchildren236 68.7% Not responsible for grandchildren