Races in Franklin Park, New Jersey (NJ) Detailed Stats
Data:
Races - White alone (%)
Races - White alone (% change since 2000)
Races - Black alone (%)
Races - Black alone (% change since 2000)
Races - American Indian alone (%)
Races - American Indian alone (% change since 2000)
Races - Asian alone (%)
Races - Asian alone (% change since 2000)
Races - Hispanic (%)
Races - Hispanic (% change since 2000)
Races - Native Hawaiian and Other Pacific Islander alone (%)
Races - Native Hawaiian and Other Pacific Islander alone (% change since 2000)
Races - Two or more races(%)
Races - Two or more races(% change since 2000)
Races - Other race alone (%)
Races - Other race alone (% change since 2000)
Racial diversity
Place of birth - Born in state of residence (%)
Place of birth - Born in state of residence (%) - White
Place of birth - Born in state of residence (%) - Black or African American
Place of birth - Born in state of residence (%) - Asian
Place of birth - Born in state of residence (%) - Hispanic or Latino
Place of birth - Born in state of residence (%) - American Indian and Alaska Native
Place of birth - Born in state of residence (%) - Multirace
Place of birth - Born in state of residence (%) - Other Race
Place of birth - Born in other state (%)
Place of birth - Born in other state (%) - White
Place of birth - Born in other state (%) - Black or African American
Place of birth - Born in other state (%) - Asian
Place of birth - Born in other state (%) - Hispanic or Latino
Place of birth - Born in other state (%) - American Indian and Alaska Native
Place of birth - Born in other state (%) - Multirace
Place of birth - Born in other state (%) - Other Race
Place of birth - Native, outside of US (%)
Place of birth - Native, outside of US (%) - White
Place of birth - Native, outside of US (%) - Black or African American
Place of birth - Native, outside of US (%) - Asian
Place of birth - Native, outside of US (%) - Hispanic or Latino
Place of birth - Native, outside of US (%) - American Indian and Alaska Native
Place of birth - Native, outside of US (%) - Multirace
Place of birth - Native, outside of US (%) - Other Race
Place of birth - Foreign born (%)
Place of birth - Foreign born (%) - White
Place of birth - Foreign born (%) - Black or African American
Place of birth - Foreign born (%) - Asian
Place of birth - Foreign born (%) - Hispanic or Latino
Place of birth - Foreign born (%) - American Indian and Alaska Native
Place of birth - Foreign born (%) - Multirace
Place of birth - Foreign born (%) - Other Race
Residents speaking English at home (%)
Residents speaking English at home - Born in the United States (%)
Residents speaking English at home - Native, born elsewhere (%)
Residents speaking English at home - Foreign born (%)
Residents speaking Spanish at home (%)
Residents speaking Spanish at home - Born in the United States (%)
Residents speaking Spanish at home - Native, born elsewhere (%)
Residents speaking Spanish at home - Foreign born (%)
Residents speaking other language at home (%)
Residents speaking other language at home - Born in the United States (%)
Residents speaking other language at home - Native, born elsewhere (%)
Residents speaking other language at home - Foreign born (%)
Marital status - Never married (%)
Marital status - Now married (%)
Marital status - Separated (%)
Marital status - Widowed (%)
Marital status - Divorced (%)
Ancestries Reported - Arab (%)
Ancestries Reported - Czech (%)
Ancestries Reported - Danish (%)
Ancestries Reported - Dutch (%)
Ancestries Reported - English (%)
Ancestries Reported - French (%)
Ancestries Reported - French Canadian (%)
Ancestries Reported - German (%)
Ancestries Reported - Greek (%)
Ancestries Reported - Hungarian (%)
Ancestries Reported - Irish (%)
Ancestries Reported - Italian (%)
Ancestries Reported - Lithuanian (%)
Ancestries Reported - Norwegian (%)
Ancestries Reported - Polish (%)
Ancestries Reported - Portuguese (%)
Ancestries Reported - Russian (%)
Ancestries Reported - Scotch-Irish (%)
Ancestries Reported - Scottish (%)
Ancestries Reported - Slovak (%)
Ancestries Reported - Subsaharan African (%)
Ancestries Reported - Swedish (%)
Ancestries Reported - Swiss (%)
Ancestries Reported - Ukrainian (%)
Ancestries Reported - United States (%)
Ancestries Reported - Welsh (%)
Ancestries Reported - West Indian (%)
Ancestries Reported - Other (%)
Geographical mobility - Same house 1 year ago (%)
Geographical mobility - Same house 1 year ago (%) - White
Geographical mobility - Same house 1 year ago (%) - Black or African American
Geographical mobility - Same house 1 year ago (%) - Asian
Geographical mobility - Same house 1 year ago (%) - Hispanic or Latino
Geographical mobility - Same house 1 year ago (%) - American Indian and Alaska Native
Geographical mobility - Same house 1 year ago (%) - Multirace
Geographical mobility - Same house 1 year ago (%) - Other Race
Geographical mobility - Moved within same county (%)
Geographical mobility - Moved within same county (%) - White
Geographical mobility - Moved within same county (%) - Black or African American
Geographical mobility - Moved within same county (%) - Asian
Geographical mobility - Moved within same county (%) - Hispanic or Latino
Geographical mobility - Moved within same county (%) - American Indian and Alaska Native
Geographical mobility - Moved within same county (%) - Multirace
Geographical mobility - Moved within same county (%) - Other Race
Geographical mobility - Moved from different county within same state (%)
Geographical mobility - Moved from different county within same state (%) - White
Geographical mobility - Moved from different county within same state (%) - Black or African American
Geographical mobility - Moved from different county within same state (%) - Asian
Geographical mobility - Moved from different county within same state (%) - Hispanic or Latino
Geographical mobility - Moved from different county within same state (%) - American Indian and Alaska Native
Geographical mobility - Moved from different county within same state (%) - Multirace
Geographical mobility - Moved from different county within same state (%) - Other Race
Geographical mobility - Moved from different state (%)
Geographical mobility - Moved from different state (%) - White
Geographical mobility - Moved from different state (%) - Black or African American
Geographical mobility - Moved from different state (%) - Asian
Geographical mobility - Moved from different state (%) - Hispanic or Latino
Geographical mobility - Moved from different state (%) - American Indian and Alaska Native
Geographical mobility - Moved from different state (%) - Multirace
Geographical mobility - Moved from different state (%) - Other Race
Geographical mobility - Moved from abroad (%)
Geographical mobility - Moved from abroad (%) - White
Geographical mobility - Moved from abroad (%) - Black or African American
Geographical mobility - Moved from abroad (%) - Asian
Geographical mobility - Moved from abroad (%) - Hispanic or Latino
Geographical mobility - Moved from abroad (%) - American Indian and Alaska Native
Geographical mobility - Moved from abroad (%) - Multirace
Geographical mobility - Moved from abroad (%) - Other Race
Place of birth for the foreign-born population - Ireland (%)
Place of birth for the foreign-born population - Denmark (%)
Place of birth for the foreign-born population - Norway (%)
Place of birth for the foreign-born population - Sweden (%)
Place of birth for the foreign-born population - United Kingdom (%)
Place of birth for the foreign-born population - England (%)
Place of birth for the foreign-born population - Scotland (%)
Place of birth for the foreign-born population - Other Northern Europe (%)
Place of birth for the foreign-born population - Austria (%)
Place of birth for the foreign-born population - Belgium (%)
Place of birth for the foreign-born population - France (%)
Place of birth for the foreign-born population - Germany (%)
Place of birth for the foreign-born population - Netherlands (%)
Place of birth for the foreign-born population - Switzerland (%)
Place of birth for the foreign-born population - Other Western Europe (%)
Place of birth for the foreign-born population - Greece (%)
Place of birth for the foreign-born population - Italy (%)
Place of birth for the foreign-born population - Portugal (%)
Place of birth for the foreign-born population - Spain (%)
Place of birth for the foreign-born population - Other Southern Europe (%)
Place of birth for the foreign-born population - Albania (%)
Place of birth for the foreign-born population - Belarus (%)
Place of birth for the foreign-born population - Bosnia and Herzegovina (%)
Place of birth for the foreign-born population - Bulgaria (%)
Place of birth for the foreign-born population - Croatia (%)
Place of birth for the foreign-born population - Czechoslovakia (%)
Place of birth for the foreign-born population - Hungary (%)
Place of birth for the foreign-born population - Latvia (%)
Place of birth for the foreign-born population - Lithuania (%)
Place of birth for the foreign-born population - North Macedonia (Macedonia) (%)
Place of birth for the foreign-born population - Moldova (%)
Place of birth for the foreign-born population - Poland (%)
Place of birth for the foreign-born population - Romania (%)
Place of birth for the foreign-born population - Russia (%)
Place of birth for the foreign-born population - Serbia (%)
Place of birth for the foreign-born population - Ukraine (%)
Place of birth for the foreign-born population - Other Eastern Europe (%)
Place of birth for the foreign-born population - China (%)
Place of birth for the foreign-born population - Hong Kong (%)
Place of birth for the foreign-born population - Taiwan (%)
Place of birth for the foreign-born population - Japan (%)
Place of birth for the foreign-born population - Korea (%)
Place of birth for the foreign-born population - Other Eastern Asia (%)
Place of birth for the foreign-born population - Afghanistan (%)
Place of birth for the foreign-born population - Bangladesh (%)
Place of birth for the foreign-born population - India (%)
Place of birth for the foreign-born population - Iran (%)
Place of birth for the foreign-born population - Kazakhstan (%)
Place of birth for the foreign-born population - Nepal (%)
Place of birth for the foreign-born population - Pakistan (%)
Place of birth for the foreign-born population - Sri Lanka (%)
Place of birth for the foreign-born population - Uzbekistan (%)
Place of birth for the foreign-born population - Other South Central Asia (%)
Place of birth for the foreign-born population - Burma (%)
Place of birth for the foreign-born population - Cambodia (%)
Place of birth for the foreign-born population - Indonesia (%)
Place of birth for the foreign-born population - Laos (%)
Place of birth for the foreign-born population - Malaysia (%)
Place of birth for the foreign-born population - Philippines (%)
Place of birth for the foreign-born population - Singapore (%)
Place of birth for the foreign-born population - Thailand (%)
Place of birth for the foreign-born population - Vietnam (%)
Place of birth for the foreign-born population - Other South Eastern Asia (%)
Place of birth for the foreign-born population - Armenia (%)
Place of birth for the foreign-born population - Iraq (%)
Place of birth for the foreign-born population - Israel (%)
Place of birth for the foreign-born population - Jordan (%)
Place of birth for the foreign-born population - Kuwait (%)
Place of birth for the foreign-born population - Lebanon (%)
Place of birth for the foreign-born population - Saudi Arabia (%)
Place of birth for the foreign-born population - Syria (%)
Place of birth for the foreign-born population - Turkey (%)
Place of birth for the foreign-born population - Yemen (%)
Place of birth for the foreign-born population - Other Western Asia (%)
Place of birth for the foreign-born population - Eritrea (%)
Place of birth for the foreign-born population - Ethiopia (%)
Place of birth for the foreign-born population - Kenya (%)
Place of birth for the foreign-born population - Somalia (%)
Place of birth for the foreign-born population - Uganda (%)
Place of birth for the foreign-born population - Zimbabwe (%)
Place of birth for the foreign-born population - Other Eastern Africa (%)
Place of birth for the foreign-born population - Cameroon (%)
Place of birth for the foreign-born population - Congo (%)
Place of birth for the foreign-born population - Democratic Republic of Congo (Zaire) (%)
Place of birth for the foreign-born population - Other Middle Africa (%)
Place of birth for the foreign-born population - Egypt (%)
Place of birth for the foreign-born population - Morocco (%)
Place of birth for the foreign-born population - Sudan (%)
Place of birth for the foreign-born population - Other Northern Africa (%)
Place of birth for the foreign-born population - South Africa (%)
Place of birth for the foreign-born population - Other Southern Africa (%)
Place of birth for the foreign-born population - Cabo Verde (%)
Place of birth for the foreign-born population - Ghana (%)
Place of birth for the foreign-born population - Liberia (%)
Place of birth for the foreign-born population - Nigeria (%)
Place of birth for the foreign-born population - Senegal (%)
Place of birth for the foreign-born population - Sierra Leone (%)
Place of birth for the foreign-born population - Other Western Africa (%)
Place of birth for the foreign-born population - Australia (%)
Place of birth for the foreign-born population - New Zealand (%)
Place of birth for the foreign-born population - Fiji (%)
Place of birth for the foreign-born population - Micronesia (%)
Place of birth for the foreign-born population - Bahamas (%)
Place of birth for the foreign-born population - Barbados (%)
Place of birth for the foreign-born population - Cuba (%)
Place of birth for the foreign-born population - Dominica (%)
Place of birth for the foreign-born population - Dominican Republic (%)
Place of birth for the foreign-born population - Grenada (%)
Place of birth for the foreign-born population - Haiti (%)
Place of birth for the foreign-born population - Jamaica (%)
Place of birth for the foreign-born population - St. Vincent and the Grenadines (%)
Place of birth for the foreign-born population - Trinidad and Tobago (%)
Place of birth for the foreign-born population - West Indies (%)
Place of birth for the foreign-born population - Other Caribbean (%)
Place of birth for the foreign-born population - Belize (%)
Place of birth for the foreign-born population - Costa Rica (%)
Place of birth for the foreign-born population - El Salvador (%)
Place of birth for the foreign-born population - Guatemala (%)
Place of birth for the foreign-born population - Honduras (%)
Place of birth for the foreign-born population - Mexico (%)
Place of birth for the foreign-born population - Nicaragua (%)
Place of birth for the foreign-born population - Panama (%)
Place of birth for the foreign-born population - Other Central America (%)
Place of birth for the foreign-born population - Argentina (%)
Place of birth for the foreign-born population - Bolivia (%)
Place of birth for the foreign-born population - Brazil (%)
Place of birth for the foreign-born population - Chile (%)
Place of birth for the foreign-born population - Colombia (%)
Place of birth for the foreign-born population - Ecuador (%)
Place of birth for the foreign-born population - Guyana (%)
Place of birth for the foreign-born population - Peru (%)
Place of birth for the foreign-born population - Uruguay (%)
Place of birth for the foreign-born population - Venezuela (%)
Place of birth for the foreign-born population - Other South America (%)
Place of birth for the foreign-born population - Canada (%)
Place of birth for the foreign-born population - Other Northern America (%)
Place of birth for the foreign-born population - Other (%)
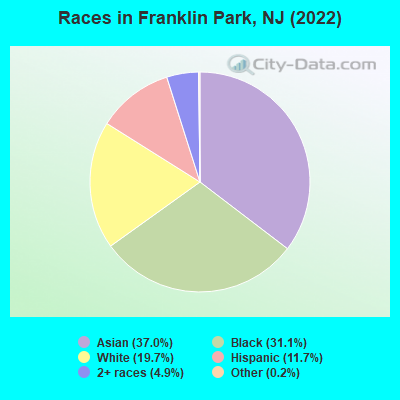
According to 2022 data, the most numerous races in Franklin Park, NJ are White alone (2,675 residents), Hispanic (1,588 residents), and Black alone (4,207 residents). 57.5% of Franklin Park residents speak English at home.
Race distribution in Franklin Park 5,014 37.0% Asian alone 4,207 31.1% Black alone 2,675 19.7% White alone 1,588 11.7% Hispanic 664 4.9% Two or more races 29 0.2% Other race alone
2000 2022
5,557,209 66.0% White alone 1,117,191 13.3% Hispanic 1,096,171 13.0% Black alone 477,012 5.7% Asian alone 133,689 1.6% Two or more races 19,565 0.2% Other race alone 11,338 0.1% American Indian alone 2,175 0.03% Native Hawaiian and Other
4,766,476 51.5% White alone 2,028,470 21.9% Hispanic 1,111,632 12.0% Black alone 923,546 10.0% Asian alone 332,237 3.6% Two or more races 89,847 1.0% Other race alone 8,557 0.09% American Indian alone 934 0.01% Native Hawaiian and Other
Income and house value in Franklin Park Median household income in 2022 $98,403 White non-Hispanic householders$111,333 Black householders$138,325 Asian householders$131,710 Some other race householders$146,847 Two or more races householders$117,109 Hispanic or Latino race householders
Median age by race in Franklin Park
41.9 Median age for White residents40.1 43.2 39.4 Median age for Black or African American residents35.9 39.6 -676,272,813.9 Median age for American Indian / Alaska Native residents-670,465,336.5 -688,298,917.7 36.6 Median age for Asian residents35.2 36.7 -866,479,924.4 Median age for Native Hawaiian / Pacific Islander residents-866,479,924.4 -713,070,378.3 12.0 Median age for Other race residents11.2 12.2 34.2 Median age for Two or more races residents30.7 34.8 39.9 Median age for White alone residents39.7 40.5 34.0 Median age for Hispanic or Latino residents34.5 33.1
Owner/renter occupied households by race in Franklin Park
House owners and renters - White residents 851 59.4% Owner occupied581 40.6% Renter occupiedHouse owners and renters - Black or African American residents 1,094 61.3% Owner occupied690 38.7% Renter occupiedHouse owners and renters - Asian residents 1,251 72.1% Owner occupied484 27.9% Renter occupiedHouse owners and renters - Other race residents 26 17.6% Owner occupied120 82.4% Renter occupiedHouse owners and renters - Two or more races residents 182 64.1% Owner occupied102 35.9% Renter occupiedHouse owners and renters - White alone residents 770 60.4% Owner occupied505 39.6% Renter occupiedHouse owners and renters - Hispanic or Latino residents 228 38.2% Owner occupied368 61.8% Renter occupied
Language usage in Franklin Park
English speakers - Total 57.5% of residents of Franklin Park speak English at home.
8.3% of residents speak Spanish at home 664 63.1% Speak English very well388 36.9% Speak English less than very well33.6% of residents speak other language at home 2,718 64.1% Speak English very well1,522 35.9% Speak English less than very well
English speakers - Born in the United States 85.4% of residents of Franklin Park speak English at home.
10.1% of residents speak Spanish at home 186 79.8% Speak English very well47 20.2% Speak English less than very well4.3% of residents speak other language at home 99 100.0% Speak English very well
All residents speak only English at home
English speakers - Foreign-born 17.9% of residents of Franklin Park speak English at home.
10.6% of residents speak Spanish at home 169 27.8% Speak English very well438 72.2% Speak English less than very well69.7% of residents speak other language at home 2,501 62.5% Speak English very well1,499 37.5% Speak English less than very well
White (Caucasian) - Speak only English Native:
92.9% (2,022)Foreign-born:
11.8% (73)
White (Caucasian) - Speak another language Native:
5.3% (115)Foreign-born:
90.6% (562)
Black or African American - Speak only English Native:
98.3% (3,334)Foreign-born:
43.3% (318)
Black or African American - Speak another language Native:
2.1% (71)Foreign-born:
56.9% (418)
Asian - Speak only English Native:
59.0% (612)Foreign-born:
17.6% (631)
Asian - Speak another language Native:
38.1% (395)Foreign-born:
82.6% (2,966)
Other race - Speak only English Native:
58.8% (293)Foreign-born:
24.7% (23)
Other race - Speak another language Native:
41.7% (208)Foreign-born:
75.3% (70)
Two or more races - Speak only English Native:
44.8% (236)Foreign-born:
8.2% (61)
Two or more races - Speak another language Native:
56.4% (297)Foreign-born:
92.2% (681)
White alone - Speak only English Native:
93.3% (1,924)Foreign-born:
16.0% (70)
White alone - Speak another language Native:
5.1% (104)Foreign-born:
85.2% (373)
Hispanic or Latino - Speak only English Native:
56.4% (488)Foreign-born:
8.5% (51)
Hispanic or Latino - Speak another language Native:
43.6% (377)Foreign-born:
85.5% (519)
Foreign-born residents in Franklin Park
Marital status for residents in Franklin Park Marital status - White (Caucasian) population 15 years and over
Males 28.1% Never married59.6% Now married0.8% Separated3.0% Widowed8.4% DivorcedFemales 28.8% Never married52.5% Now married2.3% Separated4.8% Widowed11.6% DivorcedWomen who gave birth in the past 12 months Now married:
100.0% (19)Unmarried:
0.0% (0)
Women who did not give birth in the past 12 months Now married:
46.1% (239)Unmarried:
53.9% (279)
Marital status - Black or African American population 15 years and over
Males 54.3% Never married43.8% Now married0.0% Separated0.0% Widowed1.9% DivorcedFemales 49.3% Never married30.0% Now married0.1% Separated12.4% Widowed8.2% DivorcedWomen who gave birth in the past 12 months Now married:
34.1% (48)Unmarried:
65.9% (93)
Women who did not give birth in the past 12 months Now married:
26.5% (293)Unmarried:
73.5% (815)
Marital status - Asian population 15 years and over
Males 15.8% Never married78.4% Now married0.0% Separated1.0% Widowed4.7% DivorcedFemales 16.9% Never married69.1% Now married0.0% Separated7.9% Widowed6.0% DivorcedWomen who gave birth in the past 12 months Now married:
100.0% (81)Unmarried:
0.0% (0)
Women who did not give birth in the past 12 months Now married:
66.3% (687)Unmarried:
33.7% (350)
Marital status - Other race population 15 years and over
Males 59.4% Never married40.6% Now married0.0% Separated0.0% Widowed0.0% DivorcedFemales 17.8% Never married45.4% Now married0.0% Separated0.0% Widowed36.8% DivorcedWomen who gave birth in the past 12 months Now married:
15.6% (6)Unmarried:
84.4% (34)
Women who did not give birth in the past 12 months Now married:
53.3% (81)Unmarried:
46.7% (71)
Marital status - Two or more races population 15 years and over
Males 46.4% Never married41.2% Now married0.3% Separated0.0% Widowed12.2% DivorcedFemales 30.2% Never married69.8% Now married0.0% Separated0.0% Widowed0.0% DivorcedWomen who did not give birth in the past 12 months Now married:
78.0% (313)Unmarried:
22.0% (89)
Marital status - White alone, not Hispanic / Latino population 15 years and over
Males 30.1% Never married56.2% Now married0.9% Separated3.4% Widowed9.4% DivorcedFemales 30.2% Never married52.0% Now married2.6% Separated5.4% Widowed9.8% DivorcedWomen who did not give birth in the past 12 months Now married:
46.1% (242)Unmarried:
53.9% (283)
Marital status - Hispanic or Latino population 15 years and over
Males 30.3% Never married69.5% Now married0.2% Separated0.0% Widowed0.0% DivorcedFemales 31.2% Never married45.5% Now married0.0% Separated0.0% Widowed23.3% DivorcedWomen who gave birth in the past 12 months Now married:
42.6% (23)Unmarried:
57.4% (31)
Women who did not give birth in the past 12 months Now married:
48.0% (200)Unmarried:
52.0% (217)
Ancestries in Franklin Park
424 5.3% Italian221 2.8% Nigerian204 2.5% Jamaican196 2.4% Egyptian195 2.4% Sierra Leonean108 1.3% German103 1.3% Ethiopian101 1.3% Ukrainian89 1.1% Haitian79 1.0% Sudanese66 0.8% Trinidadian and Tobagonian66 0.8% U.S. Virgin Islander61 0.8% Hungarian55 0.7% Barbadian54 0.7% Russian37 0.5% American37 0.5% Ghanaian36 0.4% European31 0.4% Irish28 0.3% Lebanese23 0.3% African22 0.3% Palestinian20 0.2% Greek20 0.2% Guyanese18 0.2% Iranian16 0.2% Portuguese13 0.2% West Indian12 0.1% Polish5 0.06% Czechoslovakian
Children Nativity (place of birth) in Franklin Park
Children under 6 years - Living with two parents Both parents native 325 100.0% NativeBoth parents foreign-born 300 100.0% NativeOne native, one foreign-born parent 17 66.5% Native9 33.5% Foreign-bornChildren under 6 years - Living with one parent Native parent 191 100.0% NativeForeign-born parent 103 100.0% NativeChildren 6 to 17 years - Living with two parents Both parents native 71 91.2% Native7 8.8% Foreign-bornBoth parents foreign-born 921 89.1% Native113 10.9% Foreign-bornOne native, one foreign-born parent 52 100.0% NativeChildren 6 to 17 years - Living with one parent Native parent 426 100.0% NativeForeign-born parent 149 52.6% Native135 47.4% Foreign-born
Grandparents responsible for own grandchildren in Franklin Park
Grandparents (30 to 59 years) Asian 37 100.0% Not responsible for grandchildren
Grandparents (60 years and over) Asian 177 100.0% Not responsible for grandchildren