Races in Fort Meade, Maryland (MD) Detailed Stats
Data:
Races - White alone (%)
Races - White alone (% change since 2000)
Races - Black alone (%)
Races - Black alone (% change since 2000)
Races - American Indian alone (%)
Races - American Indian alone (% change since 2000)
Races - Asian alone (%)
Races - Asian alone (% change since 2000)
Races - Hispanic (%)
Races - Hispanic (% change since 2000)
Races - Native Hawaiian and Other Pacific Islander alone (%)
Races - Native Hawaiian and Other Pacific Islander alone (% change since 2000)
Races - Two or more races(%)
Races - Two or more races(% change since 2000)
Races - Other race alone (%)
Races - Other race alone (% change since 2000)
Racial diversity
Place of birth - Born in state of residence (%)
Place of birth - Born in state of residence (%) - White
Place of birth - Born in state of residence (%) - Black or African American
Place of birth - Born in state of residence (%) - Asian
Place of birth - Born in state of residence (%) - Hispanic or Latino
Place of birth - Born in state of residence (%) - American Indian and Alaska Native
Place of birth - Born in state of residence (%) - Multirace
Place of birth - Born in state of residence (%) - Other Race
Place of birth - Born in other state (%)
Place of birth - Born in other state (%) - White
Place of birth - Born in other state (%) - Black or African American
Place of birth - Born in other state (%) - Asian
Place of birth - Born in other state (%) - Hispanic or Latino
Place of birth - Born in other state (%) - American Indian and Alaska Native
Place of birth - Born in other state (%) - Multirace
Place of birth - Born in other state (%) - Other Race
Place of birth - Native, outside of US (%)
Place of birth - Native, outside of US (%) - White
Place of birth - Native, outside of US (%) - Black or African American
Place of birth - Native, outside of US (%) - Asian
Place of birth - Native, outside of US (%) - Hispanic or Latino
Place of birth - Native, outside of US (%) - American Indian and Alaska Native
Place of birth - Native, outside of US (%) - Multirace
Place of birth - Native, outside of US (%) - Other Race
Place of birth - Foreign born (%)
Place of birth - Foreign born (%) - White
Place of birth - Foreign born (%) - Black or African American
Place of birth - Foreign born (%) - Asian
Place of birth - Foreign born (%) - Hispanic or Latino
Place of birth - Foreign born (%) - American Indian and Alaska Native
Place of birth - Foreign born (%) - Multirace
Place of birth - Foreign born (%) - Other Race
Residents speaking English at home (%)
Residents speaking English at home - Born in the United States (%)
Residents speaking English at home - Native, born elsewhere (%)
Residents speaking English at home - Foreign born (%)
Residents speaking Spanish at home (%)
Residents speaking Spanish at home - Born in the United States (%)
Residents speaking Spanish at home - Native, born elsewhere (%)
Residents speaking Spanish at home - Foreign born (%)
Residents speaking other language at home (%)
Residents speaking other language at home - Born in the United States (%)
Residents speaking other language at home - Native, born elsewhere (%)
Residents speaking other language at home - Foreign born (%)
Marital status - Never married (%)
Marital status - Now married (%)
Marital status - Separated (%)
Marital status - Widowed (%)
Marital status - Divorced (%)
Ancestries Reported - Arab (%)
Ancestries Reported - Czech (%)
Ancestries Reported - Danish (%)
Ancestries Reported - Dutch (%)
Ancestries Reported - English (%)
Ancestries Reported - French (%)
Ancestries Reported - French Canadian (%)
Ancestries Reported - German (%)
Ancestries Reported - Greek (%)
Ancestries Reported - Hungarian (%)
Ancestries Reported - Irish (%)
Ancestries Reported - Italian (%)
Ancestries Reported - Lithuanian (%)
Ancestries Reported - Norwegian (%)
Ancestries Reported - Polish (%)
Ancestries Reported - Portuguese (%)
Ancestries Reported - Russian (%)
Ancestries Reported - Scotch-Irish (%)
Ancestries Reported - Scottish (%)
Ancestries Reported - Slovak (%)
Ancestries Reported - Subsaharan African (%)
Ancestries Reported - Swedish (%)
Ancestries Reported - Swiss (%)
Ancestries Reported - Ukrainian (%)
Ancestries Reported - United States (%)
Ancestries Reported - Welsh (%)
Ancestries Reported - West Indian (%)
Ancestries Reported - Other (%)
Geographical mobility - Same house 1 year ago (%)
Geographical mobility - Same house 1 year ago (%) - White
Geographical mobility - Same house 1 year ago (%) - Black or African American
Geographical mobility - Same house 1 year ago (%) - Asian
Geographical mobility - Same house 1 year ago (%) - Hispanic or Latino
Geographical mobility - Same house 1 year ago (%) - American Indian and Alaska Native
Geographical mobility - Same house 1 year ago (%) - Multirace
Geographical mobility - Same house 1 year ago (%) - Other Race
Geographical mobility - Moved within same county (%)
Geographical mobility - Moved within same county (%) - White
Geographical mobility - Moved within same county (%) - Black or African American
Geographical mobility - Moved within same county (%) - Asian
Geographical mobility - Moved within same county (%) - Hispanic or Latino
Geographical mobility - Moved within same county (%) - American Indian and Alaska Native
Geographical mobility - Moved within same county (%) - Multirace
Geographical mobility - Moved within same county (%) - Other Race
Geographical mobility - Moved from different county within same state (%)
Geographical mobility - Moved from different county within same state (%) - White
Geographical mobility - Moved from different county within same state (%) - Black or African American
Geographical mobility - Moved from different county within same state (%) - Asian
Geographical mobility - Moved from different county within same state (%) - Hispanic or Latino
Geographical mobility - Moved from different county within same state (%) - American Indian and Alaska Native
Geographical mobility - Moved from different county within same state (%) - Multirace
Geographical mobility - Moved from different county within same state (%) - Other Race
Geographical mobility - Moved from different state (%)
Geographical mobility - Moved from different state (%) - White
Geographical mobility - Moved from different state (%) - Black or African American
Geographical mobility - Moved from different state (%) - Asian
Geographical mobility - Moved from different state (%) - Hispanic or Latino
Geographical mobility - Moved from different state (%) - American Indian and Alaska Native
Geographical mobility - Moved from different state (%) - Multirace
Geographical mobility - Moved from different state (%) - Other Race
Geographical mobility - Moved from abroad (%)
Geographical mobility - Moved from abroad (%) - White
Geographical mobility - Moved from abroad (%) - Black or African American
Geographical mobility - Moved from abroad (%) - Asian
Geographical mobility - Moved from abroad (%) - Hispanic or Latino
Geographical mobility - Moved from abroad (%) - American Indian and Alaska Native
Geographical mobility - Moved from abroad (%) - Multirace
Geographical mobility - Moved from abroad (%) - Other Race
Place of birth for the foreign-born population - Ireland (%)
Place of birth for the foreign-born population - Denmark (%)
Place of birth for the foreign-born population - Norway (%)
Place of birth for the foreign-born population - Sweden (%)
Place of birth for the foreign-born population - United Kingdom (%)
Place of birth for the foreign-born population - England (%)
Place of birth for the foreign-born population - Scotland (%)
Place of birth for the foreign-born population - Other Northern Europe (%)
Place of birth for the foreign-born population - Austria (%)
Place of birth for the foreign-born population - Belgium (%)
Place of birth for the foreign-born population - France (%)
Place of birth for the foreign-born population - Germany (%)
Place of birth for the foreign-born population - Netherlands (%)
Place of birth for the foreign-born population - Switzerland (%)
Place of birth for the foreign-born population - Other Western Europe (%)
Place of birth for the foreign-born population - Greece (%)
Place of birth for the foreign-born population - Italy (%)
Place of birth for the foreign-born population - Portugal (%)
Place of birth for the foreign-born population - Spain (%)
Place of birth for the foreign-born population - Other Southern Europe (%)
Place of birth for the foreign-born population - Albania (%)
Place of birth for the foreign-born population - Belarus (%)
Place of birth for the foreign-born population - Bosnia and Herzegovina (%)
Place of birth for the foreign-born population - Bulgaria (%)
Place of birth for the foreign-born population - Croatia (%)
Place of birth for the foreign-born population - Czechoslovakia (%)
Place of birth for the foreign-born population - Hungary (%)
Place of birth for the foreign-born population - Latvia (%)
Place of birth for the foreign-born population - Lithuania (%)
Place of birth for the foreign-born population - North Macedonia (Macedonia) (%)
Place of birth for the foreign-born population - Moldova (%)
Place of birth for the foreign-born population - Poland (%)
Place of birth for the foreign-born population - Romania (%)
Place of birth for the foreign-born population - Russia (%)
Place of birth for the foreign-born population - Serbia (%)
Place of birth for the foreign-born population - Ukraine (%)
Place of birth for the foreign-born population - Other Eastern Europe (%)
Place of birth for the foreign-born population - China (%)
Place of birth for the foreign-born population - Hong Kong (%)
Place of birth for the foreign-born population - Taiwan (%)
Place of birth for the foreign-born population - Japan (%)
Place of birth for the foreign-born population - Korea (%)
Place of birth for the foreign-born population - Other Eastern Asia (%)
Place of birth for the foreign-born population - Afghanistan (%)
Place of birth for the foreign-born population - Bangladesh (%)
Place of birth for the foreign-born population - India (%)
Place of birth for the foreign-born population - Iran (%)
Place of birth for the foreign-born population - Kazakhstan (%)
Place of birth for the foreign-born population - Nepal (%)
Place of birth for the foreign-born population - Pakistan (%)
Place of birth for the foreign-born population - Sri Lanka (%)
Place of birth for the foreign-born population - Uzbekistan (%)
Place of birth for the foreign-born population - Other South Central Asia (%)
Place of birth for the foreign-born population - Burma (%)
Place of birth for the foreign-born population - Cambodia (%)
Place of birth for the foreign-born population - Indonesia (%)
Place of birth for the foreign-born population - Laos (%)
Place of birth for the foreign-born population - Malaysia (%)
Place of birth for the foreign-born population - Philippines (%)
Place of birth for the foreign-born population - Singapore (%)
Place of birth for the foreign-born population - Thailand (%)
Place of birth for the foreign-born population - Vietnam (%)
Place of birth for the foreign-born population - Other South Eastern Asia (%)
Place of birth for the foreign-born population - Armenia (%)
Place of birth for the foreign-born population - Iraq (%)
Place of birth for the foreign-born population - Israel (%)
Place of birth for the foreign-born population - Jordan (%)
Place of birth for the foreign-born population - Kuwait (%)
Place of birth for the foreign-born population - Lebanon (%)
Place of birth for the foreign-born population - Saudi Arabia (%)
Place of birth for the foreign-born population - Syria (%)
Place of birth for the foreign-born population - Turkey (%)
Place of birth for the foreign-born population - Yemen (%)
Place of birth for the foreign-born population - Other Western Asia (%)
Place of birth for the foreign-born population - Eritrea (%)
Place of birth for the foreign-born population - Ethiopia (%)
Place of birth for the foreign-born population - Kenya (%)
Place of birth for the foreign-born population - Somalia (%)
Place of birth for the foreign-born population - Uganda (%)
Place of birth for the foreign-born population - Zimbabwe (%)
Place of birth for the foreign-born population - Other Eastern Africa (%)
Place of birth for the foreign-born population - Cameroon (%)
Place of birth for the foreign-born population - Congo (%)
Place of birth for the foreign-born population - Democratic Republic of Congo (Zaire) (%)
Place of birth for the foreign-born population - Other Middle Africa (%)
Place of birth for the foreign-born population - Egypt (%)
Place of birth for the foreign-born population - Morocco (%)
Place of birth for the foreign-born population - Sudan (%)
Place of birth for the foreign-born population - Other Northern Africa (%)
Place of birth for the foreign-born population - South Africa (%)
Place of birth for the foreign-born population - Other Southern Africa (%)
Place of birth for the foreign-born population - Cabo Verde (%)
Place of birth for the foreign-born population - Ghana (%)
Place of birth for the foreign-born population - Liberia (%)
Place of birth for the foreign-born population - Nigeria (%)
Place of birth for the foreign-born population - Senegal (%)
Place of birth for the foreign-born population - Sierra Leone (%)
Place of birth for the foreign-born population - Other Western Africa (%)
Place of birth for the foreign-born population - Australia (%)
Place of birth for the foreign-born population - New Zealand (%)
Place of birth for the foreign-born population - Fiji (%)
Place of birth for the foreign-born population - Micronesia (%)
Place of birth for the foreign-born population - Bahamas (%)
Place of birth for the foreign-born population - Barbados (%)
Place of birth for the foreign-born population - Cuba (%)
Place of birth for the foreign-born population - Dominica (%)
Place of birth for the foreign-born population - Dominican Republic (%)
Place of birth for the foreign-born population - Grenada (%)
Place of birth for the foreign-born population - Haiti (%)
Place of birth for the foreign-born population - Jamaica (%)
Place of birth for the foreign-born population - St. Vincent and the Grenadines (%)
Place of birth for the foreign-born population - Trinidad and Tobago (%)
Place of birth for the foreign-born population - West Indies (%)
Place of birth for the foreign-born population - Other Caribbean (%)
Place of birth for the foreign-born population - Belize (%)
Place of birth for the foreign-born population - Costa Rica (%)
Place of birth for the foreign-born population - El Salvador (%)
Place of birth for the foreign-born population - Guatemala (%)
Place of birth for the foreign-born population - Honduras (%)
Place of birth for the foreign-born population - Mexico (%)
Place of birth for the foreign-born population - Nicaragua (%)
Place of birth for the foreign-born population - Panama (%)
Place of birth for the foreign-born population - Other Central America (%)
Place of birth for the foreign-born population - Argentina (%)
Place of birth for the foreign-born population - Bolivia (%)
Place of birth for the foreign-born population - Brazil (%)
Place of birth for the foreign-born population - Chile (%)
Place of birth for the foreign-born population - Colombia (%)
Place of birth for the foreign-born population - Ecuador (%)
Place of birth for the foreign-born population - Guyana (%)
Place of birth for the foreign-born population - Peru (%)
Place of birth for the foreign-born population - Uruguay (%)
Place of birth for the foreign-born population - Venezuela (%)
Place of birth for the foreign-born population - Other South America (%)
Place of birth for the foreign-born population - Canada (%)
Place of birth for the foreign-born population - Other Northern America (%)
Place of birth for the foreign-born population - Other (%)
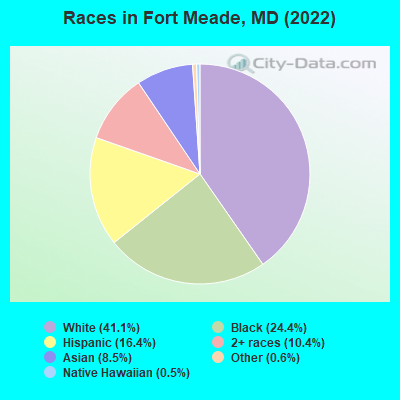
According to 2022 data, the most numerous races in Fort Meade, MD are White alone (4,152 residents), Black alone (2,460 residents), and Hispanic (1,657 residents). 80.2% of Fort Meade residents speak English at home. 9.5% of Fort Meade, MD residents are foreign-born (5.7% born in Asia, 1.3% born in Latin America, 1.1% born in Africa), which is 68.8% less than the foreign-born rate of 16.0% across the entire state of Maryland.
Race distribution in Fort Meade
2000 2022
3,286,547 62.1% White alone 1,464,735 27.7% Black alone 227,916 4.3% Hispanic 209,738 4.0% Asian alone 82,946 1.6% Two or more races 13,312 0.3% American Indian alone 9,379 0.2% Other race alone 1,913 0.04% Native Hawaiian and Other
2,906,492 47.1% White alone 1,800,914 29.2% Black alone 705,842 11.4% Hispanic 401,818 6.5% Asian alone 291,317 4.7% Two or more races 46,930 0.8% Other race alone 8,930 0.1% American Indian alone 2,417 0.04% Native Hawaiian and Other
Income and house value in Fort Meade Median household income in 2022 $85,495 White non-Hispanic householders$98,110 Black householders$94,107 Asian householders$68,040 Some other race householders$89,077 Two or more races householders$89,219 Hispanic or Latino race householdersMedian 2022 house value $-829,487,493 Black or African American householders$-437,084,609 Hispanic or Latino householders
Median age by race in Fort Meade
26.2 Median age for White residents25.8 27.8 30.4 Median age for Black or African American residents31.1 29.9 -836,842,104.4 Median age for American Indian / Alaska Native residents-674,418,604.0 -1,072,276,158.6 46.8 Median age for Asian residents45.2 48.8 21.6 Median age for Native Hawaiian / Pacific Islander residents-720,061,021.4 -760,942,760.2 25.3 Median age for Other race residents26.2 19.1 17.6 Median age for Two or more races residents19.8 15.4 27.5 Median age for White alone residents26.1 27.7 19.5 Median age for Hispanic or Latino residents15.7 23.6
Owner/renter occupied households by race in Fort Meade
House owners and renters - White residents 1,400 100.0% Renter occupiedHouse owners and renters - Black or African American residents 950 100.0% Renter occupiedHouse owners and renters - Asian residents 151 100.0% Renter occupiedHouse owners and renters - Native Hawaiian / Pacific Islander residents 34 100.0% Renter occupiedHouse owners and renters - Other race residents 133 100.0% Renter occupiedHouse owners and renters - Two or more races residents 9 2.7% Owner occupied325 97.3% Renter occupiedHouse owners and renters - White alone residents 1,325 100.0% Renter occupiedHouse owners and renters - Hispanic or Latino residents 335 100.0% Renter occupied
Language usage in Fort Meade
English speakers - Total 80.2% of residents of Fort Meade speak English at home.
7.2% of residents speak Spanish at home 499 77.1% Speak English very well148 22.9% Speak English less than very well12.9% of residents speak other language at home 792 69.0% Speak English very well355 31.0% Speak English less than very well
English speakers - Born in the United States 90.4% of residents of Fort Meade speak English at home.
4.6% of residents speak Spanish at home 272 86.1% Speak English very well44 13.9% Speak English less than very well5.0% of residents speak other language at home 289 84.0% Speak English very well55 16.0% Speak English less than very well
English speakers - Native, born elsewhere 39.3% of residents of Fort Meade speak English at home.
47.9% of residents speak Spanish at home 232 94.7% Speak English very well13 5.3% Speak English less than very well20.1% of residents speak other language at home 98 95.1% Speak English very well5 4.9% Speak English less than very well
English speakers - Foreign-born 14.3% of residents of Fort Meade speak English at home.
8.8% of residents speak Spanish at home 21 25.6% Speak English very well61 74.4% Speak English less than very well76.7% of residents speak other language at home 428 60.1% Speak English very well284 39.9% Speak English less than very well
White (Caucasian) - Speak only English Native:
93.3% (3,703)Foreign-born:
71.8% (35)
White (Caucasian) - Speak another language Native:
5.6% (224)Foreign-born:
36.8% (18)
Black or African American - Speak only English Native:
95.9% (2,155)Foreign-born:
28.2% (31)
Black or African American - Speak another language Native:
3.9% (88)Foreign-born:
73.9% (81)
American Indian / Alaska Native - Speak only English Native:
80.3% (6)Foreign-born:
42.1% (7)
Asian - Speak only English Native:
40.3% (82)Foreign-born:
3.1% (20)
Asian - Speak another language Native:
61.6% (125)Foreign-born:
97.7% (626)
Other race - Speak only English Native:
42.9% (141)Foreign-born:
13.7% (8)
Other race - Speak another language Native:
56.7% (187)Foreign-born:
77.7% (43)
Two or more races - Speak only English Native:
72.4% (1,046)Foreign-born:
31.9% (47)
Two or more races - Speak another language Native:
31.7% (458)Foreign-born:
70.6% (105)
White alone - Speak only English Native:
96.8% (3,439)Foreign-born:
63.3% (38)
White alone - Speak another language Native:
3.1% (111)Foreign-born:
36.7% (22)
Hispanic or Latino - Speak only English Native:
59.6% (770)Foreign-born:
9.2% (8)
Hispanic or Latino - Speak another language Native:
40.6% (524)Foreign-born:
90.9% (81)
Foreign-born residents in Fort Meade 957 residents are foreign born (5.7% Asia , 1.3% Latin America , 1.1% Africa ).
This city:
9.5%Maryland:
15.7%
Marital status for residents in Fort Meade Marital status - White (Caucasian) population 15 years and over
Males 27.4% Never married66.5% Now married0.8% Separated0.9% Widowed4.5% DivorcedFemales 20.4% Never married72.8% Now married0.8% Separated0.0% Widowed6.1% DivorcedWomen who gave birth in the past 12 months Now married:
100.0% (130)Unmarried:
0.0% (0)
Women who did not give birth in the past 12 months Now married:
72.9% (884)Unmarried:
27.1% (329)
Marital status - Black or African American population 15 years and over
Males 28.2% Never married71.2% Now married0.0% Separated0.0% Widowed0.6% DivorcedFemales 33.1% Never married46.3% Now married3.2% Separated1.9% Widowed15.4% DivorcedWomen who gave birth in the past 12 months Now married:
100.0% (34)Unmarried:
0.0% (0)
Women who did not give birth in the past 12 months Now married:
53.9% (347)Unmarried:
46.1% (296)
Marital status - American Indian / Alaska Native population 15 years and over
Males 100.0% Never married0.0% Now married0.0% Separated0.0% Widowed0.0% DivorcedFemales 100.0% Never married0.0% Now married0.0% Separated0.0% Widowed0.0% DivorcedWomen who did not give birth in the past 12 months Now married:
0.0% (0)Unmarried:
100.0% (15)
Marital status - Asian population 15 years and over
Males 23.8% Never married76.2% Now married0.0% Separated0.0% Widowed0.0% DivorcedFemales 24.4% Never married74.0% Now married0.0% Separated1.5% Widowed0.0% DivorcedWomen who gave birth in the past 12 months Now married:
100.0% (22)Unmarried:
0.0% (0)
Women who did not give birth in the past 12 months Now married:
70.9% (247)Unmarried:
29.1% (101)
Marital status - Native Hawaiian / Pacific Islander population 15 years and over
Males 0.0% Never married100.0% Now married0.0% Separated0.0% Widowed0.0% DivorcedFemales 0.0% Never married100.0% Now married0.0% Separated0.0% Widowed0.0% DivorcedWomen who did not give birth in the past 12 months Now married:
100.0% (20)Unmarried:
0.0% (0)
Marital status - Other race population 15 years and over
Males 37.3% Never married62.7% Now married0.0% Separated0.0% Widowed0.0% DivorcedFemales 18.1% Never married76.7% Now married0.0% Separated0.0% Widowed5.2% DivorcedWomen who did not give birth in the past 12 months Now married:
80.9% (106)Unmarried:
19.1% (25)
Marital status - Two or more races population 15 years and over
Males 45.6% Never married50.6% Now married0.0% Separated0.0% Widowed3.7% DivorcedFemales 16.8% Never married78.9% Now married0.0% Separated0.0% Widowed4.3% DivorcedWomen who gave birth in the past 12 months Now married:
100.0% (81)Unmarried:
0.0% (0)
Women who did not give birth in the past 12 months Now married:
76.2% (291)Unmarried:
23.8% (91)
Marital status - White alone, not Hispanic / Latino population 15 years and over
Males 24.8% Never married68.7% Now married0.8% Separated0.8% Widowed4.9% DivorcedFemales 20.9% Never married71.7% Now married0.9% Separated0.0% Widowed6.6% DivorcedWomen who gave birth in the past 12 months Now married:
100.0% (113)Unmarried:
0.0% (0)
Women who did not give birth in the past 12 months Now married:
72.2% (830)Unmarried:
27.8% (320)
Marital status - Hispanic or Latino population 15 years and over
Males 43.4% Never married55.6% Now married0.0% Separated1.0% Widowed0.0% DivorcedFemales 13.4% Never married79.8% Now married0.0% Separated1.6% Widowed5.2% DivorcedWomen who gave birth in the past 12 months Now married:
100.0% (56)Unmarried:
0.0% (0)
Women who did not give birth in the past 12 months Now married:
82.2% (323)Unmarried:
17.8% (70)
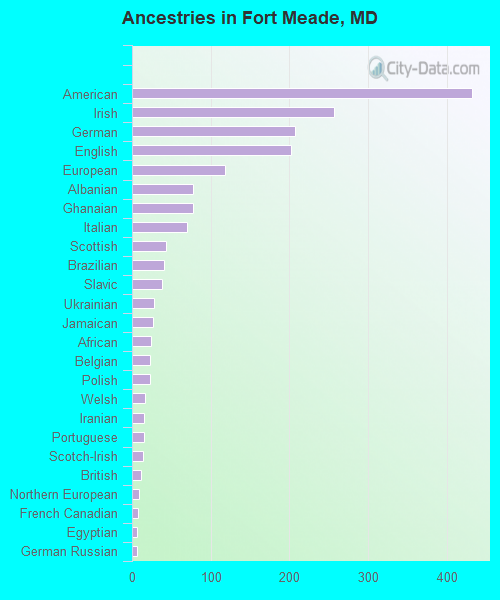
Ancestries in Fort Meade
432 8.7% American257 5.2% Irish207 4.2% German202 4.1% English118 2.4% European78 1.6% Albanian78 1.6% Ghanaian70 1.4% Italian43 0.9% Scottish41 0.8% Brazilian38 0.8% Slavic28 0.6% Ukrainian27 0.5% Jamaican24 0.5% African23 0.5% Belgian23 0.5% Polish16 0.3% Welsh15 0.3% Iranian15 0.3% Portuguese14 0.3% Scotch-Irish12 0.2% British9 0.2% Northern European7 0.1% French Canadian6 0.1% Egyptian6 0.1% German Russian6 0.1% British West Indian5 0.1% Jordanian4 0.08% Moroccan4 0.08% Guyanese4 0.08% Macedonian
Geographical mobility in Fort Meade Same house 1 year ago 3,034 67.5% White (Caucasian)1,650 63.0% Black or African American14 61.8% American Indian / Alaska Native709 82.5% Asian4 12.3% Native Hawaiian / Pacific Islander254 60.7% Other race1,294 71.2% Two or more races2,680 66.5% White alone, not Hispanic / Latino1,141 70.6% Hispanic or LatinoMoved within same county 153 3.4% White / Caucasian182 6.9% Black or African American10 1.1% Asian52 12.4% Other race75 4.1% Two or more races153 3.8% White alone, not Hispanic / Latino124 7.7% Hispanic or LatinoMoved within same state 146 3.2% White / Caucasian352 13.4% Black or African American29 3.4% Asian49 2.7% Two or more races171 4.2% White alone, not Hispanic / Latino6 0.4% Hispanic or LatinoMoved from different state 1,059 23.6% White / Caucasian354 13.5% Black or African American6 26.4% American Indian / Alaska Native30 3.4% Asian31 87.3% Native Hawaiian / Pacific Islander9 2.2% Other race229 12.6% Two or more races947 23.5% White alone, not Hispanic / Latino161 10.0% Hispanic or LatinoMoved from abroad 21 0.5% White15 0.6% Black or African American6 0.7% Asian58 13.8% Other race112 6.1% Two or more races23 0.6% White alone, not Hispanic / Latino109 6.7% Hispanic or Latino
Children Nativity (place of birth) in Fort Meade
Children under 6 years - Living with two parents Both parents native 1,177 100.0% NativeBoth parents foreign-born 34 100.0% NativeOne native, one foreign-born parent 78 100.0% NativeChildren under 6 years - Living with one parent Native parent 144 100.0% NativeChildren 6 to 17 years - Living with two parents Both parents native 1,207 99.1% Native11 0.9% Foreign-bornBoth parents foreign-born 159 94.7% Native9 5.3% Foreign-bornOne native, one foreign-born parent 130 89.6% Native15 10.4% Foreign-bornChildren 6 to 17 years - Living with one parent Native parent 237 100.0% Native0 0.0% Foreign-bornForeign-born parent 10 52.0% Native9 48.0% Foreign-born
Grandparents responsible for own grandchildren in Fort Meade
Grandparents (30 to 59 years) White / Caucasian 6 36.8% Responsible for grandchildren10 63.2% Not responsible for grandchildrenBlack or African American 10 100.0% Not responsible for grandchildrenWhite alone, not Hispanic / Latino 6 36.2% Responsible for grandchildren10 63.8% Not responsible for grandchildrenGrandparents (60 years and over) White / Caucasian 18 100.0% Not responsible for grandchildrenBlack or African American 17 15.1% Responsible for grandchildren94 84.9% Not responsible for grandchildrenWhite alone, not Hispanic / Latino 19 100.0% Not responsible for grandchildren