Races in Fort Lewis, Washington (WA) Detailed Stats
Data:
Races - White alone (%)
Races - White alone (% change since 2000)
Races - Black alone (%)
Races - Black alone (% change since 2000)
Races - American Indian alone (%)
Races - American Indian alone (% change since 2000)
Races - Asian alone (%)
Races - Asian alone (% change since 2000)
Races - Hispanic (%)
Races - Hispanic (% change since 2000)
Races - Native Hawaiian and Other Pacific Islander alone (%)
Races - Native Hawaiian and Other Pacific Islander alone (% change since 2000)
Races - Two or more races(%)
Races - Two or more races(% change since 2000)
Races - Other race alone (%)
Races - Other race alone (% change since 2000)
Racial diversity
Place of birth - Born in state of residence (%)
Place of birth - Born in state of residence (%) - White
Place of birth - Born in state of residence (%) - Black or African American
Place of birth - Born in state of residence (%) - Asian
Place of birth - Born in state of residence (%) - Hispanic or Latino
Place of birth - Born in state of residence (%) - American Indian and Alaska Native
Place of birth - Born in state of residence (%) - Multirace
Place of birth - Born in state of residence (%) - Other Race
Place of birth - Born in other state (%)
Place of birth - Born in other state (%) - White
Place of birth - Born in other state (%) - Black or African American
Place of birth - Born in other state (%) - Asian
Place of birth - Born in other state (%) - Hispanic or Latino
Place of birth - Born in other state (%) - American Indian and Alaska Native
Place of birth - Born in other state (%) - Multirace
Place of birth - Born in other state (%) - Other Race
Place of birth - Native, outside of US (%)
Place of birth - Native, outside of US (%) - White
Place of birth - Native, outside of US (%) - Black or African American
Place of birth - Native, outside of US (%) - Asian
Place of birth - Native, outside of US (%) - Hispanic or Latino
Place of birth - Native, outside of US (%) - American Indian and Alaska Native
Place of birth - Native, outside of US (%) - Multirace
Place of birth - Native, outside of US (%) - Other Race
Place of birth - Foreign born (%)
Place of birth - Foreign born (%) - White
Place of birth - Foreign born (%) - Black or African American
Place of birth - Foreign born (%) - Asian
Place of birth - Foreign born (%) - Hispanic or Latino
Place of birth - Foreign born (%) - American Indian and Alaska Native
Place of birth - Foreign born (%) - Multirace
Place of birth - Foreign born (%) - Other Race
Residents speaking English at home (%)
Residents speaking English at home - Born in the United States (%)
Residents speaking English at home - Native, born elsewhere (%)
Residents speaking English at home - Foreign born (%)
Residents speaking Spanish at home (%)
Residents speaking Spanish at home - Born in the United States (%)
Residents speaking Spanish at home - Native, born elsewhere (%)
Residents speaking Spanish at home - Foreign born (%)
Residents speaking other language at home (%)
Residents speaking other language at home - Born in the United States (%)
Residents speaking other language at home - Native, born elsewhere (%)
Residents speaking other language at home - Foreign born (%)
Marital status - Never married (%)
Marital status - Now married (%)
Marital status - Separated (%)
Marital status - Widowed (%)
Marital status - Divorced (%)
Ancestries Reported - Arab (%)
Ancestries Reported - Czech (%)
Ancestries Reported - Danish (%)
Ancestries Reported - Dutch (%)
Ancestries Reported - English (%)
Ancestries Reported - French (%)
Ancestries Reported - French Canadian (%)
Ancestries Reported - German (%)
Ancestries Reported - Greek (%)
Ancestries Reported - Hungarian (%)
Ancestries Reported - Irish (%)
Ancestries Reported - Italian (%)
Ancestries Reported - Lithuanian (%)
Ancestries Reported - Norwegian (%)
Ancestries Reported - Polish (%)
Ancestries Reported - Portuguese (%)
Ancestries Reported - Russian (%)
Ancestries Reported - Scotch-Irish (%)
Ancestries Reported - Scottish (%)
Ancestries Reported - Slovak (%)
Ancestries Reported - Subsaharan African (%)
Ancestries Reported - Swedish (%)
Ancestries Reported - Swiss (%)
Ancestries Reported - Ukrainian (%)
Ancestries Reported - United States (%)
Ancestries Reported - Welsh (%)
Ancestries Reported - West Indian (%)
Ancestries Reported - Other (%)
Geographical mobility - Same house 1 year ago (%)
Geographical mobility - Same house 1 year ago (%) - White
Geographical mobility - Same house 1 year ago (%) - Black or African American
Geographical mobility - Same house 1 year ago (%) - Asian
Geographical mobility - Same house 1 year ago (%) - Hispanic or Latino
Geographical mobility - Same house 1 year ago (%) - American Indian and Alaska Native
Geographical mobility - Same house 1 year ago (%) - Multirace
Geographical mobility - Same house 1 year ago (%) - Other Race
Geographical mobility - Moved within same county (%)
Geographical mobility - Moved within same county (%) - White
Geographical mobility - Moved within same county (%) - Black or African American
Geographical mobility - Moved within same county (%) - Asian
Geographical mobility - Moved within same county (%) - Hispanic or Latino
Geographical mobility - Moved within same county (%) - American Indian and Alaska Native
Geographical mobility - Moved within same county (%) - Multirace
Geographical mobility - Moved within same county (%) - Other Race
Geographical mobility - Moved from different county within same state (%)
Geographical mobility - Moved from different county within same state (%) - White
Geographical mobility - Moved from different county within same state (%) - Black or African American
Geographical mobility - Moved from different county within same state (%) - Asian
Geographical mobility - Moved from different county within same state (%) - Hispanic or Latino
Geographical mobility - Moved from different county within same state (%) - American Indian and Alaska Native
Geographical mobility - Moved from different county within same state (%) - Multirace
Geographical mobility - Moved from different county within same state (%) - Other Race
Geographical mobility - Moved from different state (%)
Geographical mobility - Moved from different state (%) - White
Geographical mobility - Moved from different state (%) - Black or African American
Geographical mobility - Moved from different state (%) - Asian
Geographical mobility - Moved from different state (%) - Hispanic or Latino
Geographical mobility - Moved from different state (%) - American Indian and Alaska Native
Geographical mobility - Moved from different state (%) - Multirace
Geographical mobility - Moved from different state (%) - Other Race
Geographical mobility - Moved from abroad (%)
Geographical mobility - Moved from abroad (%) - White
Geographical mobility - Moved from abroad (%) - Black or African American
Geographical mobility - Moved from abroad (%) - Asian
Geographical mobility - Moved from abroad (%) - Hispanic or Latino
Geographical mobility - Moved from abroad (%) - American Indian and Alaska Native
Geographical mobility - Moved from abroad (%) - Multirace
Geographical mobility - Moved from abroad (%) - Other Race
Place of birth for the foreign-born population - Ireland (%)
Place of birth for the foreign-born population - Denmark (%)
Place of birth for the foreign-born population - Norway (%)
Place of birth for the foreign-born population - Sweden (%)
Place of birth for the foreign-born population - United Kingdom (%)
Place of birth for the foreign-born population - England (%)
Place of birth for the foreign-born population - Scotland (%)
Place of birth for the foreign-born population - Other Northern Europe (%)
Place of birth for the foreign-born population - Austria (%)
Place of birth for the foreign-born population - Belgium (%)
Place of birth for the foreign-born population - France (%)
Place of birth for the foreign-born population - Germany (%)
Place of birth for the foreign-born population - Netherlands (%)
Place of birth for the foreign-born population - Switzerland (%)
Place of birth for the foreign-born population - Other Western Europe (%)
Place of birth for the foreign-born population - Greece (%)
Place of birth for the foreign-born population - Italy (%)
Place of birth for the foreign-born population - Portugal (%)
Place of birth for the foreign-born population - Spain (%)
Place of birth for the foreign-born population - Other Southern Europe (%)
Place of birth for the foreign-born population - Albania (%)
Place of birth for the foreign-born population - Belarus (%)
Place of birth for the foreign-born population - Bosnia and Herzegovina (%)
Place of birth for the foreign-born population - Bulgaria (%)
Place of birth for the foreign-born population - Croatia (%)
Place of birth for the foreign-born population - Czechoslovakia (%)
Place of birth for the foreign-born population - Hungary (%)
Place of birth for the foreign-born population - Latvia (%)
Place of birth for the foreign-born population - Lithuania (%)
Place of birth for the foreign-born population - North Macedonia (Macedonia) (%)
Place of birth for the foreign-born population - Moldova (%)
Place of birth for the foreign-born population - Poland (%)
Place of birth for the foreign-born population - Romania (%)
Place of birth for the foreign-born population - Russia (%)
Place of birth for the foreign-born population - Serbia (%)
Place of birth for the foreign-born population - Ukraine (%)
Place of birth for the foreign-born population - Other Eastern Europe (%)
Place of birth for the foreign-born population - China (%)
Place of birth for the foreign-born population - Hong Kong (%)
Place of birth for the foreign-born population - Taiwan (%)
Place of birth for the foreign-born population - Japan (%)
Place of birth for the foreign-born population - Korea (%)
Place of birth for the foreign-born population - Other Eastern Asia (%)
Place of birth for the foreign-born population - Afghanistan (%)
Place of birth for the foreign-born population - Bangladesh (%)
Place of birth for the foreign-born population - India (%)
Place of birth for the foreign-born population - Iran (%)
Place of birth for the foreign-born population - Kazakhstan (%)
Place of birth for the foreign-born population - Nepal (%)
Place of birth for the foreign-born population - Pakistan (%)
Place of birth for the foreign-born population - Sri Lanka (%)
Place of birth for the foreign-born population - Uzbekistan (%)
Place of birth for the foreign-born population - Other South Central Asia (%)
Place of birth for the foreign-born population - Burma (%)
Place of birth for the foreign-born population - Cambodia (%)
Place of birth for the foreign-born population - Indonesia (%)
Place of birth for the foreign-born population - Laos (%)
Place of birth for the foreign-born population - Malaysia (%)
Place of birth for the foreign-born population - Philippines (%)
Place of birth for the foreign-born population - Singapore (%)
Place of birth for the foreign-born population - Thailand (%)
Place of birth for the foreign-born population - Vietnam (%)
Place of birth for the foreign-born population - Other South Eastern Asia (%)
Place of birth for the foreign-born population - Armenia (%)
Place of birth for the foreign-born population - Iraq (%)
Place of birth for the foreign-born population - Israel (%)
Place of birth for the foreign-born population - Jordan (%)
Place of birth for the foreign-born population - Kuwait (%)
Place of birth for the foreign-born population - Lebanon (%)
Place of birth for the foreign-born population - Saudi Arabia (%)
Place of birth for the foreign-born population - Syria (%)
Place of birth for the foreign-born population - Turkey (%)
Place of birth for the foreign-born population - Yemen (%)
Place of birth for the foreign-born population - Other Western Asia (%)
Place of birth for the foreign-born population - Eritrea (%)
Place of birth for the foreign-born population - Ethiopia (%)
Place of birth for the foreign-born population - Kenya (%)
Place of birth for the foreign-born population - Somalia (%)
Place of birth for the foreign-born population - Uganda (%)
Place of birth for the foreign-born population - Zimbabwe (%)
Place of birth for the foreign-born population - Other Eastern Africa (%)
Place of birth for the foreign-born population - Cameroon (%)
Place of birth for the foreign-born population - Congo (%)
Place of birth for the foreign-born population - Democratic Republic of Congo (Zaire) (%)
Place of birth for the foreign-born population - Other Middle Africa (%)
Place of birth for the foreign-born population - Egypt (%)
Place of birth for the foreign-born population - Morocco (%)
Place of birth for the foreign-born population - Sudan (%)
Place of birth for the foreign-born population - Other Northern Africa (%)
Place of birth for the foreign-born population - South Africa (%)
Place of birth for the foreign-born population - Other Southern Africa (%)
Place of birth for the foreign-born population - Cabo Verde (%)
Place of birth for the foreign-born population - Ghana (%)
Place of birth for the foreign-born population - Liberia (%)
Place of birth for the foreign-born population - Nigeria (%)
Place of birth for the foreign-born population - Senegal (%)
Place of birth for the foreign-born population - Sierra Leone (%)
Place of birth for the foreign-born population - Other Western Africa (%)
Place of birth for the foreign-born population - Australia (%)
Place of birth for the foreign-born population - New Zealand (%)
Place of birth for the foreign-born population - Fiji (%)
Place of birth for the foreign-born population - Micronesia (%)
Place of birth for the foreign-born population - Bahamas (%)
Place of birth for the foreign-born population - Barbados (%)
Place of birth for the foreign-born population - Cuba (%)
Place of birth for the foreign-born population - Dominica (%)
Place of birth for the foreign-born population - Dominican Republic (%)
Place of birth for the foreign-born population - Grenada (%)
Place of birth for the foreign-born population - Haiti (%)
Place of birth for the foreign-born population - Jamaica (%)
Place of birth for the foreign-born population - St. Vincent and the Grenadines (%)
Place of birth for the foreign-born population - Trinidad and Tobago (%)
Place of birth for the foreign-born population - West Indies (%)
Place of birth for the foreign-born population - Other Caribbean (%)
Place of birth for the foreign-born population - Belize (%)
Place of birth for the foreign-born population - Costa Rica (%)
Place of birth for the foreign-born population - El Salvador (%)
Place of birth for the foreign-born population - Guatemala (%)
Place of birth for the foreign-born population - Honduras (%)
Place of birth for the foreign-born population - Mexico (%)
Place of birth for the foreign-born population - Nicaragua (%)
Place of birth for the foreign-born population - Panama (%)
Place of birth for the foreign-born population - Other Central America (%)
Place of birth for the foreign-born population - Argentina (%)
Place of birth for the foreign-born population - Bolivia (%)
Place of birth for the foreign-born population - Brazil (%)
Place of birth for the foreign-born population - Chile (%)
Place of birth for the foreign-born population - Colombia (%)
Place of birth for the foreign-born population - Ecuador (%)
Place of birth for the foreign-born population - Guyana (%)
Place of birth for the foreign-born population - Peru (%)
Place of birth for the foreign-born population - Uruguay (%)
Place of birth for the foreign-born population - Venezuela (%)
Place of birth for the foreign-born population - Other South America (%)
Place of birth for the foreign-born population - Canada (%)
Place of birth for the foreign-born population - Other Northern America (%)
Place of birth for the foreign-born population - Other (%)
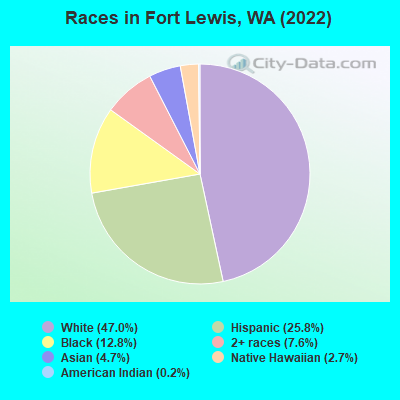
According to 2022 data, the most numerous races in Fort Lewis, WA are White alone (6,380 residents), Hispanic (3,501 residents), and Asian alone (632 residents). 77.9% of Fort Lewis residents speak English at home. 7.8% of Fort Lewis, WA residents are foreign-born (2.5% born in Asia, 2.3% born in Latin America, 1.2% born in Africa), which is 93.0% less than the foreign-born rate of 15.0% across the entire state of Washington.
Race distribution in Fort Lewis
2000 2022
4,652,490 78.9% White alone 441,509 7.5% Hispanic 319,401 5.4% Asian alone 184,631 3.1% Black alone 175,926 3.0% Two or more races 85,396 1.4% American Indian alone 22,779 0.4% Native Hawaiian and Other 11,989 0.2% Other race alone
4,941,456 63.5% White alone 1,093,313 14.0% Hispanic 755,832 9.7% Asian alone 523,448 6.7% Two or more races 299,537 3.8% Black alone 69,024 0.9% American Indian alone 52,231 0.7% Native Hawaiian and Other 50,945 0.7% Other race alone
Income and house value in Fort Lewis Median household income in 2022 $55,253 White non-Hispanic householders$51,599 Black householders$47,547 Asian householders$63,920 Native Hawaiian and other Pacific Islander householders$46,852 Some other race householders$58,367 Two or more races householders$53,342 Hispanic or Latino race householdersMedian 2022 house value $-638,437,546 White Non-Hispanic householders$-349,902,533 Black or African American householders$-1,022,792,021 Hispanic or Latino householders
Median age by race in Fort Lewis
23.1 Median age for White residents22.9 23.6 24.3 Median age for Black or African American residents25.1 20.3 20.0 Median age for American Indian / Alaska Native residents23.2 19.3 24.4 Median age for Asian residents23.7 26.8 25.4 Median age for Native Hawaiian / Pacific Islander residents29.5 23.4 24.2 Median age for Other race residents23.0 25.5 23.6 Median age for Two or more races residents23.2 23.3 23.0 Median age for White alone residents22.8 23.5 22.8 Median age for Hispanic or Latino residents22.6 23.3
Owner/renter occupied households by race in Fort Lewis
House owners and renters - White residents 1,870 100.0% Renter occupiedHouse owners and renters - Black or African American residents 47 8.2% Owner occupied526 91.8% Renter occupiedHouse owners and renters - American Indian / Alaska Native residents 19 100.0% Renter occupiedHouse owners and renters - Asian residents 133 100.0% Renter occupiedHouse owners and renters - Native Hawaiian / Pacific Islander residents 76 100.0% Renter occupiedHouse owners and renters - Other race residents 175 100.0% Renter occupiedHouse owners and renters - Two or more races residents 552 100.0% Renter occupiedHouse owners and renters - White alone residents 1,676 100.0% Renter occupiedHouse owners and renters - Hispanic or Latino residents 717 100.0% Renter occupied
Language usage in Fort Lewis
English speakers - Total 77.9% of residents of Fort Lewis speak English at home.
12.8% of residents speak Spanish at home 1,052 73.2% Speak English very well386 26.8% Speak English less than very well8.8% of residents speak other language at home 757 77.1% Speak English very well225 22.9% Speak English less than very well
English speakers - Born in the United States 86.1% of residents of Fort Lewis speak English at home.
11.2% of residents speak Spanish at home 715 73.3% Speak English very well261 26.7% Speak English less than very well2.9% of residents speak other language at home 188 73.2% Speak English very well69 26.8% Speak English less than very well
English speakers - Native, born elsewhere 40.5% of residents of Fort Lewis speak English at home.
18.8% of residents speak Spanish at home 50 40.7% Speak English very well73 59.3% Speak English less than very well31.1% of residents speak other language at home 204 100.0% Speak English very well
English speakers - Foreign-born 21.0% of residents of Fort Lewis speak English at home.
26.5% of residents speak Spanish at home 252 89.0% Speak English very well31 11.0% Speak English less than very well50.4% of residents speak other language at home 376 69.8% Speak English very well163 30.2% Speak English less than very well
White (Caucasian) - Speak only English Native:
94.0% (5,952)Foreign-born:
10.1% (8)
White (Caucasian) - Speak another language Native:
4.9% (309)Foreign-born:
93.6% (70)
Black or African American - Speak only English Native:
86.7% (1,137)Foreign-born:
37.9% (109)
Black or African American - Speak another language Native:
14.1% (185)Foreign-born:
33.2% (96)
Asian - Speak only English Native:
88.6% (262)Foreign-born:
12.9% (42)
Asian - Speak another language Native:
14.7% (43)Foreign-born:
84.9% (272)
Native Hawaiian / Pacific Islander - Speak another language Native:
82.0% (185)Foreign-born:
91.9% (65)
Other race - Speak another language Native:
69.8% (354)Foreign-born:
99.0% (51)
Two or more races - Speak only English Native:
59.9% (863)Foreign-born:
3.0% (12)
Two or more races - Speak another language Native:
43.7% (630)Foreign-born:
100.0% (410)
White alone - Speak only English Native:
97.3% (5,181)Foreign-born:
14.2% (8)
White alone - Speak another language Native:
2.6% (138)Foreign-born:
92.6% (52)
Hispanic or Latino - Speak only English Native:
54.6% (1,309)Foreign-born:
3.0% (10)
Hispanic or Latino - Speak another language Native:
44.3% (1,063)Foreign-born:
98.1% (314)
Foreign-born residents in Fort Lewis 1,054 residents are foreign born (2.5% Asia , 2.3% Latin America , 1.2% Africa ).
This city:
7.8%Washington:
14.9%
Marital status for residents in Fort Lewis Marital status - White (Caucasian) population 15 years and over
Males 47.6% Never married50.5% Now married0.7% Separated0.0% Widowed1.2% DivorcedFemales 13.8% Never married82.7% Now married0.4% Separated1.9% Widowed1.2% DivorcedWomen who gave birth in the past 12 months Now married:
97.5% (368)Unmarried:
2.5% (9)
Women who did not give birth in the past 12 months Now married:
80.3% (1,306)Unmarried:
19.7% (321)
Marital status - Black or African American population 15 years and over
Males 45.6% Never married45.2% Now married0.0% Separated0.0% Widowed9.3% DivorcedFemales 49.9% Never married50.1% Now married0.0% Separated0.0% Widowed0.0% DivorcedWomen who gave birth in the past 12 months Now married:
71.4% (29)Unmarried:
28.6% (12)
Women who did not give birth in the past 12 months Now married:
47.6% (169)Unmarried:
52.4% (186)
Marital status - American Indian / Alaska Native population 15 years and over
Males 100.0% Never married0.0% Now married0.0% Separated0.0% Widowed0.0% DivorcedFemales 61.8% Never married38.2% Now married0.0% Separated0.0% Widowed0.0% DivorcedWomen who did not give birth in the past 12 months Now married:
38.2% (13)Unmarried:
61.8% (21)
Marital status - Asian population 15 years and over
Males 70.8% Never married29.2% Now married0.0% Separated0.0% Widowed0.0% DivorcedFemales 19.5% Never married47.0% Now married0.0% Separated0.0% Widowed33.5% DivorcedWomen who gave birth in the past 12 months Now married:
100.0% (10)Unmarried:
0.0% (0)
Women who did not give birth in the past 12 months Now married:
44.2% (87)Unmarried:
55.8% (110)
Marital status - Native Hawaiian / Pacific Islander population 15 years and over
Males 51.2% Never married48.8% Now married0.0% Separated0.0% Widowed0.0% DivorcedFemales 2.1% Never married97.9% Now married0.0% Separated0.0% Widowed0.0% DivorcedWomen who did not give birth in the past 12 months Now married:
97.9% (104)Unmarried:
2.1% (2)
Marital status - Other race population 15 years and over
Males 50.6% Never married42.7% Now married6.6% Separated0.0% Widowed0.0% DivorcedFemales 12.0% Never married88.0% Now married0.0% Separated0.0% Widowed0.0% DivorcedWomen who gave birth in the past 12 months Now married:
100.0% (53)Unmarried:
0.0% (0)
Women who did not give birth in the past 12 months Now married:
84.9% (171)Unmarried:
15.1% (30)
Marital status - Two or more races population 15 years and over
Males 46.0% Never married54.0% Now married0.0% Separated0.0% Widowed0.0% DivorcedFemales 8.7% Never married81.6% Now married0.0% Separated8.2% Widowed1.6% DivorcedWomen who gave birth in the past 12 months Now married:
100.0% (61)Unmarried:
0.0% (0)
Women who did not give birth in the past 12 months Now married:
79.7% (492)Unmarried:
20.3% (125)
Marital status - White alone, not Hispanic / Latino population 15 years and over
Males 46.9% Never married51.3% Now married0.3% Separated0.0% Widowed1.5% DivorcedFemales 12.9% Never married85.4% Now married0.5% Separated0.0% Widowed1.1% DivorcedWomen who gave birth in the past 12 months Now married:
100.0% (275)Unmarried:
0.0% (0)
Women who did not give birth in the past 12 months Now married:
84.0% (1,158)Unmarried:
16.0% (220)
Marital status - Hispanic or Latino population 15 years and over
Males 44.6% Never married52.9% Now married2.5% Separated0.0% Widowed0.0% DivorcedFemales 16.4% Never married74.7% Now married0.0% Separated8.2% Widowed0.7% DivorcedWomen who gave birth in the past 12 months Now married:
94.0% (169)Unmarried:
6.0% (11)
Women who did not give birth in the past 12 months Now married:
70.4% (637)Unmarried:
29.6% (268)
Ancestries in Fort Lewis
396 6.5% Irish336 5.6% German315 5.2% English285 4.7% American178 2.9% African146 2.4% European95 1.6% Italian77 1.3% Norwegian63 1.0% Scottish55 0.9% Scandinavian43 0.7% Ethiopian42 0.7% Nigerian35 0.6% Scotch-Irish28 0.5% Portuguese27 0.4% Zimbabwean25 0.4% South African24 0.4% Austrian19 0.3% Czech19 0.3% Welsh18 0.3% British14 0.2% Armenian10 0.2% Dutch10 0.2% Jamaican9 0.1% French Canadian8 0.1% Danish8 0.1% Polish7 0.1% Hungarian5 0.08% Russian2 0.03% Haitian
Geographical mobility in Fort Lewis Same house 1 year ago 4,916 65.6% White (Caucasian)1,200 64.6% Black or African American70 90.3% American Indian / Alaska Native330 52.3% Asian354 100.0% Native Hawaiian / Pacific Islander482 78.7% Other race1,232 53.4% Two or more races4,048 65.1% White alone, not Hispanic / Latino2,257 66.8% Hispanic or LatinoMoved within same county 571 7.6% White / Caucasian113 6.1% Black or African American382 16.6% Two or more races505 8.1% White alone, not Hispanic / Latino222 6.6% Hispanic or LatinoMoved within same state 90 1.2% White / Caucasian27 4.4% Other race64 2.8% Two or more races94 1.5% White alone, not Hispanic / Latino78 2.3% Hispanic or LatinoMoved from different state 1,732 23.1% White / Caucasian508 27.3% Black or African American18 23.8% American Indian / Alaska Native183 29.1% Asian140 22.9% Other race298 12.9% Two or more races1,373 22.1% White alone, not Hispanic / Latino546 16.1% Hispanic or LatinoMoved from abroad 364 4.8% White224 12.0% Black or African American225 35.8% Asian268 11.6% Two or more races277 4.5% White alone, not Hispanic / Latino100 3.0% Hispanic or Latino
Children Nativity (place of birth) in Fort Lewis
Children under 6 years - Living with two parents Both parents native 1,791 100.0% NativeBoth parents foreign-born 114 84.4% Native21 15.6% Foreign-bornOne native, one foreign-born parent 194 100.0% NativeChildren under 6 years - Living with one parent Native parent 296 100.0% NativeForeign-born parent 14 100.0% NativeChildren 6 to 17 years - Living with two parents Both parents native 948 100.0% NativeBoth parents foreign-born 51 48.8% Native54 51.2% Foreign-bornOne native, one foreign-born parent 106 100.0% NativeChildren 6 to 17 years - Living with one parent Native parent 104 100.0% NativeForeign-born parent 120 50.3% Native118 49.7% Foreign-born