Races in Fort Bragg, North Carolina (NC) Detailed Stats
Ancestries, Foreign-born residents, place of birth

Recent posts about races in Fort Bragg, North Carolina on our local forum with over 2,400,000 registered users:
 | House Congressional District 7 Race (0 replies) |
| Fort Bragg to Fort Liberty (79 replies) |
| Apex, Fuquay Varina, Sanford, Fort Bragg Commute (6 replies) |
| Relocating to NC and commuting to Fayetteville (34 replies) |
| Would you pay higher property taxes to save the last remaining forests in the Triangle? (50 replies) |
| Why is Fayetteville treated like it does not exist? (162 replies) |
5.8% of Fort Bragg, NC residents are foreign-born (3.1% born in Latin America, 1.1% born in Asia, 1.0% born in Europe), which is 36.9% less than the foreign-born rate of 8.0% across the entire state of North Carolina.
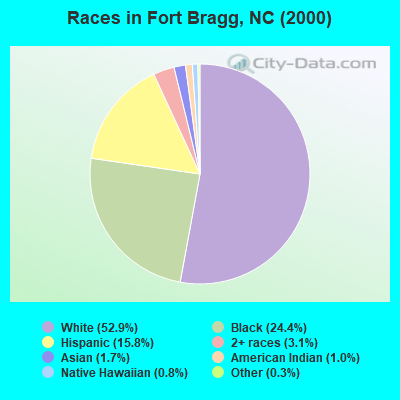
Race distribution in Fort Bragg

- 15,43652.9%White alone
- 7,11524.4%Black alone
- 4,60315.8%Hispanic
- 9193.1%Two or more races
- 5071.7%Asian alone
- 2811.0%American Indian alone
- 2450.8%Native Hawaiian and Other
Pacific Islander alone - 770.3%Other race alone
2000
2022
-
- 5,647,15570.2%White alone
- 1,723,30121.4%Black alone
- 378,9634.7%Hispanic
- 112,4161.4%Asian alone
- 95,3331.2%American Indian alone
- 79,9651.0%Two or more races
- 9,0150.1%Other race alone
- 3,1650.04%Native Hawaiian and Other
Pacific Islander alone

-
- 6,497,51960.7%White alone
- 2,155,65020.1%Black alone
- 1,114,79910.4%Hispanic
- 438,0614.1%Two or more races
- 341,0523.2%Asian alone
- 91,7580.9%American Indian alone
- 50,1800.5%Other race alone
- 9,9540.09%Native Hawaiian and Other
Pacific Islander alone

Income and house value in Fort Bragg
- Median household income in 2022
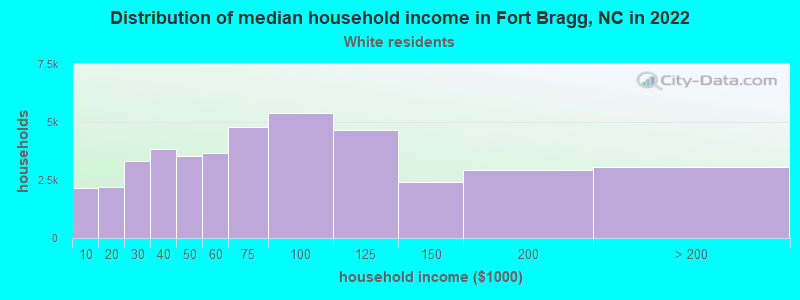
- $49,955White non-Hispanic householders
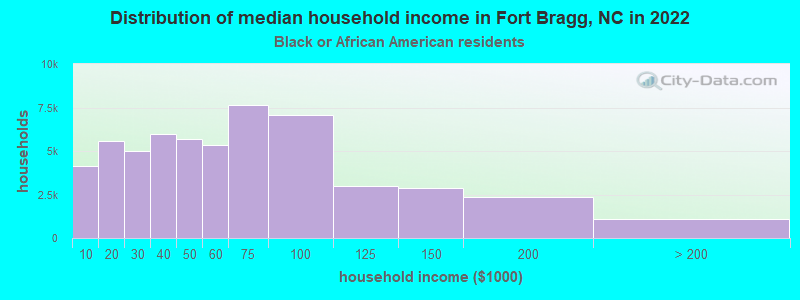
- $54,276Black householders
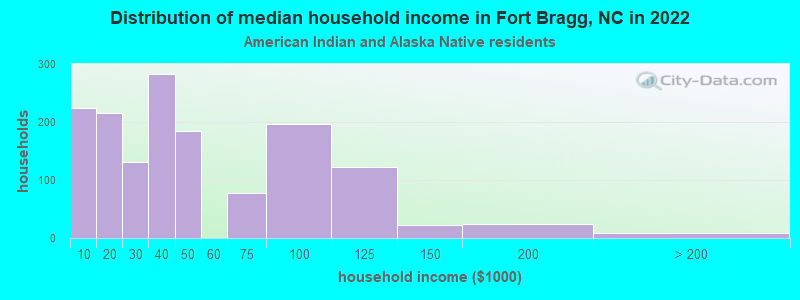
- $30,304American Indian and Alaska Native householders
- $56,571Asian householders
- $74,637Native Hawaiian and other Pacific Islander householders
- $40,508Some other race householders
- $35,142Two or more races householders
- $42,847Hispanic or Latino race householders
- Median 2022 house value
- $177,784White Non-Hispanic householders
- $167,932Black or African American householders
Household income for White non-Hispanic householders
Household income for Black householders
Household income for American Indian and Alaska Native householders
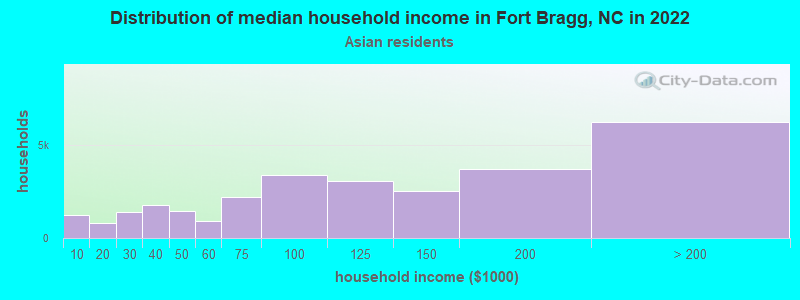
Household income for Asian householders
Household income for Native Hawaiian and other Pacific Islander householders

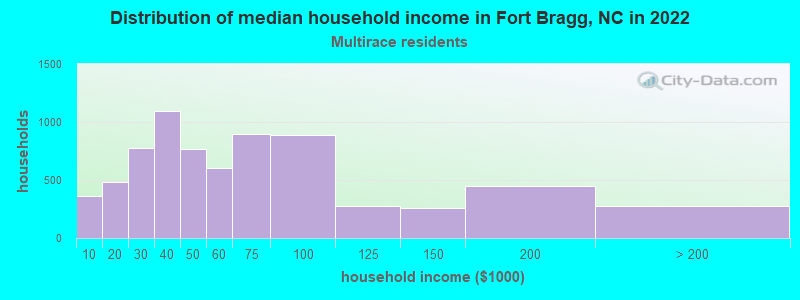
Household income for Two or more races householders
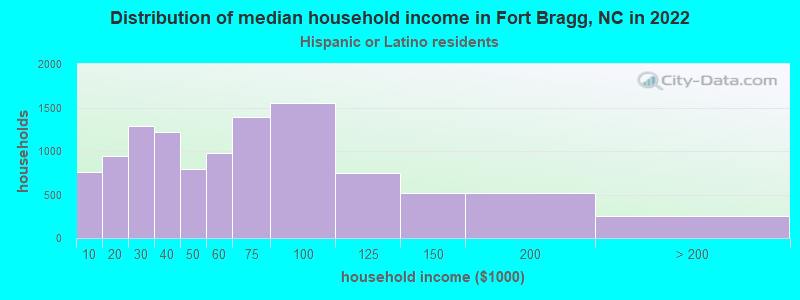
Household income for Hispanic or Latino race householders
Foreign-born residents in Fort Bragg
1,705 residents are foreign born (3.1% Latin America, 1.1% Asia, 1.0% Europe).
| This city: | 5.8% |
| North Carolina: | 5.3% |
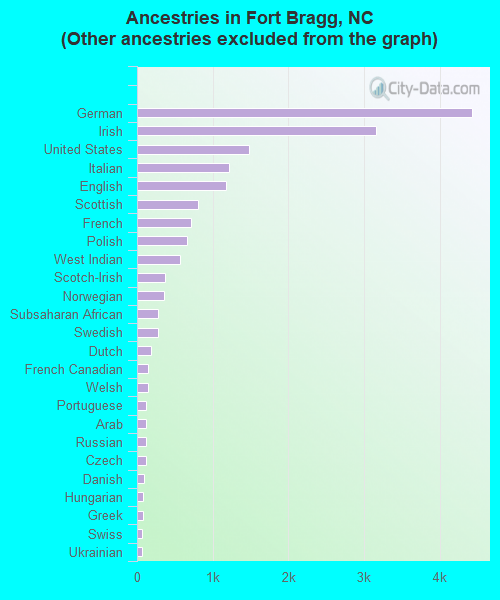
Ancestries in Fort Bragg

- 14,43146.1%Other
- 4,43214.2%German
- 3,15810.1%Irish
- 1,4854.7%United States
- 1,2133.9%Italian
- 1,1803.8%English
- 8092.6%Scottish
- 7092.3%French
- 6612.1%Polish
- 5721.8%West Indian
- 3691.2%Scotch-Irish
- 3601.2%Norwegian
- 2810.9%Subsaharan African
- 2800.9%Swedish
- 1840.6%Dutch
- 1470.5%French Canadian
- 1430.5%Welsh
- 1200.4%Portuguese
- 1190.4%Arab
- 1140.4%Russian
- 1130.4%Czech
- 910.3%Danish
- 850.3%Hungarian
- 810.3%Greek
- 640.2%Swiss
- 630.2%Ukrainian
- 310.10%Slovak
- 80.03%Lithuanian
Zip codes: 28307.