Races in Forestville, Maryland (MD) Detailed Stats
Ancestries, Foreign-born residents, place of birth
Settings
X


Recent posts about races in Forestville, Maryland on our local forum with over 2,400,000 registered users:
 | What's the story with the white people in Prince George County? :) (192 replies) |
| Relocating to DC: Need suburb recommendations (14 replies) |
| Moving To The Maryland Suburbs of DC? START HERE! (412 replies) |
| Are young white people still moving to PG county? (78 replies) |
| Living in Wheaton, working in Forestville (3 replies) |
| The Infamous PG County "Mall Curse" (352 replies) |
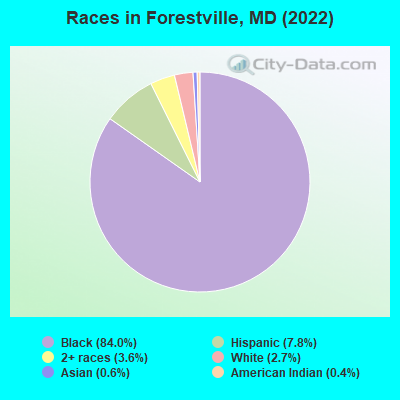
According to 2022 data, the most numerous races in Forestville, MD are White alone (272 residents), Black alone (8,557 residents), and Hispanic (794 residents). 87.8% of Forestville residents speak English at home. 7.1% of Forestville, MD residents are foreign-born (4.6% born in Latin America, 1.0% born in Africa), which is 126.9% less than the foreign-born rate of 16.0% across the entire state of Maryland.
Race distribution in Forestville
2000
2022

- 10,84585.3%Black alone
- 1,32210.4%White alone
- 2001.6%Two or more races
- 1671.3%Hispanic
- 1160.9%Asian alone
- 370.3%American Indian alone
- 130.1%Other race alone
- 70.06%Native Hawaiian and Other
Pacific Islander alone

-
- 8,55784.0%Black alone
- 7947.8%Hispanic
- 3673.6%Two or more races
- 2722.7%White alone
- 650.6%Asian alone
- 390.4%American Indian alone
2000
2022
-
- 3,286,54762.1%White alone
- 1,464,73527.7%Black alone
- 227,9164.3%Hispanic
- 209,7384.0%Asian alone
- 82,9461.6%Two or more races
- 13,3120.3%American Indian alone
- 9,3790.2%Other race alone
- 1,9130.04%Native Hawaiian and Other
Pacific Islander alone

-
- 2,906,49247.1%White alone
- 1,800,91429.2%Black alone
- 705,84211.4%Hispanic
- 401,8186.5%Asian alone
- 291,3174.7%Two or more races
- 46,9300.8%Other race alone
- 8,9300.1%American Indian alone
- 2,4170.04%Native Hawaiian and Other
Pacific Islander alone

Income and house value in Forestville
- Median household income in 2022
- $54,511White non-Hispanic householders
- $64,297Black householders
- $60,348Some other race householders
- $63,563Two or more races householders
- $68,754Hispanic or Latino race householders
- Median 2022 house value
- $329,763White Non-Hispanic householders
- $355,065Black or African American householders
- $295,465Asian householders
- $351,410Two or more races householders
- $386,551Hispanic or Latino householders
Household income for White non-Hispanic householders

Household income for Black householders

Household income for American Indian and Alaska Native householders

Household income for Asian householders

Household income for Some other race householders

Household income for Two or more races householders

Household income for Hispanic or Latino race householders

Median age by race in Forestville
- 64.2Median age for White residents
- 66.1Males
- 61.6Females
- 49.6Median age for Black or African American residents
- 43.9Males
- 50.4Females
- 20.7Median age for American Indian / Alaska Native residents
- 39.2Males
- 17.9Females
- 43.4Median age for Asian residents
- -668,430,334.4Males
- 43.7Females
- -571,600,480.8Median age for Native Hawaiian / Pacific Islander residents
- -720,061,021.4Males
- -760,942,760.2Females
- 23.5Median age for Other race residents
- 24.9Males
- 23.6Females
- 37.6Median age for Two or more races residents
- 33.3Males
- 44.9Females
- 63.4Median age for White alone residents
- 66.0Males
- 60.4Females
- 25.3Median age for Hispanic or Latino residents
- 29.3Males
- 17.7Females
Owner/renter occupied households by race in Forestville
- House owners and renters - White residents
- 18193.3%Owner occupied
- 136.7%Renter occupied
- House owners and renters - Black or African American residents
- 2,42265.4%Owner occupied
- 1,28334.6%Renter occupied
- House owners and renters - American Indian / Alaska Native residents
- 6471.2%Owner occupied
- 2628.8%Renter occupied
- House owners and renters - Asian residents
- 30100.0%Owner occupied
- House owners and renters - Other race residents
- 12787.5%Owner occupied
- 1812.5%Renter occupied
- House owners and renters - Two or more races residents
- 14758.9%Owner occupied
- 10241.1%Renter occupied
- House owners and renters - White alone residents
- 18993.4%Owner occupied
- 136.6%Renter occupied
- House owners and renters - Hispanic or Latino residents
- 14167.8%Owner occupied
- 6732.2%Renter occupied
Language usage in Forestville
- English speakers - Total
- 87.8% of residents of Forestville speak English at home.
- 5.8% of residents speak Spanish at home
- 17530.6%Speak English very well
- 39669.4%Speak English less than very well
- 4.0% of residents speak other language at home
- 30478.6%Speak English very well
- 8321.4%Speak English less than very well
- English speakers - Born in the United States
- 96.0% of residents of Forestville speak English at home.
- 1.7% of residents speak Spanish at home
- 8377.6%Speak English very well
- 2422.4%Speak English less than very well
- 1.6% of residents speak other language at home
- 102100.0%Speak English very well
All residents speak only English at home
- English speakers - Foreign-born
- 16.1% of residents of Forestville speak English at home.
- 49.5% of residents speak Spanish at home
- 174.7%Speak English very well
- 34395.3%Speak English less than very well
- 34.2% of residents speak other language at home
- 16666.7%Speak English very well
- 8333.3%Speak English less than very well
White (Caucasian) - Speak only English
| Native: | 78.5% (207) |
| Foreign-born: | 53.9% (13) |
White (Caucasian) - Speak another language
| Native: | 20.4% (54) |
| Foreign-born: | 57.3% (13) |
Black or African American - Speak only English
| Native: | 98.7% (7,638) |
| Foreign-born: | 35.8% (94) |
Black or African American - Speak another language
| Native: | 0.8% (66) |
| Foreign-born: | 64.5% (170) |
Other race - Speak another language
| Native: | 73.8% (155) |
| Foreign-born: | 100.0% (255) |
Two or more races - Speak only English
| Native: | 83.8% (319) |
| Foreign-born: | 84.5% (9) |
White alone - Speak only English
| Native: | 86.8% (207) |
| Foreign-born: | 38.4% (14) |
White alone - Speak another language
| Native: | 14.9% (35) |
| Foreign-born: | 62.0% (23) |
Hispanic or Latino - Speak another language
| Native: | 56.3% (201) |
| Foreign-born: | 100.0% (357) |
Foreign-born residents in Forestville
718 residents are foreign born (4.6% Latin America, 1.0% Africa).
| This city: | 7.1% |
| Maryland: | 15.7% |


Marital status for residents in Forestville
Marital status - White (Caucasian) population 15 years and over
- Males
- 23.1%Never married
- 41.5%Now married
- 0.0%Separated
- 13.1%Widowed
- 22.3%Divorced
- Females
- 43.0%Never married
- 28.5%Now married
- 0.0%Separated
- 20.0%Widowed
- 8.5%Divorced
Women who did not give birth in the past 12 months
| Now married: | 39.4% (11) |
| Unmarried: | 60.6% (17) |
Marital status - Black or African American population 15 years and over
- Males
- 50.3%Never married
- 27.5%Now married
- 4.0%Separated
- 4.3%Widowed
- 13.9%Divorced
- Females
- 44.5%Never married
- 23.8%Now married
- 2.4%Separated
- 12.7%Widowed
- 16.6%Divorced
Women who gave birth in the past 12 months
| Now married: | 40.2% (31) |
| Unmarried: | 59.8% (46) |
Women who did not give birth in the past 12 months
| Now married: | 18.9% (329) |
| Unmarried: | 81.1% (1,410) |
Marital status - American Indian / Alaska Native population 15 years and over
- Males
- 67.5%Never married
- 32.5%Now married
- 0.0%Separated
- 0.0%Widowed
- 0.0%Divorced
- Females
- 55.4%Never married
- 0.0%Now married
- 44.6%Separated
- 0.0%Widowed
- 0.0%Divorced
Women who did not give birth in the past 12 months
| Now married: | 44.6% (43) |
| Unmarried: | 55.4% (54) |
Marital status - Asian population 15 years and over
- Males
- 0.0%Never married
- 100.0%Now married
- 0.0%Separated
- 0.0%Widowed
- 0.0%Divorced
- Females
- 21.4%Never married
- 78.6%Now married
- 0.0%Separated
- 0.0%Widowed
- 0.0%Divorced
Women who did not give birth in the past 12 months
| Now married: | 76.0% (36) |
| Unmarried: | 24.0% (11) |
Marital status - Other race population 15 years and over
- Males
- 27.8%Never married
- 66.0%Now married
- 0.0%Separated
- 0.0%Widowed
- 6.2%Divorced
- Females
- 24.5%Never married
- 75.5%Now married
- 0.0%Separated
- 0.0%Widowed
- 0.0%Divorced
Women who gave birth in the past 12 months
| Now married: | 100.0% (9) |
| Unmarried: | 0.0% (0) |
Women who did not give birth in the past 12 months
| Now married: | 73.5% (83) |
| Unmarried: | 26.5% (30) |
Marital status - Two or more races population 15 years and over
- Males
- 88.0%Never married
- 12.0%Now married
- 0.0%Separated
- 0.0%Widowed
- 0.0%Divorced
- Females
- 56.0%Never married
- 19.6%Now married
- 2.7%Separated
- 5.3%Widowed
- 16.4%Divorced
Women who did not give birth in the past 12 months
| Now married: | 3.1% (4) |
| Unmarried: | 96.9% (137) |
Marital status - White alone, not Hispanic / Latino population 15 years and over
- Males
- 16.0%Never married
- 45.4%Now married
- 0.0%Separated
- 14.3%Widowed
- 24.4%Divorced
- Females
- 44.9%Never married
- 25.0%Now married
- 0.0%Separated
- 21.2%Widowed
- 9.0%Divorced
Women who did not give birth in the past 12 months
| Now married: | 20.8% (5) |
| Unmarried: | 79.2% (18) |
Marital status - Hispanic or Latino population 15 years and over
- Males
- 38.4%Never married
- 57.3%Now married
- 0.0%Separated
- 0.0%Widowed
- 4.2%Divorced
- Females
- 31.8%Never married
- 45.3%Now married
- 14.4%Separated
- 0.0%Widowed
- 8.5%Divorced
Women who gave birth in the past 12 months
| Now married: | 100.0% (8) |
| Unmarried: | 0.0% (0) |
Women who did not give birth in the past 12 months
| Now married: | 63.6% (115) |
| Unmarried: | 36.4% (66) |
Ancestries in Forestville

- 1251.8%African
- 791.2%American
- 771.1%Jamaican
- 550.8%German
- 300.4%Trinidadian and Tobagonian
- 220.3%French Canadian
- 220.3%Irish
- 210.3%English
- 110.2%Haitian

Geographical mobility in Forestville

- Same house 1 year ago
- 27994.6%White (Caucasian)
- 7,73890.9%Black or African American
- 32498.9%American Indian / Alaska Native
- 5582.5%Asian
- 53299.2%Other race
- 38393.4%Two or more races
- 25794.1%White alone, not Hispanic / Latino
- 78799.2%Hispanic or Latino

-
- Moved within same county
- 186.1%White / Caucasian
- 4895.7%Black or African American
- 10.1%Other race
- 30.8%Two or more races
- 207.4%White alone, not Hispanic / Latino
- 10.1%Hispanic or Latino

-
- Moved within same state
- 120.1%Black or African American
- 244.4%Other race
- 243.1%Hispanic or Latino

-
- Moved from different state
- 10.4%White / Caucasian
- 2302.7%Black or African American
- 710.4%Asian
- 10.2%White alone, not Hispanic / Latino
- 10.1%Hispanic or Latino

Children Nativity (place of birth) in Forestville
Place of birth for residents in Forestville
![Place of birth for the foreign-born population - Regions]()
- 503Americas
- 503Latin America
- 363Central America
- 138Caribbean
- 115Africa
- 59Asia
- 59South Eastern Asia
- 54Western Africa
- 44Middle Africa
- 40Europe
- 23Western Europe
- 17Eastern Europe
- 15Eastern Africa
- 1South America

![Place of birth for the foreign-born population - Countries]()
- 316El Salvador
- 99Jamaica
- 53Philippines
- 44Cameroon
- 42Ghana
- 37Mexico
- 28Trinidad and Tobago
- 23Germany
- 17Poland
- 15Ethiopia
- 11Sierra Leone
- 10West Indies
- 9Guatemala
- 6Thailand
- 1Venezuela

Grandparents responsible for own grandchildren in Forestville
Zip codes: 20747.