Races in Fords, New Jersey (NJ) Detailed Stats
Data:
Races - White alone (%)
Races - White alone (% change since 2000)
Races - Black alone (%)
Races - Black alone (% change since 2000)
Races - American Indian alone (%)
Races - American Indian alone (% change since 2000)
Races - Asian alone (%)
Races - Asian alone (% change since 2000)
Races - Hispanic (%)
Races - Hispanic (% change since 2000)
Races - Native Hawaiian and Other Pacific Islander alone (%)
Races - Native Hawaiian and Other Pacific Islander alone (% change since 2000)
Races - Two or more races(%)
Races - Two or more races(% change since 2000)
Races - Other race alone (%)
Races - Other race alone (% change since 2000)
Racial diversity
Place of birth - Born in state of residence (%)
Place of birth - Born in state of residence (%) - White
Place of birth - Born in state of residence (%) - Black or African American
Place of birth - Born in state of residence (%) - Asian
Place of birth - Born in state of residence (%) - Hispanic or Latino
Place of birth - Born in state of residence (%) - American Indian and Alaska Native
Place of birth - Born in state of residence (%) - Multirace
Place of birth - Born in state of residence (%) - Other Race
Place of birth - Born in other state (%)
Place of birth - Born in other state (%) - White
Place of birth - Born in other state (%) - Black or African American
Place of birth - Born in other state (%) - Asian
Place of birth - Born in other state (%) - Hispanic or Latino
Place of birth - Born in other state (%) - American Indian and Alaska Native
Place of birth - Born in other state (%) - Multirace
Place of birth - Born in other state (%) - Other Race
Place of birth - Native, outside of US (%)
Place of birth - Native, outside of US (%) - White
Place of birth - Native, outside of US (%) - Black or African American
Place of birth - Native, outside of US (%) - Asian
Place of birth - Native, outside of US (%) - Hispanic or Latino
Place of birth - Native, outside of US (%) - American Indian and Alaska Native
Place of birth - Native, outside of US (%) - Multirace
Place of birth - Native, outside of US (%) - Other Race
Place of birth - Foreign born (%)
Place of birth - Foreign born (%) - White
Place of birth - Foreign born (%) - Black or African American
Place of birth - Foreign born (%) - Asian
Place of birth - Foreign born (%) - Hispanic or Latino
Place of birth - Foreign born (%) - American Indian and Alaska Native
Place of birth - Foreign born (%) - Multirace
Place of birth - Foreign born (%) - Other Race
Residents speaking English at home (%)
Residents speaking English at home - Born in the United States (%)
Residents speaking English at home - Native, born elsewhere (%)
Residents speaking English at home - Foreign born (%)
Residents speaking Spanish at home (%)
Residents speaking Spanish at home - Born in the United States (%)
Residents speaking Spanish at home - Native, born elsewhere (%)
Residents speaking Spanish at home - Foreign born (%)
Residents speaking other language at home (%)
Residents speaking other language at home - Born in the United States (%)
Residents speaking other language at home - Native, born elsewhere (%)
Residents speaking other language at home - Foreign born (%)
Marital status - Never married (%)
Marital status - Now married (%)
Marital status - Separated (%)
Marital status - Widowed (%)
Marital status - Divorced (%)
Ancestries Reported - Arab (%)
Ancestries Reported - Czech (%)
Ancestries Reported - Danish (%)
Ancestries Reported - Dutch (%)
Ancestries Reported - English (%)
Ancestries Reported - French (%)
Ancestries Reported - French Canadian (%)
Ancestries Reported - German (%)
Ancestries Reported - Greek (%)
Ancestries Reported - Hungarian (%)
Ancestries Reported - Irish (%)
Ancestries Reported - Italian (%)
Ancestries Reported - Lithuanian (%)
Ancestries Reported - Norwegian (%)
Ancestries Reported - Polish (%)
Ancestries Reported - Portuguese (%)
Ancestries Reported - Russian (%)
Ancestries Reported - Scotch-Irish (%)
Ancestries Reported - Scottish (%)
Ancestries Reported - Slovak (%)
Ancestries Reported - Subsaharan African (%)
Ancestries Reported - Swedish (%)
Ancestries Reported - Swiss (%)
Ancestries Reported - Ukrainian (%)
Ancestries Reported - United States (%)
Ancestries Reported - Welsh (%)
Ancestries Reported - West Indian (%)
Ancestries Reported - Other (%)
Geographical mobility - Same house 1 year ago (%)
Geographical mobility - Same house 1 year ago (%) - White
Geographical mobility - Same house 1 year ago (%) - Black or African American
Geographical mobility - Same house 1 year ago (%) - Asian
Geographical mobility - Same house 1 year ago (%) - Hispanic or Latino
Geographical mobility - Same house 1 year ago (%) - American Indian and Alaska Native
Geographical mobility - Same house 1 year ago (%) - Multirace
Geographical mobility - Same house 1 year ago (%) - Other Race
Geographical mobility - Moved within same county (%)
Geographical mobility - Moved within same county (%) - White
Geographical mobility - Moved within same county (%) - Black or African American
Geographical mobility - Moved within same county (%) - Asian
Geographical mobility - Moved within same county (%) - Hispanic or Latino
Geographical mobility - Moved within same county (%) - American Indian and Alaska Native
Geographical mobility - Moved within same county (%) - Multirace
Geographical mobility - Moved within same county (%) - Other Race
Geographical mobility - Moved from different county within same state (%)
Geographical mobility - Moved from different county within same state (%) - White
Geographical mobility - Moved from different county within same state (%) - Black or African American
Geographical mobility - Moved from different county within same state (%) - Asian
Geographical mobility - Moved from different county within same state (%) - Hispanic or Latino
Geographical mobility - Moved from different county within same state (%) - American Indian and Alaska Native
Geographical mobility - Moved from different county within same state (%) - Multirace
Geographical mobility - Moved from different county within same state (%) - Other Race
Geographical mobility - Moved from different state (%)
Geographical mobility - Moved from different state (%) - White
Geographical mobility - Moved from different state (%) - Black or African American
Geographical mobility - Moved from different state (%) - Asian
Geographical mobility - Moved from different state (%) - Hispanic or Latino
Geographical mobility - Moved from different state (%) - American Indian and Alaska Native
Geographical mobility - Moved from different state (%) - Multirace
Geographical mobility - Moved from different state (%) - Other Race
Geographical mobility - Moved from abroad (%)
Geographical mobility - Moved from abroad (%) - White
Geographical mobility - Moved from abroad (%) - Black or African American
Geographical mobility - Moved from abroad (%) - Asian
Geographical mobility - Moved from abroad (%) - Hispanic or Latino
Geographical mobility - Moved from abroad (%) - American Indian and Alaska Native
Geographical mobility - Moved from abroad (%) - Multirace
Geographical mobility - Moved from abroad (%) - Other Race
Place of birth for the foreign-born population - Ireland (%)
Place of birth for the foreign-born population - Denmark (%)
Place of birth for the foreign-born population - Norway (%)
Place of birth for the foreign-born population - Sweden (%)
Place of birth for the foreign-born population - United Kingdom (%)
Place of birth for the foreign-born population - England (%)
Place of birth for the foreign-born population - Scotland (%)
Place of birth for the foreign-born population - Other Northern Europe (%)
Place of birth for the foreign-born population - Austria (%)
Place of birth for the foreign-born population - Belgium (%)
Place of birth for the foreign-born population - France (%)
Place of birth for the foreign-born population - Germany (%)
Place of birth for the foreign-born population - Netherlands (%)
Place of birth for the foreign-born population - Switzerland (%)
Place of birth for the foreign-born population - Other Western Europe (%)
Place of birth for the foreign-born population - Greece (%)
Place of birth for the foreign-born population - Italy (%)
Place of birth for the foreign-born population - Portugal (%)
Place of birth for the foreign-born population - Spain (%)
Place of birth for the foreign-born population - Other Southern Europe (%)
Place of birth for the foreign-born population - Albania (%)
Place of birth for the foreign-born population - Belarus (%)
Place of birth for the foreign-born population - Bosnia and Herzegovina (%)
Place of birth for the foreign-born population - Bulgaria (%)
Place of birth for the foreign-born population - Croatia (%)
Place of birth for the foreign-born population - Czechoslovakia (%)
Place of birth for the foreign-born population - Hungary (%)
Place of birth for the foreign-born population - Latvia (%)
Place of birth for the foreign-born population - Lithuania (%)
Place of birth for the foreign-born population - North Macedonia (Macedonia) (%)
Place of birth for the foreign-born population - Moldova (%)
Place of birth for the foreign-born population - Poland (%)
Place of birth for the foreign-born population - Romania (%)
Place of birth for the foreign-born population - Russia (%)
Place of birth for the foreign-born population - Serbia (%)
Place of birth for the foreign-born population - Ukraine (%)
Place of birth for the foreign-born population - Other Eastern Europe (%)
Place of birth for the foreign-born population - China (%)
Place of birth for the foreign-born population - Hong Kong (%)
Place of birth for the foreign-born population - Taiwan (%)
Place of birth for the foreign-born population - Japan (%)
Place of birth for the foreign-born population - Korea (%)
Place of birth for the foreign-born population - Other Eastern Asia (%)
Place of birth for the foreign-born population - Afghanistan (%)
Place of birth for the foreign-born population - Bangladesh (%)
Place of birth for the foreign-born population - India (%)
Place of birth for the foreign-born population - Iran (%)
Place of birth for the foreign-born population - Kazakhstan (%)
Place of birth for the foreign-born population - Nepal (%)
Place of birth for the foreign-born population - Pakistan (%)
Place of birth for the foreign-born population - Sri Lanka (%)
Place of birth for the foreign-born population - Uzbekistan (%)
Place of birth for the foreign-born population - Other South Central Asia (%)
Place of birth for the foreign-born population - Burma (%)
Place of birth for the foreign-born population - Cambodia (%)
Place of birth for the foreign-born population - Indonesia (%)
Place of birth for the foreign-born population - Laos (%)
Place of birth for the foreign-born population - Malaysia (%)
Place of birth for the foreign-born population - Philippines (%)
Place of birth for the foreign-born population - Singapore (%)
Place of birth for the foreign-born population - Thailand (%)
Place of birth for the foreign-born population - Vietnam (%)
Place of birth for the foreign-born population - Other South Eastern Asia (%)
Place of birth for the foreign-born population - Armenia (%)
Place of birth for the foreign-born population - Iraq (%)
Place of birth for the foreign-born population - Israel (%)
Place of birth for the foreign-born population - Jordan (%)
Place of birth for the foreign-born population - Kuwait (%)
Place of birth for the foreign-born population - Lebanon (%)
Place of birth for the foreign-born population - Saudi Arabia (%)
Place of birth for the foreign-born population - Syria (%)
Place of birth for the foreign-born population - Turkey (%)
Place of birth for the foreign-born population - Yemen (%)
Place of birth for the foreign-born population - Other Western Asia (%)
Place of birth for the foreign-born population - Eritrea (%)
Place of birth for the foreign-born population - Ethiopia (%)
Place of birth for the foreign-born population - Kenya (%)
Place of birth for the foreign-born population - Somalia (%)
Place of birth for the foreign-born population - Uganda (%)
Place of birth for the foreign-born population - Zimbabwe (%)
Place of birth for the foreign-born population - Other Eastern Africa (%)
Place of birth for the foreign-born population - Cameroon (%)
Place of birth for the foreign-born population - Congo (%)
Place of birth for the foreign-born population - Democratic Republic of Congo (Zaire) (%)
Place of birth for the foreign-born population - Other Middle Africa (%)
Place of birth for the foreign-born population - Egypt (%)
Place of birth for the foreign-born population - Morocco (%)
Place of birth for the foreign-born population - Sudan (%)
Place of birth for the foreign-born population - Other Northern Africa (%)
Place of birth for the foreign-born population - South Africa (%)
Place of birth for the foreign-born population - Other Southern Africa (%)
Place of birth for the foreign-born population - Cabo Verde (%)
Place of birth for the foreign-born population - Ghana (%)
Place of birth for the foreign-born population - Liberia (%)
Place of birth for the foreign-born population - Nigeria (%)
Place of birth for the foreign-born population - Senegal (%)
Place of birth for the foreign-born population - Sierra Leone (%)
Place of birth for the foreign-born population - Other Western Africa (%)
Place of birth for the foreign-born population - Australia (%)
Place of birth for the foreign-born population - New Zealand (%)
Place of birth for the foreign-born population - Fiji (%)
Place of birth for the foreign-born population - Micronesia (%)
Place of birth for the foreign-born population - Bahamas (%)
Place of birth for the foreign-born population - Barbados (%)
Place of birth for the foreign-born population - Cuba (%)
Place of birth for the foreign-born population - Dominica (%)
Place of birth for the foreign-born population - Dominican Republic (%)
Place of birth for the foreign-born population - Grenada (%)
Place of birth for the foreign-born population - Haiti (%)
Place of birth for the foreign-born population - Jamaica (%)
Place of birth for the foreign-born population - St. Vincent and the Grenadines (%)
Place of birth for the foreign-born population - Trinidad and Tobago (%)
Place of birth for the foreign-born population - West Indies (%)
Place of birth for the foreign-born population - Other Caribbean (%)
Place of birth for the foreign-born population - Belize (%)
Place of birth for the foreign-born population - Costa Rica (%)
Place of birth for the foreign-born population - El Salvador (%)
Place of birth for the foreign-born population - Guatemala (%)
Place of birth for the foreign-born population - Honduras (%)
Place of birth for the foreign-born population - Mexico (%)
Place of birth for the foreign-born population - Nicaragua (%)
Place of birth for the foreign-born population - Panama (%)
Place of birth for the foreign-born population - Other Central America (%)
Place of birth for the foreign-born population - Argentina (%)
Place of birth for the foreign-born population - Bolivia (%)
Place of birth for the foreign-born population - Brazil (%)
Place of birth for the foreign-born population - Chile (%)
Place of birth for the foreign-born population - Colombia (%)
Place of birth for the foreign-born population - Ecuador (%)
Place of birth for the foreign-born population - Guyana (%)
Place of birth for the foreign-born population - Peru (%)
Place of birth for the foreign-born population - Uruguay (%)
Place of birth for the foreign-born population - Venezuela (%)
Place of birth for the foreign-born population - Other South America (%)
Place of birth for the foreign-born population - Canada (%)
Place of birth for the foreign-born population - Other Northern America (%)
Place of birth for the foreign-born population - Other (%)
Latest news about races in Fords, NJ collected exclusively by city-data.com from local newspapers, TV, and radio stations
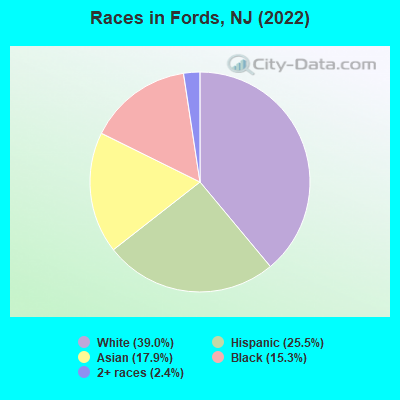
According to 2022 data, the most numerous races in Fords, NJ are White alone (4,951 residents), Hispanic (3,230 residents), and Black alone (1,942 residents). 56.2% of Fords residents speak English at home. 32.9% of Fords, NJ residents are foreign-born (13.0% born in Asia, 11.0% born in Latin America, 5.1% born in Africa, 3.3% born in Europe), which is 30.0% greater than the foreign-born rate of 23.0% across the entire state of New Jersey.
Race distribution in Fords
2000 2022
5,557,209 66.0% White alone 1,117,191 13.3% Hispanic 1,096,171 13.0% Black alone 477,012 5.7% Asian alone 133,689 1.6% Two or more races 19,565 0.2% Other race alone 11,338 0.1% American Indian alone 2,175 0.03% Native Hawaiian and Other
4,766,476 51.5% White alone 2,028,470 21.9% Hispanic 1,111,632 12.0% Black alone 923,546 10.0% Asian alone 332,237 3.6% Two or more races 89,847 1.0% Other race alone 8,557 0.09% American Indian alone 934 0.01% Native Hawaiian and Other
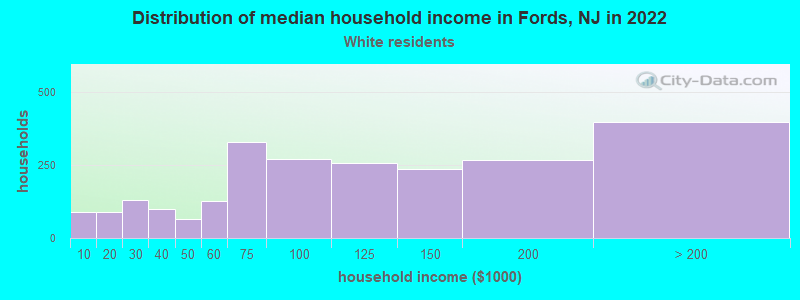
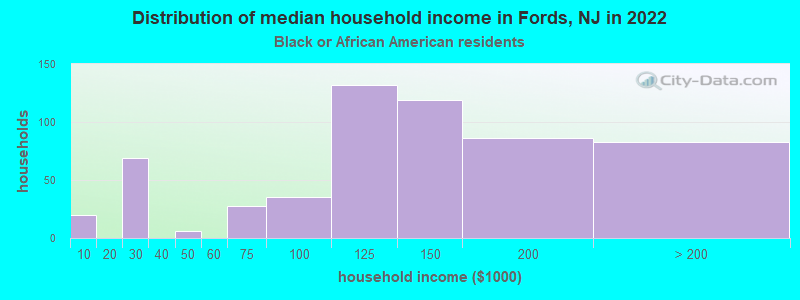
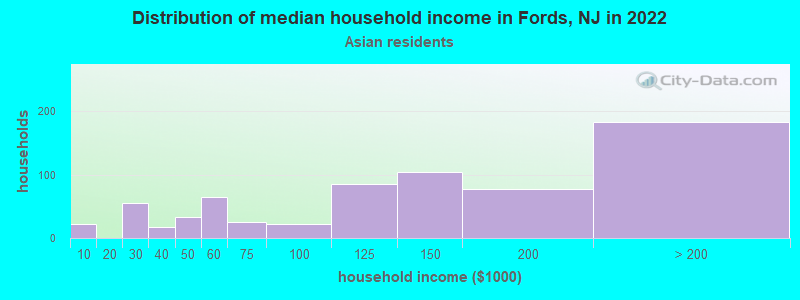
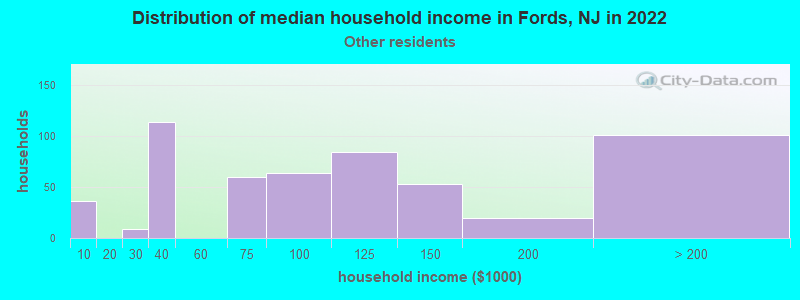
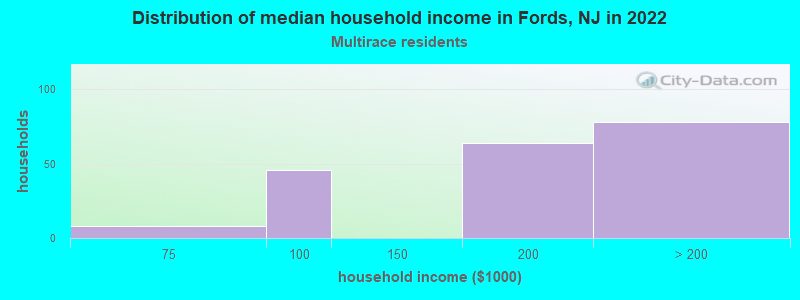
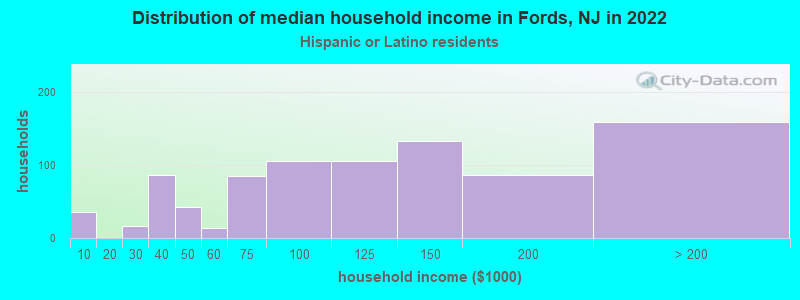
Income and house value in Fords Median household income in 2022 $90,703 White non-Hispanic householders$119,871 Black householders$138,354 Asian householders$94,703 Some other race householders$144,747 Two or more races householders$109,179 Hispanic or Latino race householdersMedian 2022 house value $402,700 White Non-Hispanic householders$420,346 Black or African American householders$724,281 American Indian or Alaska Native householders $419,819 Asian householders$592,594 Native Hawaiian and other Pacific Islander householders$425,614 Some other race householders$444,577 Two or more races householders$412,708 Hispanic or Latino householders
Median age by race in Fords
47.0 Median age for White residents43.8 50.9 36.3 Median age for Black or African American residents27.5 48.0 34.3 Median age for American Indian / Alaska Native residents69.3 34.3 34.3 Median age for Asian residents34.0 34.4 -939,393,938.5 Median age for Native Hawaiian / Pacific Islander residents-860,335,194.7 -713,070,378.3 37.7 Median age for Other race residents33.8 40.5 27.3 Median age for Two or more races residents34.6 20.4 44.7 Median age for White alone residents40.4 51.7 35.1 Median age for Hispanic or Latino residents39.2 33.2
Owner/renter occupied households by race in Fords
House owners and renters - White residents 1,915 79.8% Owner occupied484 20.2% Renter occupiedHouse owners and renters - Black or African American residents 295 48.5% Owner occupied314 51.5% Renter occupiedHouse owners and renters - American Indian / Alaska Native residents 35 100.0% Owner occupiedHouse owners and renters - Asian residents 381 56.0% Owner occupied300 44.0% Renter occupiedHouse owners and renters - Other race residents 387 64.8% Owner occupied210 35.2% Renter occupiedHouse owners and renters - Two or more races residents 206 90.2% Owner occupied22 9.8% Renter occupiedHouse owners and renters - White alone residents 1,735 75.3% Owner occupied569 24.7% Renter occupiedHouse owners and renters - Hispanic or Latino residents 775 80.3% Owner occupied190 19.7% Renter occupied
Language usage in Fords
English speakers - Total 56.2% of residents of Fords speak English at home.
18.6% of residents speak Spanish at home 1,139 52.1% Speak English very well1,047 47.9% Speak English less than very well25.2% of residents speak other language at home 2,114 71.2% Speak English very well856 28.8% Speak English less than very well
English speakers - Born in the United States 84.5% of residents of Fords speak English at home.
10.7% of residents speak Spanish at home 123 83.7% Speak English very well24 16.3% Speak English less than very well4.8% of residents speak other language at home 66 100.0% Speak English very well
English speakers - Native, born elsewhere 19.6% of residents of Fords speak English at home.
78.0% of residents speak Spanish at home 124 76.1% Speak English very well39 23.9% Speak English less than very well
English speakers - Foreign-born 10.9% of residents of Fords speak English at home.
30.7% of residents speak Spanish at home 454 34.4% Speak English very well867 65.6% Speak English less than very well58.0% of residents speak other language at home 1,633 65.6% Speak English very well858 34.4% Speak English less than very well
White (Caucasian) - Speak only English Native:
95.9% (3,992)Foreign-born:
17.3% (98)
White (Caucasian) - Speak another language Native:
5.9% (245)Foreign-born:
81.6% (463)
Black or African American - Speak only English Native:
88.5% (1,087)Foreign-born:
24.7% (221)
Black or African American - Speak another language Native:
11.0% (136)Foreign-born:
82.1% (736)
American Indian / Alaska Native - Speak another language Native:
59.7% (33)Foreign-born:
97.6% (230)
Asian - Speak only English Native:
63.9% (361)Foreign-born:
4.0% (62)
Asian - Speak another language Native:
35.4% (200)Foreign-born:
95.6% (1,471)
Other race - Speak only English Native:
26.5% (135)Foreign-born:
2.6% (26)
Other race - Speak another language Native:
72.3% (369)Foreign-born:
95.7% (950)
Two or more races - Speak only English Native:
55.2% (526)Foreign-born:
10.1% (38)
Two or more races - Speak another language Native:
45.0% (429)Foreign-born:
90.0% (340)
White alone - Speak only English Native:
95.7% (3,825)Foreign-born:
10.5% (53)
White alone - Speak another language Native:
4.6% (186)Foreign-born:
88.4% (443)
Hispanic or Latino - Speak only English Native:
48.0% (752)Foreign-born:
7.2% (103)
Hispanic or Latino - Speak another language Native:
53.1% (832)Foreign-born:
92.8% (1,338)
Foreign-born residents in Fords 4,169 residents are foreign born (13.0% Asia , 11.0% Latin America , 5.1% Africa , 3.3% Europe ).
This city:
32.9%New Jersey:
23.2%
Marital status for residents in Fords Marital status - White (Caucasian) population 15 years and over
Males 36.3% Never married52.3% Now married0.0% Separated3.3% Widowed8.2% DivorcedFemales 27.0% Never married46.5% Now married0.2% Separated11.9% Widowed14.4% DivorcedWomen who gave birth in the past 12 months Now married:
100.0% (121)Unmarried:
0.0% (0)
Women who did not give birth in the past 12 months Now married:
39.8% (357)Unmarried:
60.2% (540)
Marital status - Black or African American population 15 years and over
Males 51.7% Never married38.1% Now married2.7% Separated0.0% Widowed7.5% DivorcedFemales 51.9% Never married32.2% Now married1.5% Separated5.1% Widowed9.4% DivorcedWomen who did not give birth in the past 12 months Now married:
28.6% (135)Unmarried:
71.4% (337)
Marital status - American Indian / Alaska Native population 15 years and over
Males 0.0% Never married100.0% Now married0.0% Separated0.0% Widowed0.0% DivorcedFemales 0.0% Never married100.0% Now married0.0% Separated0.0% Widowed0.0% DivorcedWomen who did not give birth in the past 12 months Now married:
100.0% (28)Unmarried:
0.0% (0)
Marital status - Asian population 15 years and over
Males 34.8% Never married59.3% Now married1.1% Separated3.7% Widowed1.2% DivorcedFemales 24.6% Never married63.1% Now married0.8% Separated9.5% Widowed1.9% DivorcedWomen who gave birth in the past 12 months Now married:
74.4% (33)Unmarried:
25.6% (11)
Women who did not give birth in the past 12 months Now married:
61.1% (300)Unmarried:
38.9% (191)
Marital status - Other race population 15 years and over
Males 44.6% Never married41.9% Now married5.9% Separated0.0% Widowed7.6% DivorcedFemales 27.1% Never married51.2% Now married3.7% Separated10.0% Widowed8.1% DivorcedWomen who did not give birth in the past 12 months Now married:
58.9% (238)Unmarried:
41.1% (166)
Marital status - Two or more races population 15 years and over
Males 53.1% Never married38.4% Now married4.1% Separated0.7% Widowed3.7% DivorcedFemales 36.4% Never married54.8% Now married0.0% Separated0.0% Widowed8.8% DivorcedWomen who did not give birth in the past 12 months Now married:
32.8% (102)Unmarried:
67.2% (208)
Marital status - White alone, not Hispanic / Latino population 15 years and over
Males 38.2% Never married50.7% Now married0.0% Separated3.2% Widowed7.9% DivorcedFemales 26.1% Never married50.0% Now married0.2% Separated14.0% Widowed9.8% DivorcedWomen who gave birth in the past 12 months Now married:
100.0% (142)Unmarried:
0.0% (0)
Women who did not give birth in the past 12 months Now married:
44.2% (355)Unmarried:
55.8% (448)
Marital status - Hispanic or Latino population 15 years and over
Males 33.4% Never married52.5% Now married3.9% Separated1.0% Widowed9.2% DivorcedFemales 28.6% Never married45.9% Now married1.4% Separated3.8% Widowed20.3% DivorcedWomen who did not give birth in the past 12 months Now married:
41.0% (305)Unmarried:
59.0% (439)
Ancestries in Fords
415 6.0% Polish413 6.0% Ghanaian370 5.3% Italian348 5.0% American297 4.3% Nigerian207 3.0% Egyptian144 2.1% Irish87 1.3% European86 1.2% Slovak85 1.2% Hungarian84 1.2% Portuguese78 1.1% Barbadian50 0.7% German35 0.5% Jamaican32 0.5% Trinidadian and Tobagonian27 0.4% Scotch-Irish24 0.3% English23 0.3% Greek21 0.3% Russian18 0.3% Czech14 0.2% Carpatho Rusyn9 0.1% Bulgarian7 0.1% Arab6 0.09% West Indian5 0.07% Norwegian3 0.04% Brazilian
Geographical mobility in Fords Same house 1 year ago 4,485 91.2% White (Caucasian)1,970 94.2% Black or African American263 96.6% American Indian / Alaska Native1,839 79.8% Asian1,332 87.0% Other race1,343 94.2% Two or more races4,328 91.2% White alone, not Hispanic / Latino2,923 90.9% Hispanic or LatinoMoved within same county 178 3.6% White / Caucasian63 2.7% Asian128 8.3% Other race92 6.4% Two or more races150 3.2% White alone, not Hispanic / Latino218 6.8% Hispanic or LatinoMoved within same state 153 3.1% White / Caucasian136 5.9% Asian162 3.4% White alone, not Hispanic / Latino9 0.3% Hispanic or LatinoMoved from different state 99 2.0% White / Caucasian160 7.6% Black or African American155 6.7% Asian101 2.1% White alone, not Hispanic / Latino20 0.6% Hispanic or LatinoMoved from abroad 22 1.0% Black or African American17 0.7% Asian
Children Nativity (place of birth) in Fords
Children under 6 years - Living with two parents Both parents native 566 100.0% NativeBoth parents foreign-born 283 96.5% Native10 3.5% Foreign-bornOne native, one foreign-born parent 41 100.0% NativeChildren under 6 years - Living with one parent Native parent 30 100.0% NativeForeign-born parent 127 100.0% NativeChildren 6 to 17 years - Living with two parents Both parents native 546 100.0% NativeBoth parents foreign-born 384 55.9% Native302 44.1% Foreign-bornOne native, one foreign-born parent 23 100.0% NativeChildren 6 to 17 years - Living with one parent Native parent 147 100.0% NativeForeign-born parent 134 55.5% Native107 44.5% Foreign-born
Grandparents responsible for own grandchildren in Fords
Grandparents (30 to 59 years) White / Caucasian 5 100.0% Not responsible for grandchildrenBlack or African American 13 100.0% Not responsible for grandchildrenAsian 15 100.0% Not responsible for grandchildrenTwo or more races 15 100.0% Not responsible for grandchildrenWhite alone, not Hispanic / Latino 6 100.0% Not responsible for grandchildrenHispanic or Latino 12 100.0% Not responsible for grandchildrenGrandparents (60 years and over) White / Caucasian 29 20.4% Responsible for grandchildren113 79.6% Not responsible for grandchildrenBlack or African American 16 38.2% Responsible for grandchildren26 61.8% Not responsible for grandchildrenAsian 117 100.0% Not responsible for grandchildrenTwo or more races 4 100.0% Not responsible for grandchildrenWhite alone, not Hispanic / Latino 39 24.7% Responsible for grandchildren120 75.3% Not responsible for grandchildrenHispanic or Latino 218 100.0% Not responsible for grandchildren