Races in Fish Hawk, Florida (FL) Detailed Stats
Data:
Races - White alone (%)
Races - White alone (% change since 2000)
Races - Black alone (%)
Races - Black alone (% change since 2000)
Races - American Indian alone (%)
Races - American Indian alone (% change since 2000)
Races - Asian alone (%)
Races - Asian alone (% change since 2000)
Races - Hispanic (%)
Races - Hispanic (% change since 2000)
Races - Native Hawaiian and Other Pacific Islander alone (%)
Races - Native Hawaiian and Other Pacific Islander alone (% change since 2000)
Races - Two or more races(%)
Races - Two or more races(% change since 2000)
Races - Other race alone (%)
Races - Other race alone (% change since 2000)
Racial diversity
Place of birth - Born in state of residence (%)
Place of birth - Born in state of residence (%) - White
Place of birth - Born in state of residence (%) - Black or African American
Place of birth - Born in state of residence (%) - Asian
Place of birth - Born in state of residence (%) - Hispanic or Latino
Place of birth - Born in state of residence (%) - American Indian and Alaska Native
Place of birth - Born in state of residence (%) - Multirace
Place of birth - Born in state of residence (%) - Other Race
Place of birth - Born in other state (%)
Place of birth - Born in other state (%) - White
Place of birth - Born in other state (%) - Black or African American
Place of birth - Born in other state (%) - Asian
Place of birth - Born in other state (%) - Hispanic or Latino
Place of birth - Born in other state (%) - American Indian and Alaska Native
Place of birth - Born in other state (%) - Multirace
Place of birth - Born in other state (%) - Other Race
Place of birth - Native, outside of US (%)
Place of birth - Native, outside of US (%) - White
Place of birth - Native, outside of US (%) - Black or African American
Place of birth - Native, outside of US (%) - Asian
Place of birth - Native, outside of US (%) - Hispanic or Latino
Place of birth - Native, outside of US (%) - American Indian and Alaska Native
Place of birth - Native, outside of US (%) - Multirace
Place of birth - Native, outside of US (%) - Other Race
Place of birth - Foreign born (%)
Place of birth - Foreign born (%) - White
Place of birth - Foreign born (%) - Black or African American
Place of birth - Foreign born (%) - Asian
Place of birth - Foreign born (%) - Hispanic or Latino
Place of birth - Foreign born (%) - American Indian and Alaska Native
Place of birth - Foreign born (%) - Multirace
Place of birth - Foreign born (%) - Other Race
Residents speaking English at home (%)
Residents speaking English at home - Born in the United States (%)
Residents speaking English at home - Native, born elsewhere (%)
Residents speaking English at home - Foreign born (%)
Residents speaking Spanish at home (%)
Residents speaking Spanish at home - Born in the United States (%)
Residents speaking Spanish at home - Native, born elsewhere (%)
Residents speaking Spanish at home - Foreign born (%)
Residents speaking other language at home (%)
Residents speaking other language at home - Born in the United States (%)
Residents speaking other language at home - Native, born elsewhere (%)
Residents speaking other language at home - Foreign born (%)
Marital status - Never married (%)
Marital status - Now married (%)
Marital status - Separated (%)
Marital status - Widowed (%)
Marital status - Divorced (%)
Ancestries Reported - Arab (%)
Ancestries Reported - Czech (%)
Ancestries Reported - Danish (%)
Ancestries Reported - Dutch (%)
Ancestries Reported - English (%)
Ancestries Reported - French (%)
Ancestries Reported - French Canadian (%)
Ancestries Reported - German (%)
Ancestries Reported - Greek (%)
Ancestries Reported - Hungarian (%)
Ancestries Reported - Irish (%)
Ancestries Reported - Italian (%)
Ancestries Reported - Lithuanian (%)
Ancestries Reported - Norwegian (%)
Ancestries Reported - Polish (%)
Ancestries Reported - Portuguese (%)
Ancestries Reported - Russian (%)
Ancestries Reported - Scotch-Irish (%)
Ancestries Reported - Scottish (%)
Ancestries Reported - Slovak (%)
Ancestries Reported - Subsaharan African (%)
Ancestries Reported - Swedish (%)
Ancestries Reported - Swiss (%)
Ancestries Reported - Ukrainian (%)
Ancestries Reported - United States (%)
Ancestries Reported - Welsh (%)
Ancestries Reported - West Indian (%)
Ancestries Reported - Other (%)
Geographical mobility - Same house 1 year ago (%)
Geographical mobility - Same house 1 year ago (%) - White
Geographical mobility - Same house 1 year ago (%) - Black or African American
Geographical mobility - Same house 1 year ago (%) - Asian
Geographical mobility - Same house 1 year ago (%) - Hispanic or Latino
Geographical mobility - Same house 1 year ago (%) - American Indian and Alaska Native
Geographical mobility - Same house 1 year ago (%) - Multirace
Geographical mobility - Same house 1 year ago (%) - Other Race
Geographical mobility - Moved within same county (%)
Geographical mobility - Moved within same county (%) - White
Geographical mobility - Moved within same county (%) - Black or African American
Geographical mobility - Moved within same county (%) - Asian
Geographical mobility - Moved within same county (%) - Hispanic or Latino
Geographical mobility - Moved within same county (%) - American Indian and Alaska Native
Geographical mobility - Moved within same county (%) - Multirace
Geographical mobility - Moved within same county (%) - Other Race
Geographical mobility - Moved from different county within same state (%)
Geographical mobility - Moved from different county within same state (%) - White
Geographical mobility - Moved from different county within same state (%) - Black or African American
Geographical mobility - Moved from different county within same state (%) - Asian
Geographical mobility - Moved from different county within same state (%) - Hispanic or Latino
Geographical mobility - Moved from different county within same state (%) - American Indian and Alaska Native
Geographical mobility - Moved from different county within same state (%) - Multirace
Geographical mobility - Moved from different county within same state (%) - Other Race
Geographical mobility - Moved from different state (%)
Geographical mobility - Moved from different state (%) - White
Geographical mobility - Moved from different state (%) - Black or African American
Geographical mobility - Moved from different state (%) - Asian
Geographical mobility - Moved from different state (%) - Hispanic or Latino
Geographical mobility - Moved from different state (%) - American Indian and Alaska Native
Geographical mobility - Moved from different state (%) - Multirace
Geographical mobility - Moved from different state (%) - Other Race
Geographical mobility - Moved from abroad (%)
Geographical mobility - Moved from abroad (%) - White
Geographical mobility - Moved from abroad (%) - Black or African American
Geographical mobility - Moved from abroad (%) - Asian
Geographical mobility - Moved from abroad (%) - Hispanic or Latino
Geographical mobility - Moved from abroad (%) - American Indian and Alaska Native
Geographical mobility - Moved from abroad (%) - Multirace
Geographical mobility - Moved from abroad (%) - Other Race
Place of birth for the foreign-born population - Ireland (%)
Place of birth for the foreign-born population - Denmark (%)
Place of birth for the foreign-born population - Norway (%)
Place of birth for the foreign-born population - Sweden (%)
Place of birth for the foreign-born population - United Kingdom (%)
Place of birth for the foreign-born population - England (%)
Place of birth for the foreign-born population - Scotland (%)
Place of birth for the foreign-born population - Other Northern Europe (%)
Place of birth for the foreign-born population - Austria (%)
Place of birth for the foreign-born population - Belgium (%)
Place of birth for the foreign-born population - France (%)
Place of birth for the foreign-born population - Germany (%)
Place of birth for the foreign-born population - Netherlands (%)
Place of birth for the foreign-born population - Switzerland (%)
Place of birth for the foreign-born population - Other Western Europe (%)
Place of birth for the foreign-born population - Greece (%)
Place of birth for the foreign-born population - Italy (%)
Place of birth for the foreign-born population - Portugal (%)
Place of birth for the foreign-born population - Spain (%)
Place of birth for the foreign-born population - Other Southern Europe (%)
Place of birth for the foreign-born population - Albania (%)
Place of birth for the foreign-born population - Belarus (%)
Place of birth for the foreign-born population - Bosnia and Herzegovina (%)
Place of birth for the foreign-born population - Bulgaria (%)
Place of birth for the foreign-born population - Croatia (%)
Place of birth for the foreign-born population - Czechoslovakia (%)
Place of birth for the foreign-born population - Hungary (%)
Place of birth for the foreign-born population - Latvia (%)
Place of birth for the foreign-born population - Lithuania (%)
Place of birth for the foreign-born population - North Macedonia (Macedonia) (%)
Place of birth for the foreign-born population - Moldova (%)
Place of birth for the foreign-born population - Poland (%)
Place of birth for the foreign-born population - Romania (%)
Place of birth for the foreign-born population - Russia (%)
Place of birth for the foreign-born population - Serbia (%)
Place of birth for the foreign-born population - Ukraine (%)
Place of birth for the foreign-born population - Other Eastern Europe (%)
Place of birth for the foreign-born population - China (%)
Place of birth for the foreign-born population - Hong Kong (%)
Place of birth for the foreign-born population - Taiwan (%)
Place of birth for the foreign-born population - Japan (%)
Place of birth for the foreign-born population - Korea (%)
Place of birth for the foreign-born population - Other Eastern Asia (%)
Place of birth for the foreign-born population - Afghanistan (%)
Place of birth for the foreign-born population - Bangladesh (%)
Place of birth for the foreign-born population - India (%)
Place of birth for the foreign-born population - Iran (%)
Place of birth for the foreign-born population - Kazakhstan (%)
Place of birth for the foreign-born population - Nepal (%)
Place of birth for the foreign-born population - Pakistan (%)
Place of birth for the foreign-born population - Sri Lanka (%)
Place of birth for the foreign-born population - Uzbekistan (%)
Place of birth for the foreign-born population - Other South Central Asia (%)
Place of birth for the foreign-born population - Burma (%)
Place of birth for the foreign-born population - Cambodia (%)
Place of birth for the foreign-born population - Indonesia (%)
Place of birth for the foreign-born population - Laos (%)
Place of birth for the foreign-born population - Malaysia (%)
Place of birth for the foreign-born population - Philippines (%)
Place of birth for the foreign-born population - Singapore (%)
Place of birth for the foreign-born population - Thailand (%)
Place of birth for the foreign-born population - Vietnam (%)
Place of birth for the foreign-born population - Other South Eastern Asia (%)
Place of birth for the foreign-born population - Armenia (%)
Place of birth for the foreign-born population - Iraq (%)
Place of birth for the foreign-born population - Israel (%)
Place of birth for the foreign-born population - Jordan (%)
Place of birth for the foreign-born population - Kuwait (%)
Place of birth for the foreign-born population - Lebanon (%)
Place of birth for the foreign-born population - Saudi Arabia (%)
Place of birth for the foreign-born population - Syria (%)
Place of birth for the foreign-born population - Turkey (%)
Place of birth for the foreign-born population - Yemen (%)
Place of birth for the foreign-born population - Other Western Asia (%)
Place of birth for the foreign-born population - Eritrea (%)
Place of birth for the foreign-born population - Ethiopia (%)
Place of birth for the foreign-born population - Kenya (%)
Place of birth for the foreign-born population - Somalia (%)
Place of birth for the foreign-born population - Uganda (%)
Place of birth for the foreign-born population - Zimbabwe (%)
Place of birth for the foreign-born population - Other Eastern Africa (%)
Place of birth for the foreign-born population - Cameroon (%)
Place of birth for the foreign-born population - Congo (%)
Place of birth for the foreign-born population - Democratic Republic of Congo (Zaire) (%)
Place of birth for the foreign-born population - Other Middle Africa (%)
Place of birth for the foreign-born population - Egypt (%)
Place of birth for the foreign-born population - Morocco (%)
Place of birth for the foreign-born population - Sudan (%)
Place of birth for the foreign-born population - Other Northern Africa (%)
Place of birth for the foreign-born population - South Africa (%)
Place of birth for the foreign-born population - Other Southern Africa (%)
Place of birth for the foreign-born population - Cabo Verde (%)
Place of birth for the foreign-born population - Ghana (%)
Place of birth for the foreign-born population - Liberia (%)
Place of birth for the foreign-born population - Nigeria (%)
Place of birth for the foreign-born population - Senegal (%)
Place of birth for the foreign-born population - Sierra Leone (%)
Place of birth for the foreign-born population - Other Western Africa (%)
Place of birth for the foreign-born population - Australia (%)
Place of birth for the foreign-born population - New Zealand (%)
Place of birth for the foreign-born population - Fiji (%)
Place of birth for the foreign-born population - Micronesia (%)
Place of birth for the foreign-born population - Bahamas (%)
Place of birth for the foreign-born population - Barbados (%)
Place of birth for the foreign-born population - Cuba (%)
Place of birth for the foreign-born population - Dominica (%)
Place of birth for the foreign-born population - Dominican Republic (%)
Place of birth for the foreign-born population - Grenada (%)
Place of birth for the foreign-born population - Haiti (%)
Place of birth for the foreign-born population - Jamaica (%)
Place of birth for the foreign-born population - St. Vincent and the Grenadines (%)
Place of birth for the foreign-born population - Trinidad and Tobago (%)
Place of birth for the foreign-born population - West Indies (%)
Place of birth for the foreign-born population - Other Caribbean (%)
Place of birth for the foreign-born population - Belize (%)
Place of birth for the foreign-born population - Costa Rica (%)
Place of birth for the foreign-born population - El Salvador (%)
Place of birth for the foreign-born population - Guatemala (%)
Place of birth for the foreign-born population - Honduras (%)
Place of birth for the foreign-born population - Mexico (%)
Place of birth for the foreign-born population - Nicaragua (%)
Place of birth for the foreign-born population - Panama (%)
Place of birth for the foreign-born population - Other Central America (%)
Place of birth for the foreign-born population - Argentina (%)
Place of birth for the foreign-born population - Bolivia (%)
Place of birth for the foreign-born population - Brazil (%)
Place of birth for the foreign-born population - Chile (%)
Place of birth for the foreign-born population - Colombia (%)
Place of birth for the foreign-born population - Ecuador (%)
Place of birth for the foreign-born population - Guyana (%)
Place of birth for the foreign-born population - Peru (%)
Place of birth for the foreign-born population - Uruguay (%)
Place of birth for the foreign-born population - Venezuela (%)
Place of birth for the foreign-born population - Other South America (%)
Place of birth for the foreign-born population - Canada (%)
Place of birth for the foreign-born population - Other Northern America (%)
Place of birth for the foreign-born population - Other (%)
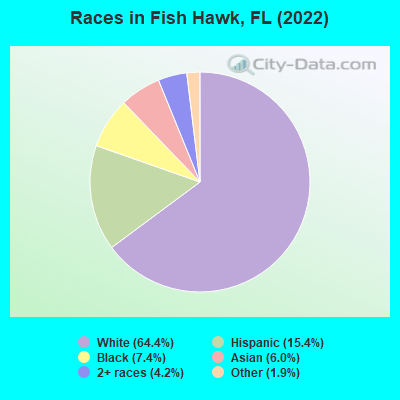
According to 2022 data, the most numerous races in Fish Hawk, FL are White alone (16,706 residents), Hispanic (3,993 residents), and Black alone (1,911 residents). 80.5% of Fish Hawk residents speak English at home. 13.6% of Fish Hawk, FL residents are foreign-born (5.8% born in Latin America, 3.8% born in Asia, 3.2% born in Europe), which is 54.9% less than the foreign-born rate of 21.0% across the entire state of Florida.
Race distribution in Fish Hawk
2000 2022
10,458,509 65.4% White alone 2,682,715 16.8% Hispanic 2,264,268 14.2% Black alone 261,693 1.6% Asian alone 236,954 1.5% Two or more races 42,358 0.3% American Indian alone 28,994 0.2% Other race alone 6,887 0.04% Native Hawaiian and Other
11,309,403 50.8% White alone 6,025,039 27.1% Hispanic 3,241,015 14.6% Black alone 861,630 3.9% Two or more races 623,692 2.8% Asian alone 152,054 0.7% Other race alone 22,504 0.1% American Indian alone 9,486 0.04% Native Hawaiian and Other
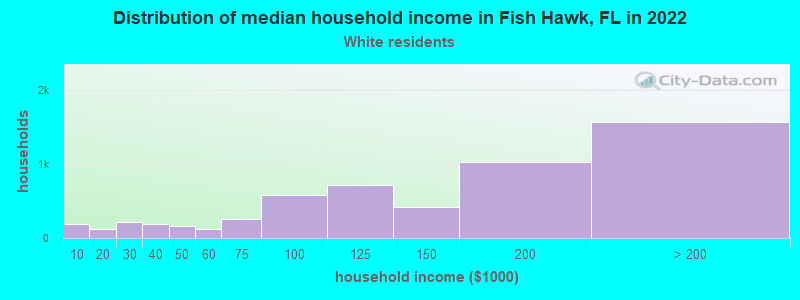
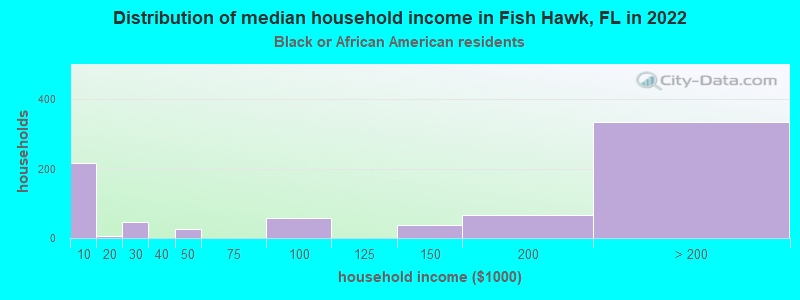
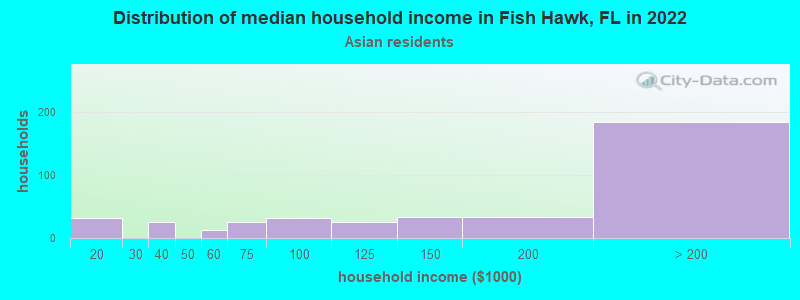
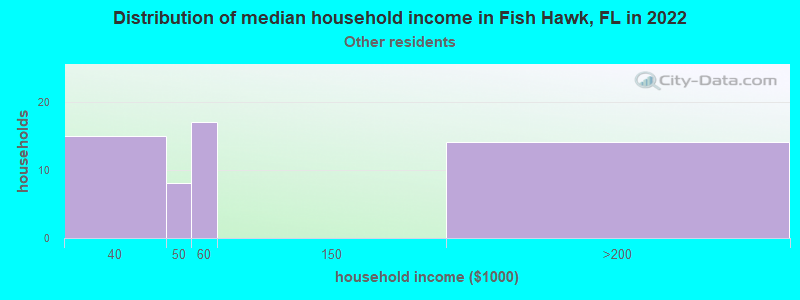
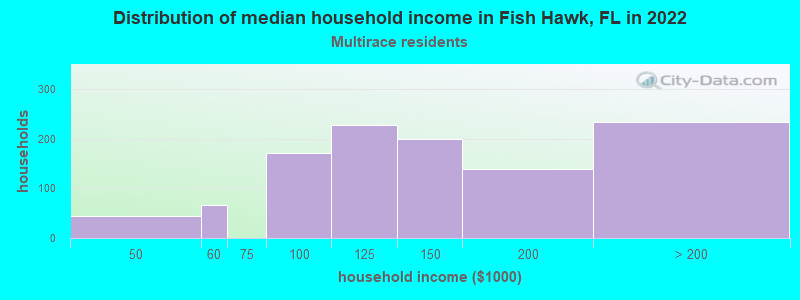
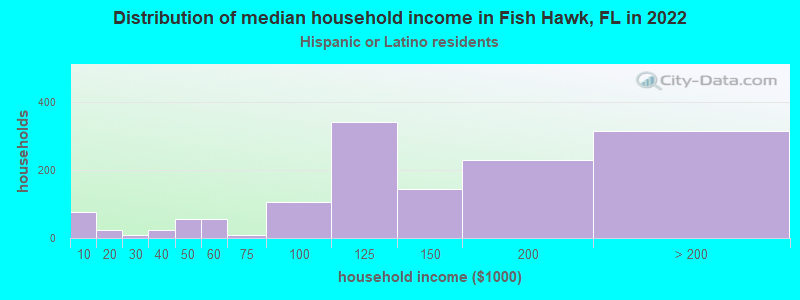
Income and house value in Fish Hawk Median household income in 2022 $134,258 White non-Hispanic householders$133,337 Asian householders$54,179 Some other race householders$130,182 Two or more races householders$121,728 Hispanic or Latino race householdersMedian 2022 house value $599,150 White Non-Hispanic householders$664,036 Black or African American householders $436,367 Asian householders$670,866 Hispanic or Latino householders
Median age by race in Fish Hawk
37.5 Median age for White residents37.0 38.0 36.4 Median age for Black or African American residents37.4 30.8 16.5 Median age for American Indian / Alaska Native residents-676,245,210.1 -655,399,060.4 35.6 Median age for Asian residents33.6 35.9 -848,484,847.6 Median age for Native Hawaiian / Pacific Islander residents-776,729,559.0 -490,118,576.6 3.1 Median age for Other race residents16.6 3.0 31.8 Median age for Two or more races residents31.4 34.2 37.5 Median age for White alone residents36.4 38.9 35.0 Median age for Hispanic or Latino residents36.1 35.0
Owner/renter occupied households by race in Fish Hawk
House owners and renters - White residents 4,578 84.4% Owner occupied844 15.6% Renter occupiedHouse owners and renters - Black or African American residents 338 46.7% Owner occupied386 53.3% Renter occupiedHouse owners and renters - American Indian / Alaska Native residents 14 100.0% Owner occupiedHouse owners and renters - Asian residents 379 87.0% Owner occupied57 13.0% Renter occupiedHouse owners and renters - Other race residents 20 31.1% Owner occupied45 68.9% Renter occupiedHouse owners and renters - Two or more races residents 897 79.9% Owner occupied225 20.1% Renter occupiedHouse owners and renters - White alone residents 4,439 85.1% Owner occupied776 14.9% Renter occupiedHouse owners and renters - Hispanic or Latino residents 1,007 78.2% Owner occupied280 21.8% Renter occupied
Language usage in Fish Hawk
English speakers - Total 80.5% of residents of Fish Hawk speak English at home.
10.0% of residents speak Spanish at home 1,985 82.5% Speak English very well422 17.5% Speak English less than very well9.4% of residents speak other language at home 1,607 70.5% Speak English very well671 29.5% Speak English less than very well
English speakers - Born in the United States 93.7% of residents of Fish Hawk speak English at home.
3.7% of residents speak Spanish at home 437 90.9% Speak English very well44 9.1% Speak English less than very well2.9% of residents speak other language at home 280 74.7% Speak English very well95 25.3% Speak English less than very well
English speakers - Native, born elsewhere 45.5% of residents of Fish Hawk speak English at home.
47.2% of residents speak Spanish at home 365 93.1% Speak English very well27 6.9% Speak English less than very well9.9% of residents speak other language at home 82 100.0% Speak English very well
English speakers - Foreign-born 23.2% of residents of Fish Hawk speak English at home.
29.2% of residents speak Spanish at home 727 68.8% Speak English very well329 31.2% Speak English less than very well46.0% of residents speak other language at home 1,095 65.7% Speak English very well571 34.3% Speak English less than very well
White (Caucasian) - Speak only English Native:
98.6% (15,143)Foreign-born:
51.1% (357)
White (Caucasian) - Speak another language Native:
3.9% (595)Foreign-born:
60.1% (419)
Black or African American - Speak only English Native:
99.3% (1,648)Foreign-born:
96.1% (277)
Black or African American - Speak another language Native:
0.9% (15)Foreign-born:
3.1% (9)
Asian - Speak only English Native:
35.8% (186)Foreign-born:
8.1% (84)
Asian - Speak another language Native:
66.9% (347)Foreign-born:
91.7% (952)
Other race - Speak another language Native:
32.7% (74)Foreign-born:
100.0% (117)
Two or more races - Speak only English Native:
69.0% (1,194)Foreign-born:
7.9% (84)
Two or more races - Speak another language Native:
29.6% (512)Foreign-born:
91.8% (978)
White alone - Speak only English Native:
97.6% (14,379)Foreign-born:
36.8% (297)
White alone - Speak another language Native:
2.4% (355)Foreign-born:
63.0% (508)
Hispanic or Latino - Speak only English Native:
59.1% (1,601)Foreign-born:
11.2% (125)
Hispanic or Latino - Speak another language Native:
44.1% (1,194)Foreign-born:
88.1% (983)
Foreign-born residents in Fish Hawk 3,517 residents are foreign born (5.8% Latin America , 3.8% Asia , 3.2% Europe ).
This city:
13.6%Florida:
21.1%
Marital status for residents in Fish Hawk Marital status - White (Caucasian) population 15 years and over
Males 23.9% Never married71.5% Now married0.1% Separated0.6% Widowed3.9% DivorcedFemales 19.5% Never married65.7% Now married3.0% Separated6.0% Widowed5.8% DivorcedWomen who gave birth in the past 12 months Now married:
95.1% (364)Unmarried:
4.9% (19)
Women who did not give birth in the past 12 months Now married:
65.6% (2,504)Unmarried:
34.4% (1,311)
Marital status - Black or African American population 15 years and over
Males 24.6% Never married67.0% Now married4.0% Separated0.0% Widowed4.4% DivorcedFemales 32.4% Never married39.5% Now married3.3% Separated10.8% Widowed13.9% DivorcedWomen who did not give birth in the past 12 months Now married:
44.2% (306)Unmarried:
55.8% (387)
Marital status - American Indian / Alaska Native population 15 years and over
Males 100.0% Never married0.0% Now married0.0% Separated0.0% Widowed0.0% DivorcedFemales 0.0% Never married0.0% Now married0.0% Separated0.0% Widowed100.0% DivorcedWomen who did not give birth in the past 12 months Now married:
0.0% (0)Unmarried:
100.0% (12)
Marital status - Asian population 15 years and over
Males 18.2% Never married81.8% Now married0.0% Separated0.0% Widowed0.0% DivorcedFemales 12.5% Never married63.4% Now married0.0% Separated17.0% Widowed7.1% DivorcedWomen who did not give birth in the past 12 months Now married:
67.0% (280)Unmarried:
33.0% (138)
Marital status - Other race population 15 years and over
Males 52.1% Never married47.9% Now married0.0% Separated0.0% Widowed0.0% DivorcedFemales 26.5% Never married57.7% Now married0.0% Separated7.7% Widowed8.2% DivorcedWomen who gave birth in the past 12 months Now married:
100.0% (15)Unmarried:
0.0% (0)
Women who did not give birth in the past 12 months Now married:
60.4% (140)Unmarried:
39.6% (92)
Marital status - Two or more races population 15 years and over
Males 24.0% Never married76.0% Now married0.0% Separated0.0% Widowed0.0% DivorcedFemales 22.0% Never married61.6% Now married0.0% Separated2.3% Widowed14.1% DivorcedWomen who did not give birth in the past 12 months Now married:
56.7% (504)Unmarried:
43.3% (384)
Marital status - White alone, not Hispanic / Latino population 15 years and over
Males 22.4% Never married73.0% Now married0.1% Separated0.7% Widowed3.9% DivorcedFemales 19.1% Never married66.6% Now married2.1% Separated6.4% Widowed5.8% DivorcedWomen who gave birth in the past 12 months Now married:
100.0% (429)Unmarried:
0.0% (0)
Women who did not give birth in the past 12 months Now married:
64.0% (2,350)Unmarried:
36.0% (1,323)
Marital status - Hispanic or Latino population 15 years and over
Males 29.6% Never married67.1% Now married0.0% Separated0.0% Widowed3.3% DivorcedFemales 18.9% Never married65.2% Now married5.8% Separated2.7% Widowed7.4% DivorcedWomen who gave birth in the past 12 months Now married:
33.3% (11)Unmarried:
66.7% (23)
Women who did not give birth in the past 12 months Now married:
73.0% (944)Unmarried:
27.0% (350)
Ancestries in Fish Hawk
1,202 10.0% English1,166 9.7% American857 7.1% German565 4.7% Italian442 3.7% Irish406 3.4% European272 2.3% Scottish240 2.0% Russian178 1.5% Polish121 1.0% Hungarian107 0.9% Dutch101 0.8% British91 0.8% West Indian87 0.7% Jamaican80 0.7% Bahamian68 0.6% Armenian66 0.5% Portuguese60 0.5% Scotch-Irish60 0.5% French Canadian57 0.5% Ukrainian48 0.4% Guyanese47 0.4% Canadian42 0.3% French36 0.3% Romanian32 0.3% Eastern European29 0.2% Norwegian26 0.2% Turkish25 0.2% Swiss25 0.2% Greek21 0.2% Lebanese20 0.2% Czech14 0.1% Scandinavian13 0.1% Croatian10 0.08% Swedish9 0.07% Serbian8 0.07% Moroccan8 0.07% Lithuanian7 0.06% Haitian3 0.02% Welsh
Geographical mobility in Fish Hawk Same house 1 year ago 13,968 84.5% White (Caucasian)1,636 84.3% Black or African American47 100.0% American Indian / Alaska Native1,216 77.4% Asian245 34.4% Other race2,242 74.0% Two or more races13,691 83.7% White alone, not Hispanic / Latino3,415 85.8% Hispanic or LatinoMoved within same county 1,173 7.1% White / Caucasian111 5.7% Black or African American42 2.7% Asian482 15.9% Two or more races1,304 8.0% White alone, not Hispanic / Latino168 4.2% Hispanic or LatinoMoved within same state 142 0.9% White / Caucasian22 1.1% Black or African American144 9.2% Asian77 10.8% Other race74 2.4% Two or more races164 1.0% White alone, not Hispanic / Latino82 2.1% Hispanic or LatinoMoved from different state 1,450 8.8% White / Caucasian178 9.2% Black or African American80 5.1% Asian192 26.9% Other race166 5.5% Two or more races1,252 7.7% White alone, not Hispanic / Latino326 8.2% Hispanic or LatinoMoved from abroad 16 0.1% White104 6.6% Asian57 1.4% Hispanic or Latino
Children Nativity (place of birth) in Fish Hawk
Children under 6 years - Living with two parents Both parents native 1,009 100.0% NativeBoth parents foreign-born 162 83.5% Native32 16.5% Foreign-bornOne native, one foreign-born parent 266 94.7% Native15 5.3% Foreign-bornChildren under 6 years - Living with one parent Native parent 415 100.0% NativeChildren 6 to 17 years - Living with two parents Both parents native 3,953 100.0% NativeBoth parents foreign-born 643 67.3% Native313 32.7% Foreign-bornOne native, one foreign-born parent 641 77.6% Native185 22.4% Foreign-bornChildren 6 to 17 years - Living with one parent Native parent 988 100.0% NativeForeign-born parent 20 54.5% Native17 45.5% Foreign-born
Grandparents responsible for own grandchildren in Fish Hawk
Grandparents (30 to 59 years) White / Caucasian 76 59.3% Responsible for grandchildren52 40.7% Not responsible for grandchildrenWhite alone, not Hispanic / Latino 92 68.5% Responsible for grandchildren42 31.5% Not responsible for grandchildrenGrandparents (60 years and over) White / Caucasian 19 15.1% Responsible for grandchildren109 84.9% Not responsible for grandchildrenWhite alone, not Hispanic / Latino 24 16.5% Responsible for grandchildren120 83.5% Not responsible for grandchildren