Races in Fernway, Pennsylvania (PA) Detailed Stats
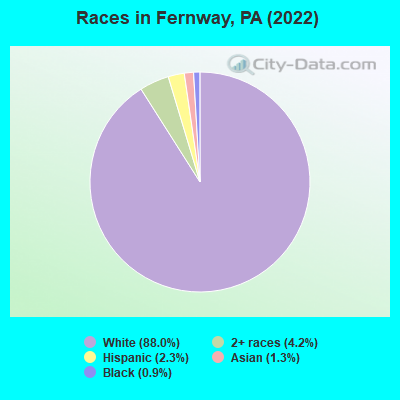
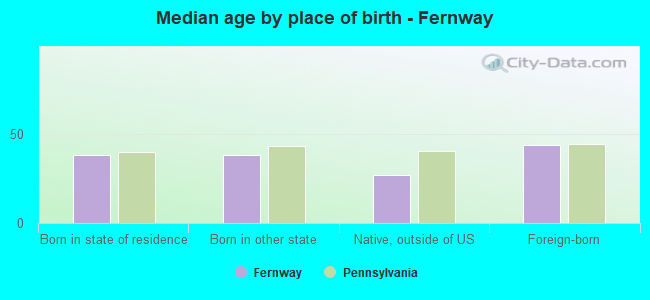
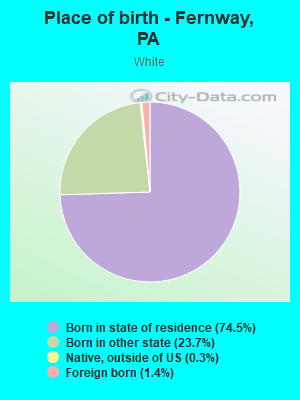
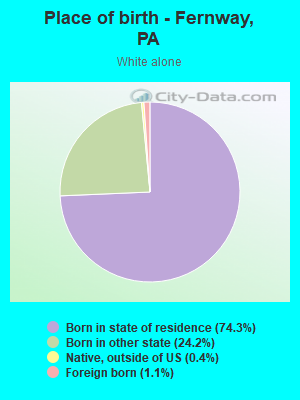
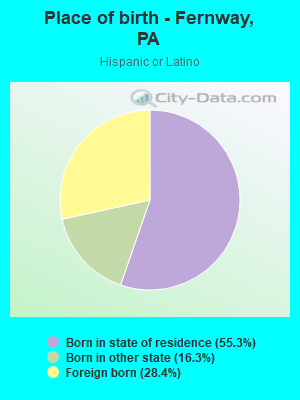
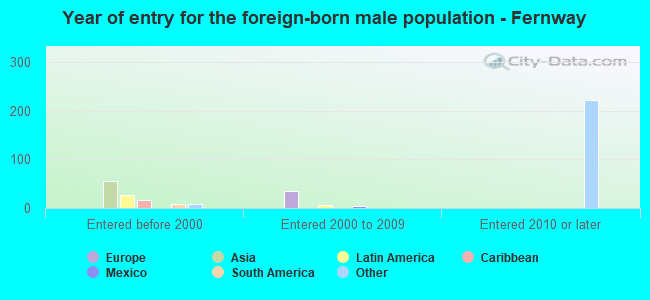
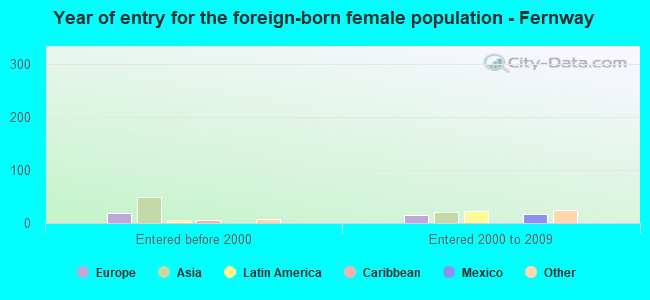
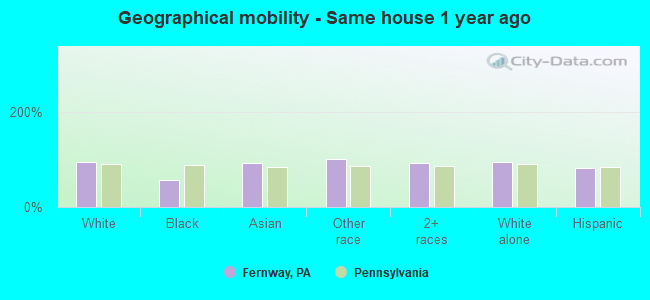
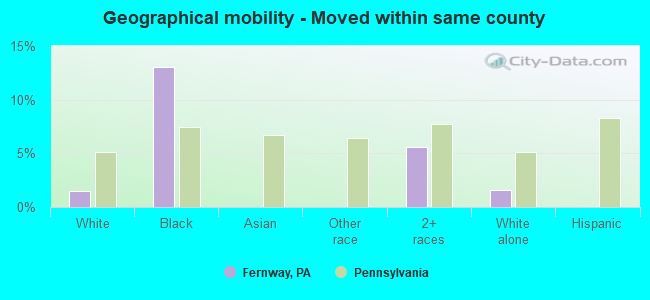
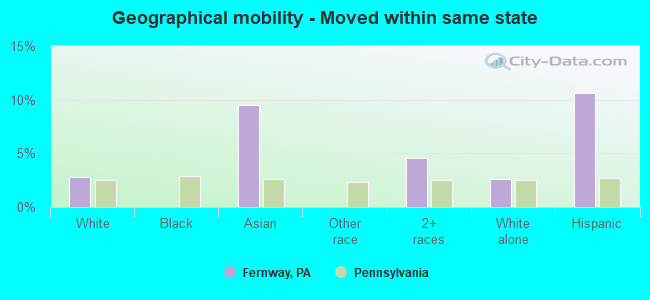
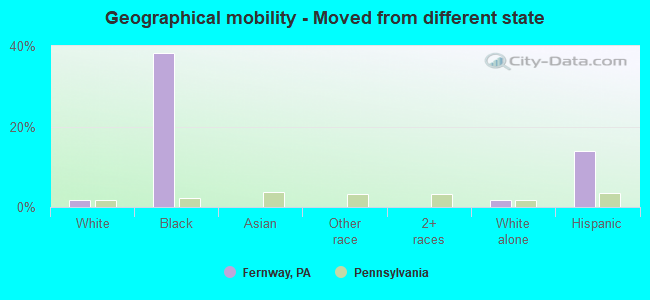
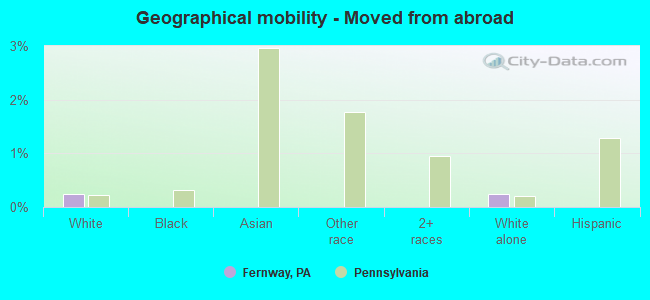
According to 2022 data, the most numerous races in Fernway, PA are White alone (10,980 residents), Black alone (115 residents), and Hispanic (281 residents). 93.0% of Fernway residents speak English at home. 2.8% of Fernway, PA residents are foreign-born (1.2% born in Asia, 0.7% born in Europe, 0.5% born in Latin America, 0.3% born in North America), which is 148.9% less than the foreign-born rate of 7.0% across the entire state of Pennsylvania.
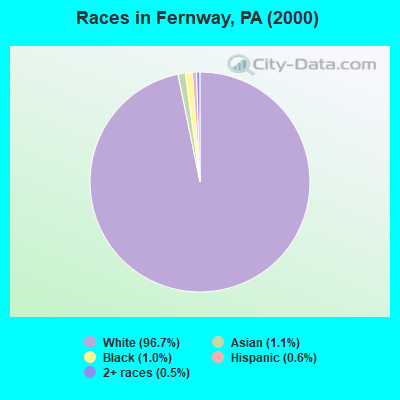
Race distribution in Fernway
2000 2022
10,322,455 84.1% White alone 1,202,437 9.8% Black alone 394,088 3.2% Hispanic 218,296 1.8% Asian alone 113,097 0.9% Two or more races 13,086 0.1% Other race alone 14,904 0.1% American Indian alone 2,691 0.02% Native Hawaiian and Other
9,487,228 73.1% White alone 1,311,581 10.1% Black alone 1,115,997 8.6% Hispanic 493,942 3.8% Two or more races 487,124 3.8% Asian alone 63,582 0.5% Other race alone 10,130 0.08% American Indian alone 2,424 0.02% Native Hawaiian and Other
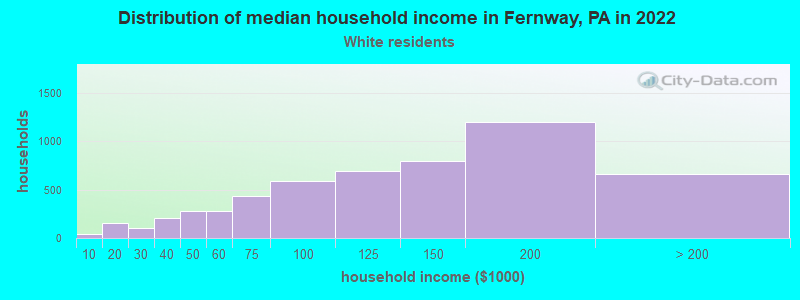
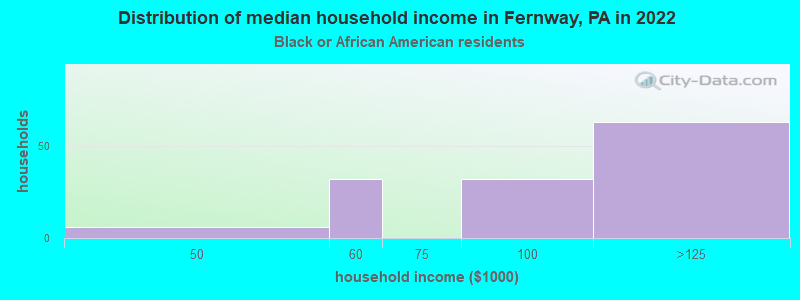
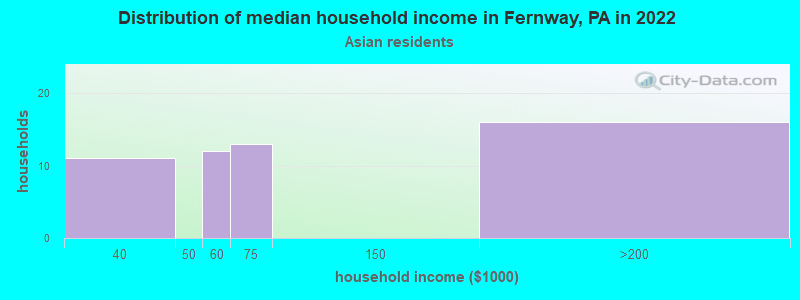
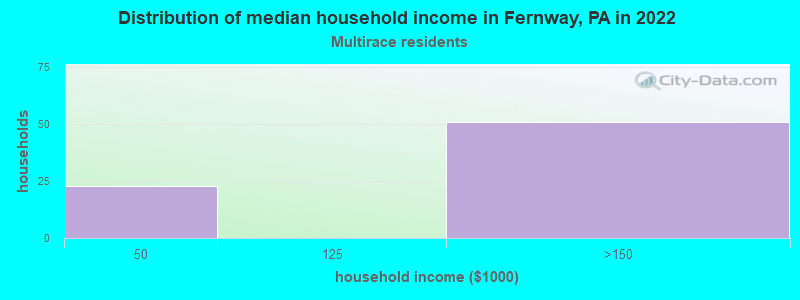
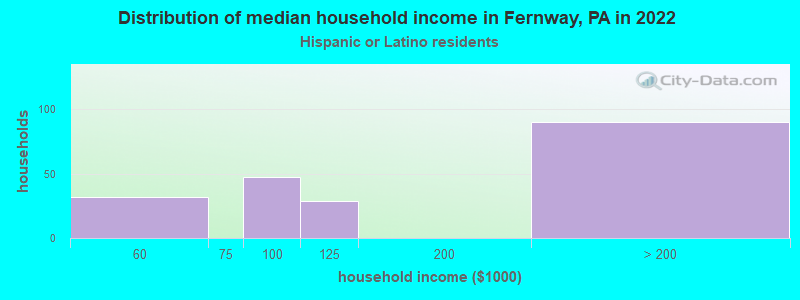
Income and house value in Fernway Median household income in 2022 $113,947 White non-Hispanic householders$118,034 Black householders$105,193 Asian householdersover $200,000 Two or more races householders$117,846 Hispanic or Latino race householdersMedian 2022 house value $372,098 White Non-Hispanic householders$149,382 Black or African American householders $540,493 Asian householders$184,148 Hispanic or Latino householders
Median age by race in Fernway
39.4 Median age for White residents38.6 41.8 37.3 Median age for Black or African American residents34.6 32.6 47.3 Median age for Asian residents40.7 53.5 88.5 Median age for Other race residents23.8 Median age for Two or more races residents16.7 31.8 39.8 Median age for White alone residents38.5 42.1 40.6 Median age for Hispanic or Latino residents30.6 37.0
Owner/renter occupied households by race in Fernway
House owners and renters - White residents 4,021 90.0% Owner occupied449 10.0% Renter occupiedHouse owners and renters - Black or African American residents 33 42.6% Owner occupied45 57.4% Renter occupiedHouse owners and renters - Asian residents 76 100.0% Owner occupiedHouse owners and renters - Other race residents 32 100.0% Owner occupiedHouse owners and renters - Two or more races residents 71 100.0% Owner occupiedHouse owners and renters - White alone residents 3,974 89.9% Owner occupied445 10.1% Renter occupiedHouse owners and renters - Hispanic or Latino residents 106 71.5% Owner occupied42 28.5% Renter occupied
Language usage in Fernway
English speakers - Total 93.0% of residents of Fernway speak English at home.
2.5% of residents speak Spanish at home 251 86.9% Speak English very well38 13.1% Speak English less than very well3.2% of residents speak other language at home 255 68.2% Speak English very well119 31.8% Speak English less than very well
English speakers - Born in the United States 97.3% of residents of Fernway speak English at home.
0.8% of residents speak Spanish at home 11 45.8% Speak English very well13 54.2% Speak English less than very well1.1% of residents speak other language at home 31 100.0% Speak English very well
English speakers - Native, born elsewhere 98.1% of residents of Fernway speak English at home.
8.7% of residents speak Spanish at home 9 100.0% Speak English very well
English speakers - Foreign-born 19.0% of residents of Fernway speak English at home.
22.5% of residents speak Spanish at home 79 83.2% Speak English very well16 16.8% Speak English less than very well59.5% of residents speak other language at home 139 55.4% Speak English very well112 44.6% Speak English less than very well
White (Caucasian) - Speak only English Native:
98.7% (10,151)Foreign-born:
33.9% (49)
White (Caucasian) - Speak another language Native:
1.6% (166)Foreign-born:
69.3% (100)
Black or African American - Speak only English Native:
70.5% (123)Foreign-born:
86.9% (8)
Two or more races - Speak another language Native:
21.0% (105)Foreign-born:
100.0% (161)
White alone - Speak only English Native:
98.5% (10,102)Foreign-born:
45.3% (50)
White alone - Speak another language Native:
1.7% (169)Foreign-born:
53.6% (59)
Hispanic or Latino - Speak another language Native:
54.3% (79)Foreign-born:
87.1% (60)
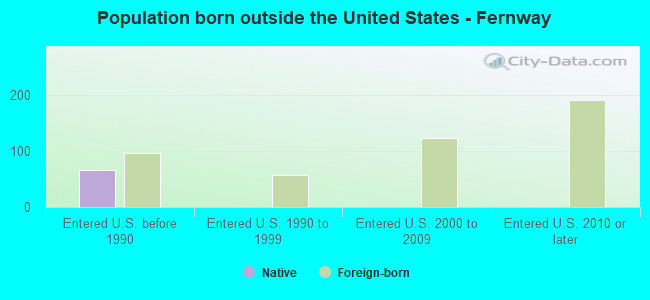
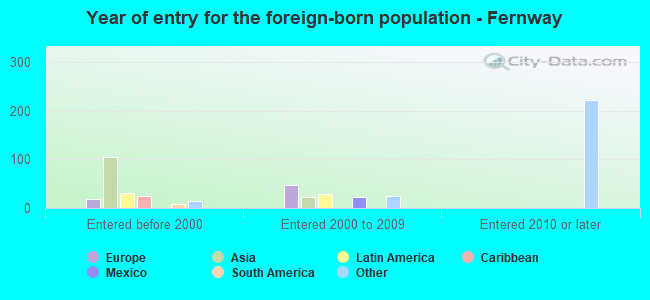
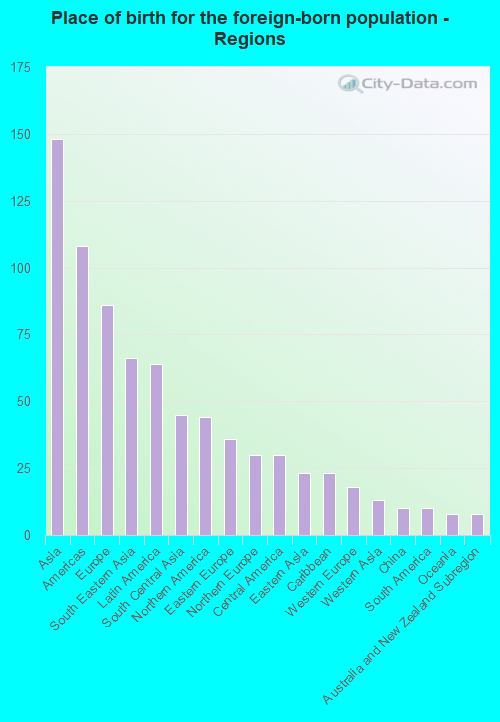
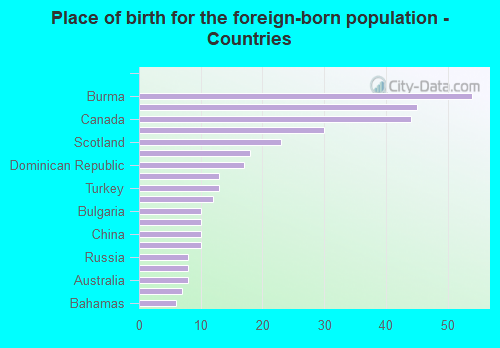
Foreign-born residents in Fernway 351 residents are foreign born (1.2% Asia , 0.7% Europe , 0.5% Latin America , 0.3% North America ).
This city:
2.8%Pennsylvania:
100.0%
Marital status for residents in Fernway Marital status - White (Caucasian) population 15 years and over
Males 26.1% Never married64.5% Now married2.2% Separated2.1% Widowed5.2% DivorcedFemales 22.8% Never married60.4% Now married0.9% Separated6.6% Widowed9.3% DivorcedWomen who gave birth in the past 12 months Now married:
88.1% (147)Unmarried:
11.9% (20)
Women who did not give birth in the past 12 months Now married:
56.3% (1,355)Unmarried:
43.7% (1,050)
Marital status - Black or African American population 15 years and over
Males 31.8% Never married68.2% Now married0.0% Separated0.0% Widowed0.0% DivorcedFemales 0.0% Never married82.6% Now married0.0% Separated8.7% Widowed8.7% DivorcedWomen who did not give birth in the past 12 months Now married:
87.5% (43)Unmarried:
12.5% (6)
Marital status - Asian population 15 years and over
Males 73.0% Never married27.0% Now married0.0% Separated0.0% Widowed0.0% DivorcedFemales 16.9% Never married32.4% Now married0.0% Separated18.3% Widowed32.4% DivorcedWomen who gave birth in the past 12 months Now married:
100.0% (15)Unmarried:
0.0% (0)
Women who did not give birth in the past 12 months Now married:
0.0% (0)Unmarried:
100.0% (15)
Marital status - Other race population 15 years and over
Males 100.0% Never married0.0% Now married0.0% Separated0.0% Widowed0.0% DivorcedFemales 100.0% Never married0.0% Now married0.0% Separated0.0% Widowed0.0% DivorcedWomen who did not give birth in the past 12 months Now married:
0.0% (0)Unmarried:
100.0% (17)
Marital status - Two or more races population 15 years and over
Males 63.5% Never married36.5% Now married0.0% Separated0.0% Widowed0.0% DivorcedFemales 80.0% Never married20.0% Now married0.0% Separated0.0% Widowed0.0% DivorcedWomen who did not give birth in the past 12 months Now married:
20.0% (39)Unmarried:
80.0% (156)
Marital status - White alone, not Hispanic / Latino population 15 years and over
Males 26.3% Never married64.6% Now married1.8% Separated2.1% Widowed5.3% DivorcedFemales 22.8% Never married60.3% Now married0.9% Separated6.6% Widowed9.4% DivorcedWomen who gave birth in the past 12 months Now married:
87.3% (136)Unmarried:
12.7% (20)
Women who did not give birth in the past 12 months Now married:
56.3% (1,352)Unmarried:
43.7% (1,048)
Marital status - Hispanic or Latino population 15 years and over
Males 20.9% Never married53.7% Now married25.4% Separated0.0% Widowed0.0% DivorcedFemales 24.5% Never married75.5% Now married0.0% Separated0.0% Widowed0.0% DivorcedWomen who gave birth in the past 12 months Now married:
100.0% (18)Unmarried:
0.0% (0)
Women who did not give birth in the past 12 months Now married:
45.5% (15)Unmarried:
54.5% (18)
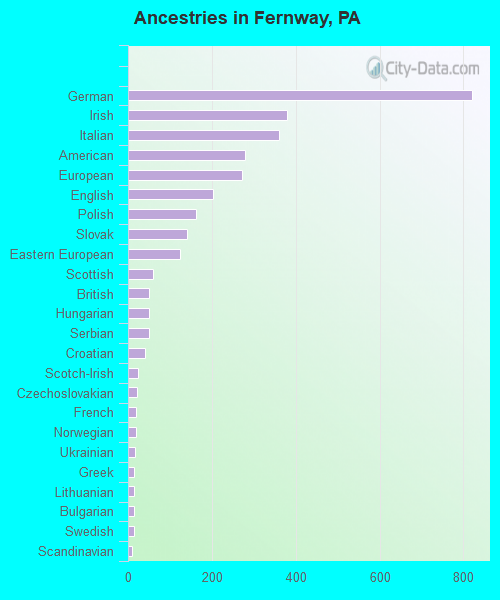
Ancestries in Fernway
820 20.7% German379 9.6% Irish360 9.1% Italian279 7.0% American271 6.8% European202 5.1% English162 4.1% Polish141 3.6% Slovak123 3.1% Eastern European60 1.5% Scottish50 1.3% British49 1.2% Hungarian49 1.2% Serbian41 1.0% Croatian23 0.6% Scotch-Irish22 0.6% Czechoslovakian18 0.5% French18 0.5% Norwegian16 0.4% Ukrainian15 0.4% Greek15 0.4% Lithuanian14 0.4% Bulgarian14 0.4% Swedish9 0.2% Scandinavian6 0.2% Canadian6 0.2% Dutch5 0.1% Austrian4 0.1% Russian4 0.1% Welsh
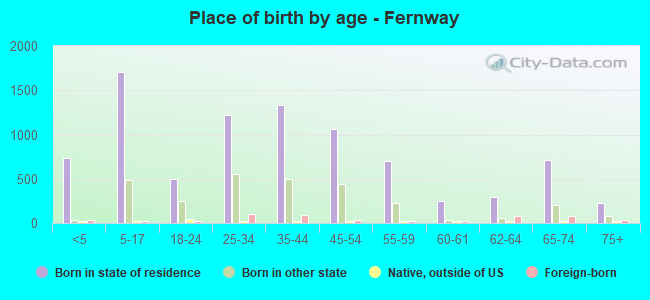
Children Nativity (place of birth) in Fernway
Children under 6 years - Living with two parents Both parents native 695 99.8% Native1 0.2% Foreign-bornBoth parents foreign-born 27 66.3% Native13 33.7% Foreign-bornOne native, one foreign-born parent 50 100.0% NativeChildren under 6 years - Living with one parent Native parent 164 100.0% NativeChildren 6 to 17 years - Living with two parents Both parents native 1,556 100.0% NativeBoth parents foreign-born 28 100.0% NativeOne native, one foreign-born parent 15 100.0% NativeChildren 6 to 17 years - Living with one parent Native parent 341 100.0% NativeForeign-born parent 4 49.3% Native4 50.7% Foreign-born
Grandparents responsible for own grandchildren in Fernway
Grandparents (30 to 59 years) White / Caucasian 11 23.3% Responsible for grandchildren35 76.7% Not responsible for grandchildrenWhite alone, not Hispanic / Latino 11 23.6% Responsible for grandchildren35 76.4% Not responsible for grandchildren
Grandparents (60 years and over) White / Caucasian 21 100.0% Not responsible for grandchildrenWhite alone, not Hispanic / Latino 22 100.0% Not responsible for grandchildren