Races in Farmington, Missouri (MO) Detailed Stats
Data:
Races - White alone (%)
Races - White alone (% change since 2000)
Races - Black alone (%)
Races - Black alone (% change since 2000)
Races - American Indian alone (%)
Races - American Indian alone (% change since 2000)
Races - Asian alone (%)
Races - Asian alone (% change since 2000)
Races - Hispanic (%)
Races - Hispanic (% change since 2000)
Races - Native Hawaiian and Other Pacific Islander alone (%)
Races - Native Hawaiian and Other Pacific Islander alone (% change since 2000)
Races - Two or more races(%)
Races - Two or more races(% change since 2000)
Races - Other race alone (%)
Races - Other race alone (% change since 2000)
Racial diversity
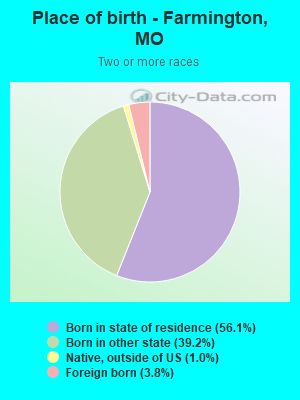
Place of birth - Born in state of residence (%)
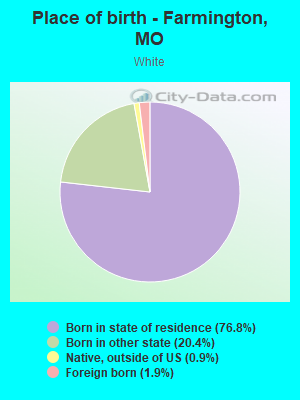
Place of birth - Born in state of residence (%) - White
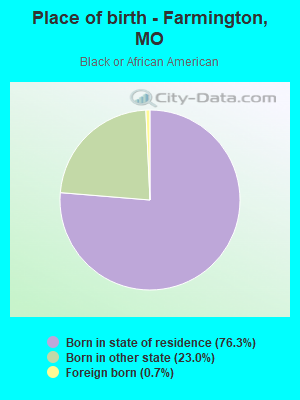
Place of birth - Born in state of residence (%) - Black or African American
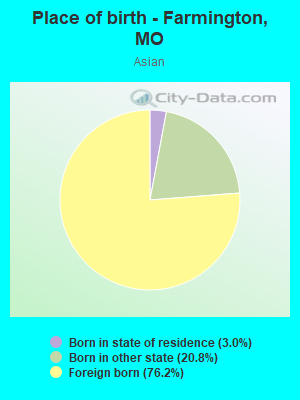
Place of birth - Born in state of residence (%) - Asian
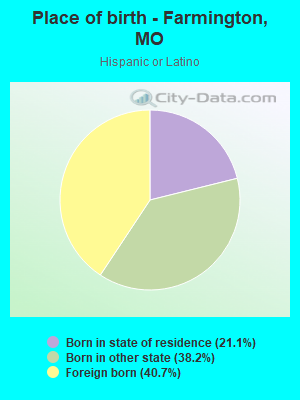
Place of birth - Born in state of residence (%) - Hispanic or Latino
Place of birth - Born in state of residence (%) - American Indian and Alaska Native
Place of birth - Born in state of residence (%) - Multirace
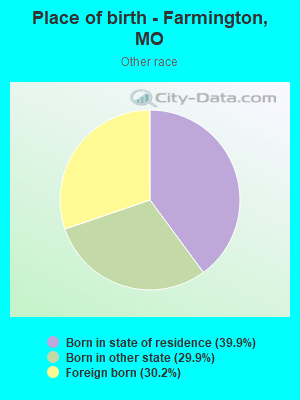
Place of birth - Born in state of residence (%) - Other Race
Place of birth - Born in other state (%)
Place of birth - Born in other state (%) - White
Place of birth - Born in other state (%) - Black or African American
Place of birth - Born in other state (%) - Asian
Place of birth - Born in other state (%) - Hispanic or Latino
Place of birth - Born in other state (%) - American Indian and Alaska Native
Place of birth - Born in other state (%) - Multirace
Place of birth - Born in other state (%) - Other Race
Place of birth - Native, outside of US (%)
Place of birth - Native, outside of US (%) - White
Place of birth - Native, outside of US (%) - Black or African American
Place of birth - Native, outside of US (%) - Asian
Place of birth - Native, outside of US (%) - Hispanic or Latino
Place of birth - Native, outside of US (%) - American Indian and Alaska Native
Place of birth - Native, outside of US (%) - Multirace
Place of birth - Native, outside of US (%) - Other Race
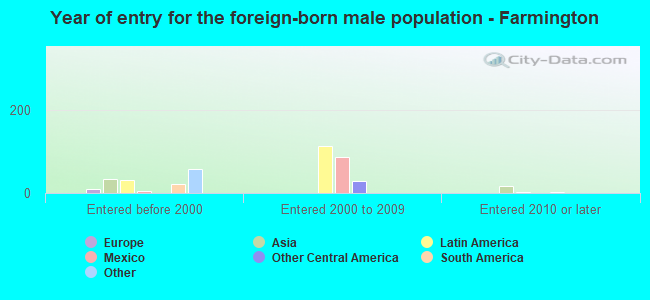
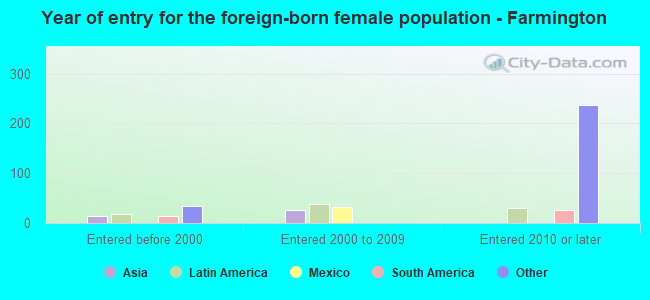
Place of birth - Foreign born (%)
Place of birth - Foreign born (%) - White
Place of birth - Foreign born (%) - Black or African American
Place of birth - Foreign born (%) - Asian
Place of birth - Foreign born (%) - Hispanic or Latino
Place of birth - Foreign born (%) - American Indian and Alaska Native
Place of birth - Foreign born (%) - Multirace
Place of birth - Foreign born (%) - Other Race
Residents speaking English at home (%)
Residents speaking English at home - Born in the United States (%)
Residents speaking English at home - Native, born elsewhere (%)
Residents speaking English at home - Foreign born (%)
Residents speaking Spanish at home (%)
Residents speaking Spanish at home - Born in the United States (%)
Residents speaking Spanish at home - Native, born elsewhere (%)
Residents speaking Spanish at home - Foreign born (%)
Residents speaking other language at home (%)
Residents speaking other language at home - Born in the United States (%)
Residents speaking other language at home - Native, born elsewhere (%)
Residents speaking other language at home - Foreign born (%)
Marital status - Never married (%)
Marital status - Now married (%)
Marital status - Separated (%)
Marital status - Widowed (%)
Marital status - Divorced (%)
Ancestries Reported - Arab (%)
Ancestries Reported - Czech (%)
Ancestries Reported - Danish (%)
Ancestries Reported - Dutch (%)
Ancestries Reported - English (%)
Ancestries Reported - French (%)
Ancestries Reported - French Canadian (%)
Ancestries Reported - German (%)
Ancestries Reported - Greek (%)
Ancestries Reported - Hungarian (%)
Ancestries Reported - Irish (%)
Ancestries Reported - Italian (%)
Ancestries Reported - Lithuanian (%)
Ancestries Reported - Norwegian (%)
Ancestries Reported - Polish (%)
Ancestries Reported - Portuguese (%)
Ancestries Reported - Russian (%)
Ancestries Reported - Scotch-Irish (%)
Ancestries Reported - Scottish (%)
Ancestries Reported - Slovak (%)
Ancestries Reported - Subsaharan African (%)
Ancestries Reported - Swedish (%)
Ancestries Reported - Swiss (%)
Ancestries Reported - Ukrainian (%)
Ancestries Reported - United States (%)
Ancestries Reported - Welsh (%)
Ancestries Reported - West Indian (%)
Ancestries Reported - Other (%)
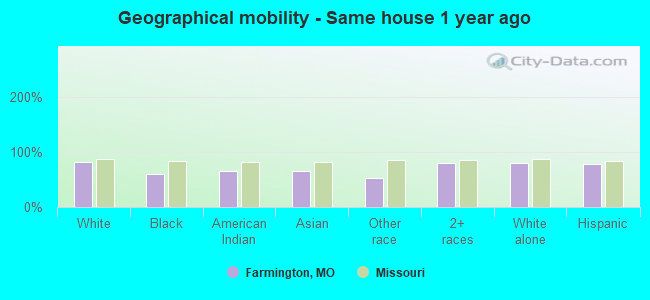
Geographical mobility - Same house 1 year ago (%)
Geographical mobility - Same house 1 year ago (%) - White
Geographical mobility - Same house 1 year ago (%) - Black or African American
Geographical mobility - Same house 1 year ago (%) - Asian
Geographical mobility - Same house 1 year ago (%) - Hispanic or Latino
Geographical mobility - Same house 1 year ago (%) - American Indian and Alaska Native
Geographical mobility - Same house 1 year ago (%) - Multirace
Geographical mobility - Same house 1 year ago (%) - Other Race
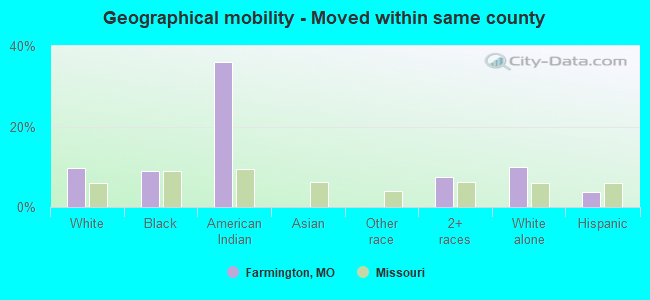
Geographical mobility - Moved within same county (%)
Geographical mobility - Moved within same county (%) - White
Geographical mobility - Moved within same county (%) - Black or African American
Geographical mobility - Moved within same county (%) - Asian
Geographical mobility - Moved within same county (%) - Hispanic or Latino
Geographical mobility - Moved within same county (%) - American Indian and Alaska Native
Geographical mobility - Moved within same county (%) - Multirace
Geographical mobility - Moved within same county (%) - Other Race
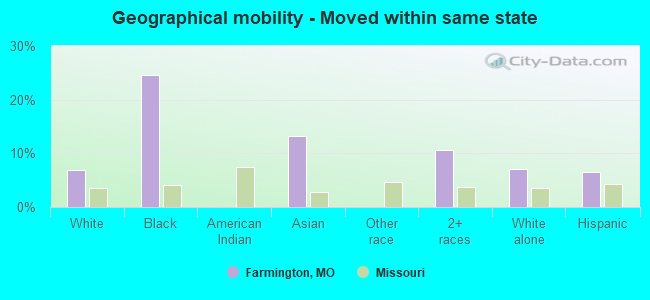
Geographical mobility - Moved from different county within same state (%)
Geographical mobility - Moved from different county within same state (%) - White
Geographical mobility - Moved from different county within same state (%) - Black or African American
Geographical mobility - Moved from different county within same state (%) - Asian
Geographical mobility - Moved from different county within same state (%) - Hispanic or Latino
Geographical mobility - Moved from different county within same state (%) - American Indian and Alaska Native
Geographical mobility - Moved from different county within same state (%) - Multirace
Geographical mobility - Moved from different county within same state (%) - Other Race
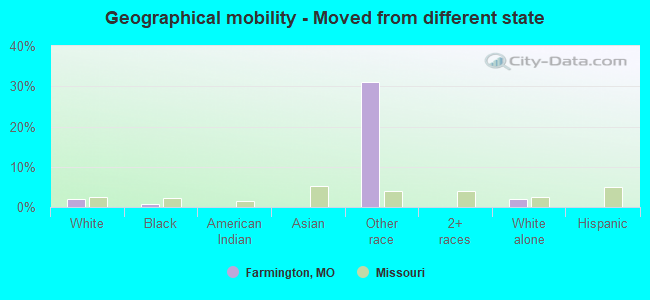
Geographical mobility - Moved from different state (%)
Geographical mobility - Moved from different state (%) - White
Geographical mobility - Moved from different state (%) - Black or African American
Geographical mobility - Moved from different state (%) - Asian
Geographical mobility - Moved from different state (%) - Hispanic or Latino
Geographical mobility - Moved from different state (%) - American Indian and Alaska Native
Geographical mobility - Moved from different state (%) - Multirace
Geographical mobility - Moved from different state (%) - Other Race
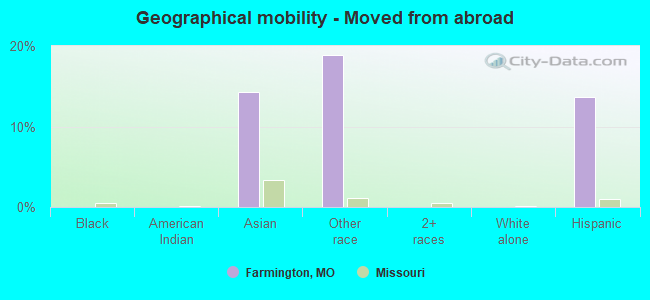
Geographical mobility - Moved from abroad (%)
Geographical mobility - Moved from abroad (%) - White
Geographical mobility - Moved from abroad (%) - Black or African American
Geographical mobility - Moved from abroad (%) - Asian
Geographical mobility - Moved from abroad (%) - Hispanic or Latino
Geographical mobility - Moved from abroad (%) - American Indian and Alaska Native
Geographical mobility - Moved from abroad (%) - Multirace
Geographical mobility - Moved from abroad (%) - Other Race
Place of birth for the foreign-born population - Ireland (%)
Place of birth for the foreign-born population - Denmark (%)
Place of birth for the foreign-born population - Norway (%)
Place of birth for the foreign-born population - Sweden (%)
Place of birth for the foreign-born population - United Kingdom (%)
Place of birth for the foreign-born population - England (%)
Place of birth for the foreign-born population - Scotland (%)
Place of birth for the foreign-born population - Other Northern Europe (%)
Place of birth for the foreign-born population - Austria (%)
Place of birth for the foreign-born population - Belgium (%)
Place of birth for the foreign-born population - France (%)
Place of birth for the foreign-born population - Germany (%)
Place of birth for the foreign-born population - Netherlands (%)
Place of birth for the foreign-born population - Switzerland (%)
Place of birth for the foreign-born population - Other Western Europe (%)
Place of birth for the foreign-born population - Greece (%)
Place of birth for the foreign-born population - Italy (%)
Place of birth for the foreign-born population - Portugal (%)
Place of birth for the foreign-born population - Spain (%)
Place of birth for the foreign-born population - Other Southern Europe (%)
Place of birth for the foreign-born population - Albania (%)
Place of birth for the foreign-born population - Belarus (%)
Place of birth for the foreign-born population - Bosnia and Herzegovina (%)
Place of birth for the foreign-born population - Bulgaria (%)
Place of birth for the foreign-born population - Croatia (%)
Place of birth for the foreign-born population - Czechoslovakia (%)
Place of birth for the foreign-born population - Hungary (%)
Place of birth for the foreign-born population - Latvia (%)
Place of birth for the foreign-born population - Lithuania (%)
Place of birth for the foreign-born population - North Macedonia (Macedonia) (%)
Place of birth for the foreign-born population - Moldova (%)
Place of birth for the foreign-born population - Poland (%)
Place of birth for the foreign-born population - Romania (%)
Place of birth for the foreign-born population - Russia (%)
Place of birth for the foreign-born population - Serbia (%)
Place of birth for the foreign-born population - Ukraine (%)
Place of birth for the foreign-born population - Other Eastern Europe (%)
Place of birth for the foreign-born population - China (%)
Place of birth for the foreign-born population - Hong Kong (%)
Place of birth for the foreign-born population - Taiwan (%)
Place of birth for the foreign-born population - Japan (%)
Place of birth for the foreign-born population - Korea (%)
Place of birth for the foreign-born population - Other Eastern Asia (%)
Place of birth for the foreign-born population - Afghanistan (%)
Place of birth for the foreign-born population - Bangladesh (%)
Place of birth for the foreign-born population - India (%)
Place of birth for the foreign-born population - Iran (%)
Place of birth for the foreign-born population - Kazakhstan (%)
Place of birth for the foreign-born population - Nepal (%)
Place of birth for the foreign-born population - Pakistan (%)
Place of birth for the foreign-born population - Sri Lanka (%)
Place of birth for the foreign-born population - Uzbekistan (%)
Place of birth for the foreign-born population - Other South Central Asia (%)
Place of birth for the foreign-born population - Burma (%)
Place of birth for the foreign-born population - Cambodia (%)
Place of birth for the foreign-born population - Indonesia (%)
Place of birth for the foreign-born population - Laos (%)
Place of birth for the foreign-born population - Malaysia (%)
Place of birth for the foreign-born population - Philippines (%)
Place of birth for the foreign-born population - Singapore (%)
Place of birth for the foreign-born population - Thailand (%)
Place of birth for the foreign-born population - Vietnam (%)
Place of birth for the foreign-born population - Other South Eastern Asia (%)
Place of birth for the foreign-born population - Armenia (%)
Place of birth for the foreign-born population - Iraq (%)
Place of birth for the foreign-born population - Israel (%)
Place of birth for the foreign-born population - Jordan (%)
Place of birth for the foreign-born population - Kuwait (%)
Place of birth for the foreign-born population - Lebanon (%)
Place of birth for the foreign-born population - Saudi Arabia (%)
Place of birth for the foreign-born population - Syria (%)
Place of birth for the foreign-born population - Turkey (%)
Place of birth for the foreign-born population - Yemen (%)
Place of birth for the foreign-born population - Other Western Asia (%)
Place of birth for the foreign-born population - Eritrea (%)
Place of birth for the foreign-born population - Ethiopia (%)
Place of birth for the foreign-born population - Kenya (%)
Place of birth for the foreign-born population - Somalia (%)
Place of birth for the foreign-born population - Uganda (%)
Place of birth for the foreign-born population - Zimbabwe (%)
Place of birth for the foreign-born population - Other Eastern Africa (%)
Place of birth for the foreign-born population - Cameroon (%)
Place of birth for the foreign-born population - Congo (%)
Place of birth for the foreign-born population - Democratic Republic of Congo (Zaire) (%)
Place of birth for the foreign-born population - Other Middle Africa (%)
Place of birth for the foreign-born population - Egypt (%)
Place of birth for the foreign-born population - Morocco (%)
Place of birth for the foreign-born population - Sudan (%)
Place of birth for the foreign-born population - Other Northern Africa (%)
Place of birth for the foreign-born population - South Africa (%)
Place of birth for the foreign-born population - Other Southern Africa (%)
Place of birth for the foreign-born population - Cabo Verde (%)
Place of birth for the foreign-born population - Ghana (%)
Place of birth for the foreign-born population - Liberia (%)
Place of birth for the foreign-born population - Nigeria (%)
Place of birth for the foreign-born population - Senegal (%)
Place of birth for the foreign-born population - Sierra Leone (%)
Place of birth for the foreign-born population - Other Western Africa (%)
Place of birth for the foreign-born population - Australia (%)
Place of birth for the foreign-born population - New Zealand (%)
Place of birth for the foreign-born population - Fiji (%)
Place of birth for the foreign-born population - Micronesia (%)
Place of birth for the foreign-born population - Bahamas (%)
Place of birth for the foreign-born population - Barbados (%)
Place of birth for the foreign-born population - Cuba (%)
Place of birth for the foreign-born population - Dominica (%)
Place of birth for the foreign-born population - Dominican Republic (%)
Place of birth for the foreign-born population - Grenada (%)
Place of birth for the foreign-born population - Haiti (%)
Place of birth for the foreign-born population - Jamaica (%)
Place of birth for the foreign-born population - St. Vincent and the Grenadines (%)
Place of birth for the foreign-born population - Trinidad and Tobago (%)
Place of birth for the foreign-born population - West Indies (%)
Place of birth for the foreign-born population - Other Caribbean (%)
Place of birth for the foreign-born population - Belize (%)
Place of birth for the foreign-born population - Costa Rica (%)
Place of birth for the foreign-born population - El Salvador (%)
Place of birth for the foreign-born population - Guatemala (%)
Place of birth for the foreign-born population - Honduras (%)
Place of birth for the foreign-born population - Mexico (%)
Place of birth for the foreign-born population - Nicaragua (%)
Place of birth for the foreign-born population - Panama (%)
Place of birth for the foreign-born population - Other Central America (%)
Place of birth for the foreign-born population - Argentina (%)
Place of birth for the foreign-born population - Bolivia (%)
Place of birth for the foreign-born population - Brazil (%)
Place of birth for the foreign-born population - Chile (%)
Place of birth for the foreign-born population - Colombia (%)
Place of birth for the foreign-born population - Ecuador (%)
Place of birth for the foreign-born population - Guyana (%)
Place of birth for the foreign-born population - Peru (%)
Place of birth for the foreign-born population - Uruguay (%)
Place of birth for the foreign-born population - Venezuela (%)
Place of birth for the foreign-born population - Other South America (%)
Place of birth for the foreign-born population - Canada (%)
Place of birth for the foreign-born population - Other Northern America (%)
Place of birth for the foreign-born population - Other (%)
Latest news about races in Farmington, MO collected exclusively by city-data.com from local newspapers, TV, and radio stations
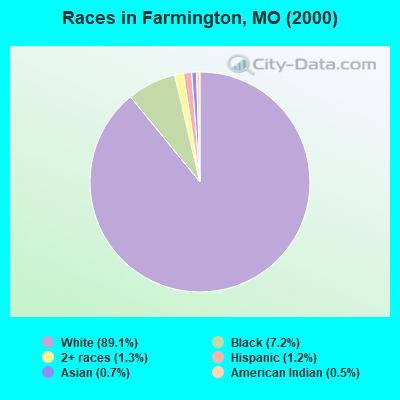
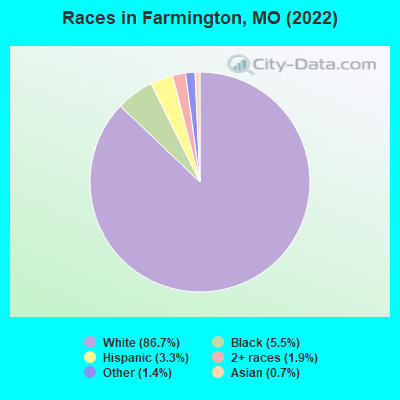
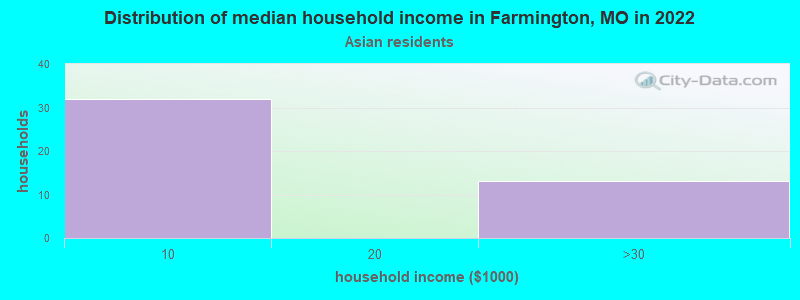
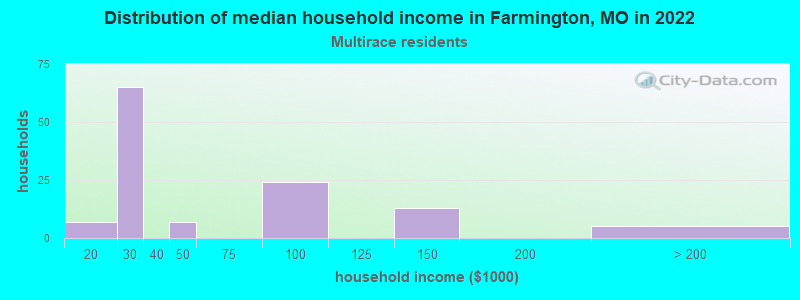
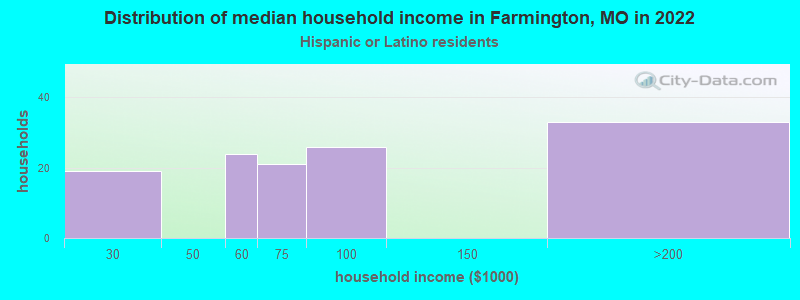
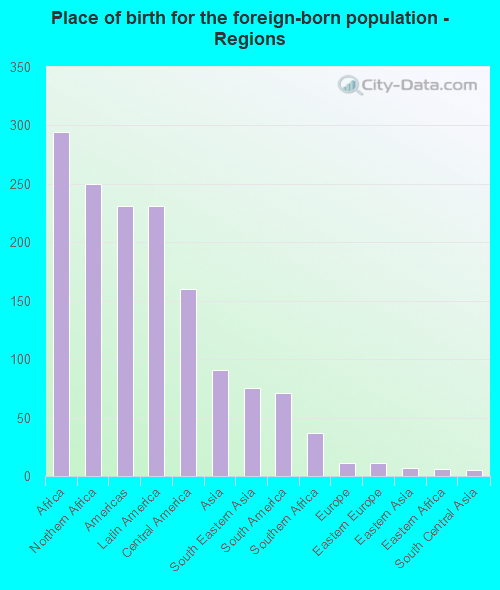
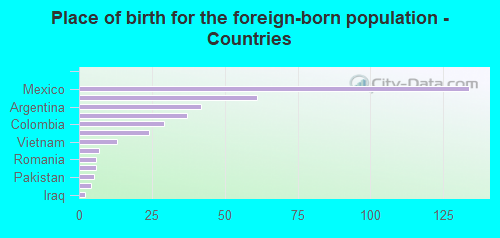
According to 2022 data, the most numerous races in Farmington, MO are White alone (15,538 residents), Black alone (992 residents), and Two or more races (344 residents). 97.5% of Farmington residents speak English at home. 3.5% of Farmington, MO residents are foreign-born (1.7% born in Africa, 1.3% born in Latin America, 0.5% born in Asia), which is 13.8% less than the foreign-born rate of 4.0% across the entire state of Missouri.
Race distribution in Farmington
2000 2022
4,686,474 83.8% White alone 625,667 11.2% Black alone 118,592 2.1% Hispanic 71,905 1.3% Two or more races 61,041 1.1% Asian alone 23,302 0.4% American Indian alone 5,291 0.09% Other race alone 2,939 0.05% Native Hawaiian and Other
4,733,411 76.6% White alone 656,739 10.6% Black alone 316,300 5.1% Two or more races 291,763 4.7% Hispanic 132,436 2.1% Asian alone 27,467 0.4% Other race alone 12,313 0.2% American Indian alone 7,528 0.1% Native Hawaiian and Other
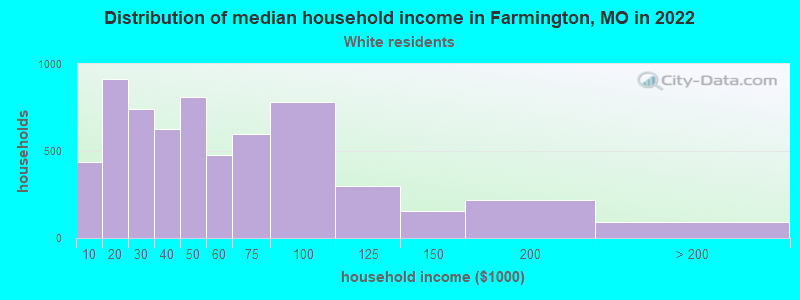
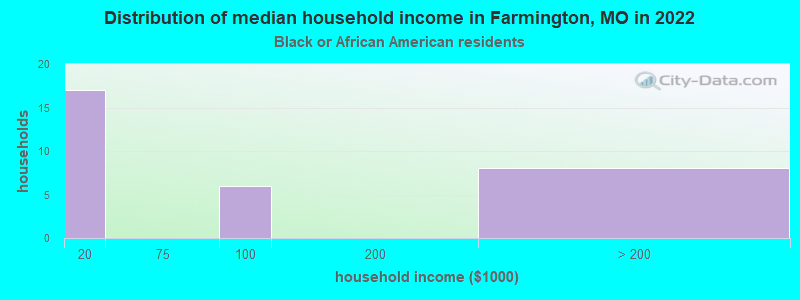
Income and house value in Farmington Median household income in 2022 $41,686 White non-Hispanic householdersMedian 2022 house value $198,351 White Non-Hispanic householders$146,765 Black or African American householders $454,100 Asian householders$171,710 Two or more races householders$181,640 Hispanic or Latino householders
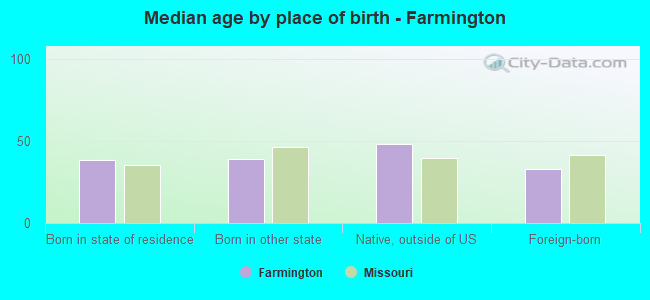
Median age by race in Farmington
38.7 Median age for White residents38.9 38.4 30.8 Median age for Black or African American residents32.1 29.2 46.9 Median age for American Indian / Alaska Native residents56.6 -576,856,648.8 41.5 Median age for Asian residents35.0 52.1 -666,666,666.0 Median age for Native Hawaiian / Pacific Islander residents-666,666,666.0 -666,666,666.0 33.6 Median age for Other race residents36.3 -684,343,433.7 23.2 Median age for Two or more races residents26.8 47.8 38.6 Median age for White alone residents39.0 38.3 16.5 Median age for Hispanic or Latino residents16.3 17.8
Owner/renter occupied households by race in Farmington
House owners and renters - White residents 3,145 50.9% Owner occupied3,029 49.1% Renter occupiedHouse owners and renters - Black or African American residents 11 37.3% Owner occupied19 62.7% Renter occupiedHouse owners and renters - American Indian / Alaska Native residents 1 100.0% Owner occupiedHouse owners and renters - Asian residents 49 100.0% Renter occupiedHouse owners and renters - Other race residents 148 100.0% Owner occupiedHouse owners and renters - Two or more races residents 58 64.7% Owner occupied32 35.3% Renter occupiedHouse owners and renters - White alone residents 3,118 50.8% Owner occupied3,017 49.2% Renter occupiedHouse owners and renters - Hispanic or Latino residents 92 70.7% Owner occupied38 29.3% Renter occupied
Language usage in Farmington
English speakers - Total 97.5% of residents of Farmington speak English at home.
1.8% of residents speak Spanish at home 177 57.3% Speak English very well132 42.7% Speak English less than very well0.6% of residents speak other language at home 66 66.0% Speak English very well34 34.0% Speak English less than very well
English speakers - Born in the United States 97.4% of residents of Farmington speak English at home.
1.5% of residents speak Spanish at home 56 100.0% Speak English very well1.0% of residents speak other language at home 19 50.0% Speak English very well19 50.0% Speak English less than very well
English speakers - Native, born elsewhere 98.8% of residents of Farmington speak English at home.
2.4% of residents speak other language at home 4 100.0% Speak English very well
English speakers - Foreign-born 56.4% of residents of Farmington speak English at home.
35.3% of residents speak Spanish at home 92 41.3% Speak English very well131 58.7% Speak English less than very well5.5% of residents speak other language at home 21 60.0% Speak English very well14 40.0% Speak English less than very well
White (Caucasian) - Speak only English Native:
99.5% (14,541)Foreign-born:
82.7% (252)
White (Caucasian) - Speak another language Native:
0.7% (97)Foreign-born:
19.0% (58)
Black or African American - Speak another language Native:
0.7% (7)Foreign-born:
99.5% (7)
Asian - Speak only English Native:
14.7% (4)Foreign-born:
67.6% (62)
Asian - Speak another language Native:
73.9% (21)Foreign-born:
31.9% (29)
Two or more races - Speak another language Native:
2.9% (13)Foreign-born:
100.0% (18)
White alone - Speak only English Native:
99.4% (14,492)Foreign-born:
86.6% (241)
White alone - Speak another language Native:
0.6% (85)Foreign-born:
1.0% (3)
Hispanic or Latino - Speak only English Native:
90.0% (234)Foreign-born:
8.0% (19)
Hispanic or Latino - Speak another language Native:
11.4% (29)Foreign-born:
91.9% (221)
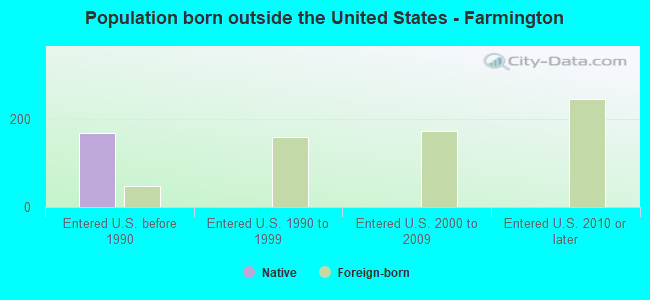
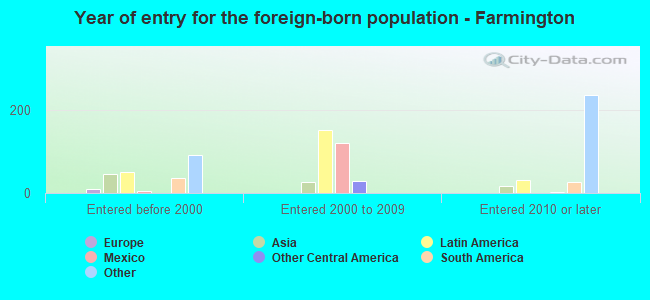
Foreign-born residents in Farmington 629 residents are foreign born (1.7% Africa , 1.3% Latin America , 0.5% Asia ).
This city:
3.5%Missouri:
4.2%
Marital status for residents in Farmington Marital status - White (Caucasian) population 15 years and over
Males 38.0% Never married36.4% Now married2.4% Separated2.8% Widowed20.4% DivorcedFemales 19.7% Never married45.7% Now married0.5% Separated14.7% Widowed19.4% DivorcedWomen who gave birth in the past 12 months Now married:
100.0% (55)Unmarried:
0.0% (0)
Women who did not give birth in the past 12 months Now married:
49.5% (1,463)Unmarried:
50.5% (1,491)
Marital status - Black or African American population 15 years and over
Males 68.9% Never married16.7% Now married7.1% Separated0.5% Widowed6.9% DivorcedFemales 77.1% Never married0.0% Now married12.4% Separated10.5% Widowed0.0% DivorcedWomen who did not give birth in the past 12 months Now married:
0.0% (0)Unmarried:
100.0% (76)
Marital status - Asian population 15 years and over
Males 10.9% Never married69.1% Now married20.0% Separated0.0% Widowed0.0% DivorcedFemales 5.1% Never married61.0% Now married0.0% Separated0.0% Widowed33.9% DivorcedWomen who did not give birth in the past 12 months Now married:
88.9% (26)Unmarried:
11.1% (3)
Marital status - Other race population 15 years and over
Males 40.4% Never married47.3% Now married0.0% Separated0.0% Widowed12.2% DivorcedFemales 0.0% Never married100.0% Now married0.0% Separated0.0% Widowed0.0% DivorcedWomen who gave birth in the past 12 months Now married:
100.0% (49)Unmarried:
0.0% (0)
Marital status - Two or more races population 15 years and over
Males 61.9% Never married11.5% Now married12.9% Separated0.0% Widowed13.7% DivorcedFemales 36.7% Never married24.2% Now married10.0% Separated5.0% Widowed24.2% DivorcedWomen who did not give birth in the past 12 months Now married:
34.0% (22)Unmarried:
66.0% (43)
Marital status - White alone, not Hispanic / Latino population 15 years and over
Males 38.1% Never married36.1% Now married2.3% Separated2.8% Widowed20.6% DivorcedFemales 19.2% Never married45.9% Now married0.6% Separated15.0% Widowed19.3% DivorcedWomen who gave birth in the past 12 months Now married:
100.0% (56)Unmarried:
0.0% (0)
Women who did not give birth in the past 12 months Now married:
50.0% (1,451)Unmarried:
50.0% (1,449)
Marital status - Hispanic or Latino population 15 years and over
Males 65.9% Never married18.5% Now married5.2% Separated0.0% Widowed10.5% DivorcedFemales 29.8% Never married47.4% Now married0.0% Separated0.0% Widowed22.8% DivorcedWomen who gave birth in the past 12 months Now married:
100.0% (44)Unmarried:
0.0% (0)
Women who did not give birth in the past 12 months Now married:
28.2% (22)Unmarried:
71.8% (56)
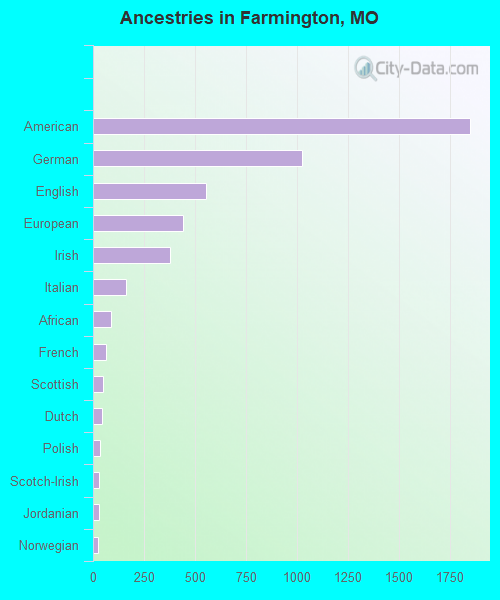
Ancestries in Farmington
1,850 27.0% American1,027 15.0% German553 8.1% English440 6.4% European380 5.5% Irish160 2.3% Italian87 1.3% African64 0.9% French47 0.7% Scottish43 0.6% Dutch35 0.5% Polish30 0.4% Scotch-Irish27 0.4% Jordanian24 0.4% Norwegian15 0.2% Danish13 0.2% Northern European11 0.2% French Canadian9 0.1% Romanian6 0.09% Russian6 0.09% Scandinavian3 0.04% Somali
Geographical mobility in Farmington Same house 1 year ago 12,860 81.3% White (Caucasian)570 60.0% Black or African American13 66.0% American Indian / Alaska Native80 65.8% Asian227 52.9% Other race396 80.8% Two or more races12,696 81.0% White alone, not Hispanic / Latino411 78.2% Hispanic or LatinoMoved within same county 1,527 9.6% White / Caucasian85 9.0% Black or African American7 36.1% American Indian / Alaska Native37 7.5% Two or more races1,545 9.9% White alone, not Hispanic / Latino20 3.8% Hispanic or LatinoMoved within same state 1,096 6.9% White / Caucasian234 24.6% Black or African American16 13.3% Asian52 10.7% Two or more races1,096 7.0% White alone, not Hispanic / Latino34 6.5% Hispanic or LatinoMoved from different state 302 1.9% White / Caucasian7 0.8% Black or African American134 31.1% Other race302 1.9% White alone, not Hispanic / LatinoMoved from abroad 4 0.0% White17 14.3% Asian81 18.9% Other race4 0.0% White alone, not Hispanic / Latino72 13.7% Hispanic or Latino
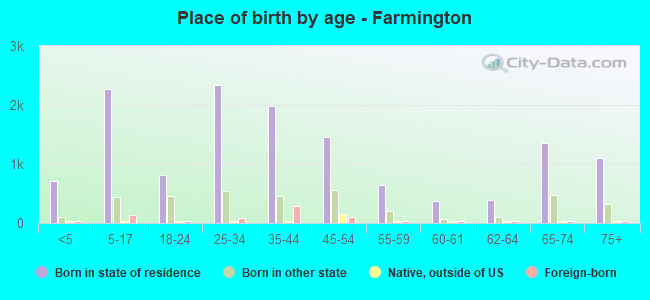
Children Nativity (place of birth) in Farmington
Children under 6 years - Living with two parents Both parents native 508 100.0% NativeOne native, one foreign-born parent 66 100.0% NativeChildren under 6 years - Living with one parent Native parent 312 100.0% NativeForeign-born parent 55 100.0% NativeChildren 6 to 17 years - Living with two parents Both parents native 1,233 100.0% NativeBoth parents foreign-born 29 100.0% NativeChildren 6 to 17 years - Living with one parent Native parent 1,022 100.0% NativeForeign-born parent 25 51.6% Native23 48.4% Foreign-born
Grandparents responsible for own grandchildren in Farmington
Grandparents (30 to 59 years) White / Caucasian 9 14.3% Responsible for grandchildren53 85.7% Not responsible for grandchildrenWhite alone, not Hispanic / Latino 9 14.2% Responsible for grandchildren54 85.8% Not responsible for grandchildrenGrandparents (60 years and over) White / Caucasian 89 62.8% Responsible for grandchildren53 37.2% Not responsible for grandchildrenWhite alone, not Hispanic / Latino 90 74.1% Responsible for grandchildren31 25.9% Not responsible for grandchildren