Races in Fargo, North Dakota (ND) Detailed Stats
Data:
Races - White alone (%)
Races - White alone (% change since 2000)
Races - Black alone (%)
Races - Black alone (% change since 2000)
Races - American Indian alone (%)
Races - American Indian alone (% change since 2000)
Races - Asian alone (%)
Races - Asian alone (% change since 2000)
Races - Hispanic (%)
Races - Hispanic (% change since 2000)
Races - Native Hawaiian and Other Pacific Islander alone (%)
Races - Native Hawaiian and Other Pacific Islander alone (% change since 2000)
Races - Two or more races(%)
Races - Two or more races(% change since 2000)
Races - Other race alone (%)
Races - Other race alone (% change since 2000)
Racial diversity
Place of birth - Born in state of residence (%)
Place of birth - Born in state of residence (%) - White
Place of birth - Born in state of residence (%) - Black or African American
Place of birth - Born in state of residence (%) - Asian
Place of birth - Born in state of residence (%) - Hispanic or Latino
Place of birth - Born in state of residence (%) - American Indian and Alaska Native
Place of birth - Born in state of residence (%) - Multirace
Place of birth - Born in state of residence (%) - Other Race
Place of birth - Born in other state (%)
Place of birth - Born in other state (%) - White
Place of birth - Born in other state (%) - Black or African American
Place of birth - Born in other state (%) - Asian
Place of birth - Born in other state (%) - Hispanic or Latino
Place of birth - Born in other state (%) - American Indian and Alaska Native
Place of birth - Born in other state (%) - Multirace
Place of birth - Born in other state (%) - Other Race
Place of birth - Native, outside of US (%)
Place of birth - Native, outside of US (%) - White
Place of birth - Native, outside of US (%) - Black or African American
Place of birth - Native, outside of US (%) - Asian
Place of birth - Native, outside of US (%) - Hispanic or Latino
Place of birth - Native, outside of US (%) - American Indian and Alaska Native
Place of birth - Native, outside of US (%) - Multirace
Place of birth - Native, outside of US (%) - Other Race
Place of birth - Foreign born (%)
Place of birth - Foreign born (%) - White
Place of birth - Foreign born (%) - Black or African American
Place of birth - Foreign born (%) - Asian
Place of birth - Foreign born (%) - Hispanic or Latino
Place of birth - Foreign born (%) - American Indian and Alaska Native
Place of birth - Foreign born (%) - Multirace
Place of birth - Foreign born (%) - Other Race
Residents speaking English at home (%)
Residents speaking English at home - Born in the United States (%)
Residents speaking English at home - Native, born elsewhere (%)
Residents speaking English at home - Foreign born (%)
Residents speaking Spanish at home (%)
Residents speaking Spanish at home - Born in the United States (%)
Residents speaking Spanish at home - Native, born elsewhere (%)
Residents speaking Spanish at home - Foreign born (%)
Residents speaking other language at home (%)
Residents speaking other language at home - Born in the United States (%)
Residents speaking other language at home - Native, born elsewhere (%)
Residents speaking other language at home - Foreign born (%)
Marital status - Never married (%)
Marital status - Now married (%)
Marital status - Separated (%)
Marital status - Widowed (%)
Marital status - Divorced (%)
Ancestries Reported - Arab (%)
Ancestries Reported - Czech (%)
Ancestries Reported - Danish (%)
Ancestries Reported - Dutch (%)
Ancestries Reported - English (%)
Ancestries Reported - French (%)
Ancestries Reported - French Canadian (%)
Ancestries Reported - German (%)
Ancestries Reported - Greek (%)
Ancestries Reported - Hungarian (%)
Ancestries Reported - Irish (%)
Ancestries Reported - Italian (%)
Ancestries Reported - Lithuanian (%)
Ancestries Reported - Norwegian (%)
Ancestries Reported - Polish (%)
Ancestries Reported - Portuguese (%)
Ancestries Reported - Russian (%)
Ancestries Reported - Scotch-Irish (%)
Ancestries Reported - Scottish (%)
Ancestries Reported - Slovak (%)
Ancestries Reported - Subsaharan African (%)
Ancestries Reported - Swedish (%)
Ancestries Reported - Swiss (%)
Ancestries Reported - Ukrainian (%)
Ancestries Reported - United States (%)
Ancestries Reported - Welsh (%)
Ancestries Reported - West Indian (%)
Ancestries Reported - Other (%)
Geographical mobility - Same house 1 year ago (%)
Geographical mobility - Same house 1 year ago (%) - White
Geographical mobility - Same house 1 year ago (%) - Black or African American
Geographical mobility - Same house 1 year ago (%) - Asian
Geographical mobility - Same house 1 year ago (%) - Hispanic or Latino
Geographical mobility - Same house 1 year ago (%) - American Indian and Alaska Native
Geographical mobility - Same house 1 year ago (%) - Multirace
Geographical mobility - Same house 1 year ago (%) - Other Race
Geographical mobility - Moved within same county (%)
Geographical mobility - Moved within same county (%) - White
Geographical mobility - Moved within same county (%) - Black or African American
Geographical mobility - Moved within same county (%) - Asian
Geographical mobility - Moved within same county (%) - Hispanic or Latino
Geographical mobility - Moved within same county (%) - American Indian and Alaska Native
Geographical mobility - Moved within same county (%) - Multirace
Geographical mobility - Moved within same county (%) - Other Race
Geographical mobility - Moved from different county within same state (%)
Geographical mobility - Moved from different county within same state (%) - White
Geographical mobility - Moved from different county within same state (%) - Black or African American
Geographical mobility - Moved from different county within same state (%) - Asian
Geographical mobility - Moved from different county within same state (%) - Hispanic or Latino
Geographical mobility - Moved from different county within same state (%) - American Indian and Alaska Native
Geographical mobility - Moved from different county within same state (%) - Multirace
Geographical mobility - Moved from different county within same state (%) - Other Race
Geographical mobility - Moved from different state (%)
Geographical mobility - Moved from different state (%) - White
Geographical mobility - Moved from different state (%) - Black or African American
Geographical mobility - Moved from different state (%) - Asian
Geographical mobility - Moved from different state (%) - Hispanic or Latino
Geographical mobility - Moved from different state (%) - American Indian and Alaska Native
Geographical mobility - Moved from different state (%) - Multirace
Geographical mobility - Moved from different state (%) - Other Race
Geographical mobility - Moved from abroad (%)
Geographical mobility - Moved from abroad (%) - White
Geographical mobility - Moved from abroad (%) - Black or African American
Geographical mobility - Moved from abroad (%) - Asian
Geographical mobility - Moved from abroad (%) - Hispanic or Latino
Geographical mobility - Moved from abroad (%) - American Indian and Alaska Native
Geographical mobility - Moved from abroad (%) - Multirace
Geographical mobility - Moved from abroad (%) - Other Race
Place of birth for the foreign-born population - Ireland (%)
Place of birth for the foreign-born population - Denmark (%)
Place of birth for the foreign-born population - Norway (%)
Place of birth for the foreign-born population - Sweden (%)
Place of birth for the foreign-born population - United Kingdom (%)
Place of birth for the foreign-born population - England (%)
Place of birth for the foreign-born population - Scotland (%)
Place of birth for the foreign-born population - Other Northern Europe (%)
Place of birth for the foreign-born population - Austria (%)
Place of birth for the foreign-born population - Belgium (%)
Place of birth for the foreign-born population - France (%)
Place of birth for the foreign-born population - Germany (%)
Place of birth for the foreign-born population - Netherlands (%)
Place of birth for the foreign-born population - Switzerland (%)
Place of birth for the foreign-born population - Other Western Europe (%)
Place of birth for the foreign-born population - Greece (%)
Place of birth for the foreign-born population - Italy (%)
Place of birth for the foreign-born population - Portugal (%)
Place of birth for the foreign-born population - Spain (%)
Place of birth for the foreign-born population - Other Southern Europe (%)
Place of birth for the foreign-born population - Albania (%)
Place of birth for the foreign-born population - Belarus (%)
Place of birth for the foreign-born population - Bosnia and Herzegovina (%)
Place of birth for the foreign-born population - Bulgaria (%)
Place of birth for the foreign-born population - Croatia (%)
Place of birth for the foreign-born population - Czechoslovakia (%)
Place of birth for the foreign-born population - Hungary (%)
Place of birth for the foreign-born population - Latvia (%)
Place of birth for the foreign-born population - Lithuania (%)
Place of birth for the foreign-born population - North Macedonia (Macedonia) (%)
Place of birth for the foreign-born population - Moldova (%)
Place of birth for the foreign-born population - Poland (%)
Place of birth for the foreign-born population - Romania (%)
Place of birth for the foreign-born population - Russia (%)
Place of birth for the foreign-born population - Serbia (%)
Place of birth for the foreign-born population - Ukraine (%)
Place of birth for the foreign-born population - Other Eastern Europe (%)
Place of birth for the foreign-born population - China (%)
Place of birth for the foreign-born population - Hong Kong (%)
Place of birth for the foreign-born population - Taiwan (%)
Place of birth for the foreign-born population - Japan (%)
Place of birth for the foreign-born population - Korea (%)
Place of birth for the foreign-born population - Other Eastern Asia (%)
Place of birth for the foreign-born population - Afghanistan (%)
Place of birth for the foreign-born population - Bangladesh (%)
Place of birth for the foreign-born population - India (%)
Place of birth for the foreign-born population - Iran (%)
Place of birth for the foreign-born population - Kazakhstan (%)
Place of birth for the foreign-born population - Nepal (%)
Place of birth for the foreign-born population - Pakistan (%)
Place of birth for the foreign-born population - Sri Lanka (%)
Place of birth for the foreign-born population - Uzbekistan (%)
Place of birth for the foreign-born population - Other South Central Asia (%)
Place of birth for the foreign-born population - Burma (%)
Place of birth for the foreign-born population - Cambodia (%)
Place of birth for the foreign-born population - Indonesia (%)
Place of birth for the foreign-born population - Laos (%)
Place of birth for the foreign-born population - Malaysia (%)
Place of birth for the foreign-born population - Philippines (%)
Place of birth for the foreign-born population - Singapore (%)
Place of birth for the foreign-born population - Thailand (%)
Place of birth for the foreign-born population - Vietnam (%)
Place of birth for the foreign-born population - Other South Eastern Asia (%)
Place of birth for the foreign-born population - Armenia (%)
Place of birth for the foreign-born population - Iraq (%)
Place of birth for the foreign-born population - Israel (%)
Place of birth for the foreign-born population - Jordan (%)
Place of birth for the foreign-born population - Kuwait (%)
Place of birth for the foreign-born population - Lebanon (%)
Place of birth for the foreign-born population - Saudi Arabia (%)
Place of birth for the foreign-born population - Syria (%)
Place of birth for the foreign-born population - Turkey (%)
Place of birth for the foreign-born population - Yemen (%)
Place of birth for the foreign-born population - Other Western Asia (%)
Place of birth for the foreign-born population - Eritrea (%)
Place of birth for the foreign-born population - Ethiopia (%)
Place of birth for the foreign-born population - Kenya (%)
Place of birth for the foreign-born population - Somalia (%)
Place of birth for the foreign-born population - Uganda (%)
Place of birth for the foreign-born population - Zimbabwe (%)
Place of birth for the foreign-born population - Other Eastern Africa (%)
Place of birth for the foreign-born population - Cameroon (%)
Place of birth for the foreign-born population - Congo (%)
Place of birth for the foreign-born population - Democratic Republic of Congo (Zaire) (%)
Place of birth for the foreign-born population - Other Middle Africa (%)
Place of birth for the foreign-born population - Egypt (%)
Place of birth for the foreign-born population - Morocco (%)
Place of birth for the foreign-born population - Sudan (%)
Place of birth for the foreign-born population - Other Northern Africa (%)
Place of birth for the foreign-born population - South Africa (%)
Place of birth for the foreign-born population - Other Southern Africa (%)
Place of birth for the foreign-born population - Cabo Verde (%)
Place of birth for the foreign-born population - Ghana (%)
Place of birth for the foreign-born population - Liberia (%)
Place of birth for the foreign-born population - Nigeria (%)
Place of birth for the foreign-born population - Senegal (%)
Place of birth for the foreign-born population - Sierra Leone (%)
Place of birth for the foreign-born population - Other Western Africa (%)
Place of birth for the foreign-born population - Australia (%)
Place of birth for the foreign-born population - New Zealand (%)
Place of birth for the foreign-born population - Fiji (%)
Place of birth for the foreign-born population - Micronesia (%)
Place of birth for the foreign-born population - Bahamas (%)
Place of birth for the foreign-born population - Barbados (%)
Place of birth for the foreign-born population - Cuba (%)
Place of birth for the foreign-born population - Dominica (%)
Place of birth for the foreign-born population - Dominican Republic (%)
Place of birth for the foreign-born population - Grenada (%)
Place of birth for the foreign-born population - Haiti (%)
Place of birth for the foreign-born population - Jamaica (%)
Place of birth for the foreign-born population - St. Vincent and the Grenadines (%)
Place of birth for the foreign-born population - Trinidad and Tobago (%)
Place of birth for the foreign-born population - West Indies (%)
Place of birth for the foreign-born population - Other Caribbean (%)
Place of birth for the foreign-born population - Belize (%)
Place of birth for the foreign-born population - Costa Rica (%)
Place of birth for the foreign-born population - El Salvador (%)
Place of birth for the foreign-born population - Guatemala (%)
Place of birth for the foreign-born population - Honduras (%)
Place of birth for the foreign-born population - Mexico (%)
Place of birth for the foreign-born population - Nicaragua (%)
Place of birth for the foreign-born population - Panama (%)
Place of birth for the foreign-born population - Other Central America (%)
Place of birth for the foreign-born population - Argentina (%)
Place of birth for the foreign-born population - Bolivia (%)
Place of birth for the foreign-born population - Brazil (%)
Place of birth for the foreign-born population - Chile (%)
Place of birth for the foreign-born population - Colombia (%)
Place of birth for the foreign-born population - Ecuador (%)
Place of birth for the foreign-born population - Guyana (%)
Place of birth for the foreign-born population - Peru (%)
Place of birth for the foreign-born population - Uruguay (%)
Place of birth for the foreign-born population - Venezuela (%)
Place of birth for the foreign-born population - Other South America (%)
Place of birth for the foreign-born population - Canada (%)
Place of birth for the foreign-born population - Other Northern America (%)
Place of birth for the foreign-born population - Other (%)
Latest news about races in Fargo, ND collected exclusively by city-data.com from local newspapers, TV, and radio stations
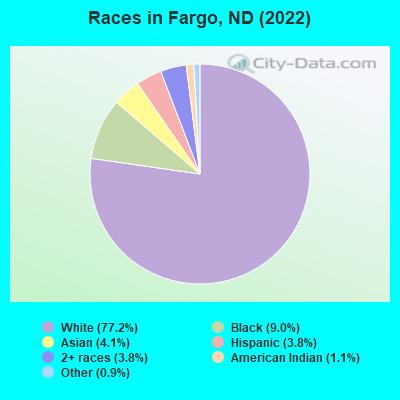
According to 2022 data, the most numerous races in Fargo, ND are White alone (103,415 residents), Hispanic (5,037 residents), and American Indian alone (1,497 residents). 88.9% of Fargo residents speak English at home. 10.2% of Fargo, ND residents are foreign-born (5.4% born in Africa, 3.5% born in Asia), which is 60.6% greater than the foreign-born rate of 4.0% across the entire state of North Dakota.
Race distribution in Fargo
2000 2022
84,660 93.4% White alone 1,475 1.6% Asian alone 1,167 1.3% Hispanic 1,190 1.3% Two or more races 1,077 1.2% American Indian alone 908 1.0% Black alone 83 0.09% Other race alone 39 0.04% Native Hawaiian and Other
103,415 77.2% White alone 12,080 9.0% Black alone 5,547 4.1% Asian alone 5,037 3.8% Hispanic 5,034 3.8% Two or more races 1,497 1.1% American Indian alone 1,241 0.9% Other race alone 28 0.02% Native Hawaiian and Other
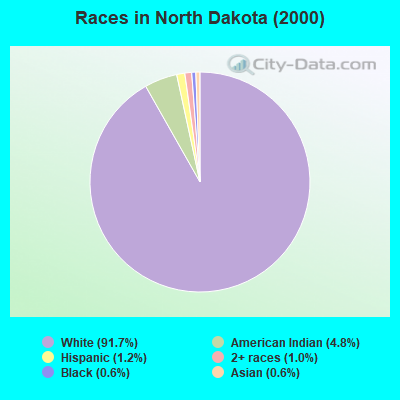
2000 2022
589,149 91.7% White alone 30,772 4.8% American Indian alone 7,786 1.2% Hispanic 6,666 1.0% Two or more races 3,761 0.6% Black alone 3,566 0.6% Asian alone 282 0.04% Other race alone 218 0.03% Native Hawaiian and Other
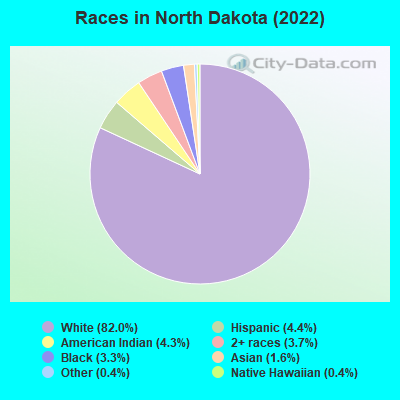
639,297 82.0% White alone 34,233 4.4% Hispanic 33,252 4.3% American Indian alone 28,831 3.7% Two or more races 25,426 3.3% Black alone 12,271 1.6% Asian alone 3,206 0.4% Other race alone 2,745 0.4% Native Hawaiian and Other
Income and house value in Fargo Median household income in 2022 $63,129 White non-Hispanic householders$40,568 Black householders$49,041 American Indian and Alaska Native householders$53,277 Asian householders$61,307 Some other race householders$56,407 Two or more races householders$57,900 Hispanic or Latino race householdersMedian 2022 house value $270,908 White Non-Hispanic householders$226,851 Black or African American householders$224,936 American Indian or Alaska Native householders $330,563 Asian householders$232,598 Some other race householders$201,950 Two or more races householders$173,764 Hispanic or Latino householders
Median age by race in Fargo
34.0 Median age for White residents33.7 35.1 27.5 Median age for Black or African American residents27.5 29.1 23.0 Median age for American Indian / Alaska Native residents28.1 21.5 27.5 Median age for Asian residents28.7 27.1 -666,666,666.0 Median age for Native Hawaiian / Pacific Islander residents-666,666,666.0 -666,666,666.0 24.3 Median age for Other race residents26.7 30.0 23.4 Median age for Two or more races residents23.7 23.2 34.1 Median age for White alone residents33.6 35.3 22.0 Median age for Hispanic or Latino residents22.4 21.7
Owner/renter occupied households by race in Fargo
House owners and renters - White residents 23,810 49.4% Owner occupied24,428 50.6% Renter occupiedHouse owners and renters - Black or African American residents 581 12.2% Owner occupied4,175 87.8% Renter occupiedHouse owners and renters - American Indian / Alaska Native residents 226 31.7% Owner occupied486 68.3% Renter occupiedHouse owners and renters - Asian residents 394 24.9% Owner occupied1,187 75.1% Renter occupiedHouse owners and renters - Other race residents 38 10.6% Owner occupied320 89.4% Renter occupiedHouse owners and renters - Two or more races residents 566 19.8% Owner occupied2,297 80.2% Renter occupiedHouse owners and renters - White alone residents 23,384 49.3% Owner occupied24,066 50.7% Renter occupiedHouse owners and renters - Hispanic or Latino residents 597 26.9% Owner occupied1,619 73.1% Renter occupied
Language usage in Fargo
English speakers - Total 88.9% of residents of Fargo speak English at home.
1.8% of residents speak Spanish at home 1,765 76.5% Speak English very well541 23.5% Speak English less than very well9.3% of residents speak other language at home 6,583 56.3% Speak English very well5,104 43.7% Speak English less than very well
English speakers - Born in the United States 95.4% of residents of Fargo speak English at home.
2.0% of residents speak Spanish at home 802 82.3% Speak English very well173 17.7% Speak English less than very well2.6% of residents speak other language at home 855 65.6% Speak English very well449 34.4% Speak English less than very well
English speakers - Native, born elsewhere 58.5% of residents of Fargo speak English at home.
41.5% of residents speak Spanish at home 358 54.7% Speak English very well297 45.3% Speak English less than very well
English speakers - Foreign-born 33.8% of residents of Fargo speak English at home.
0.9% of residents speak Spanish at home 115 93.5% Speak English very well8 6.5% Speak English less than very well65.4% of residents speak other language at home 4,677 50.1% Speak English very well4,655 49.9% Speak English less than very well
White (Caucasian) - Speak only English Native:
98.0% (96,538)Foreign-born:
42.5% (903)
White (Caucasian) - Speak another language Native:
2.0% (1,982)Foreign-born:
57.5% (1,223)
Black or African American - Speak only English Native:
91.2% (3,511)Foreign-born:
41.6% (2,680)
Black or African American - Speak another language Native:
8.8% (338)Foreign-born:
58.4% (3,758)
American Indian / Alaska Native - Speak only English Native:
81.8% (1,101)Foreign-born:
81.2% (19)
Asian - Speak only English Native:
39.6% (232)Foreign-born:
11.9% (512)
Asian - Speak another language Native:
60.4% (354)Foreign-born:
88.1% (3,773)
Other race - Speak only English Native:
45.7% (463)Foreign-born:
21.3% (68)
Other race - Speak another language Native:
55.2% (558)Foreign-born:
79.5% (254)
Two or more races - Speak only English Native:
83.4% (4,017)Foreign-born:
65.5% (219)
Two or more races - Speak another language Native:
17.8% (858)Foreign-born:
42.4% (142)
White alone - Speak only English Native:
98.5% (96,049)Foreign-born:
44.2% (903)
White alone - Speak another language Native:
1.5% (1,506)Foreign-born:
55.8% (1,139)
Hispanic or Latino - Speak only English Native:
53.3% (1,962)Foreign-born:
54.3% (146)
Hispanic or Latino - Speak another language Native:
46.7% (1,719)Foreign-born:
45.7% (123)
Foreign-born residents in Fargo 13,386 residents are foreign born (5.4% Africa , 3.5% Asia ).
This city:
10.2%North Dakota:
4.6%
Marital status for residents in Fargo Marital status - White (Caucasian) population 15 years and over
Males 47.4% Never married41.1% Now married0.4% Separated1.6% Widowed9.4% DivorcedFemales 41.0% Never married39.6% Now married0.6% Separated6.6% Widowed12.2% DivorcedWomen who gave birth in the past 12 months Now married:
80.3% (762)Unmarried:
19.7% (187)
Women who did not give birth in the past 12 months Now married:
28.8% (7,526)Unmarried:
71.2% (18,577)
Marital status - Black or African American population 15 years and over
Males 52.8% Never married30.6% Now married4.2% Separated0.0% Widowed12.3% DivorcedFemales 50.4% Never married30.2% Now married6.6% Separated4.1% Widowed8.7% DivorcedWomen who gave birth in the past 12 months Now married:
49.4% (160)Unmarried:
50.6% (164)
Women who did not give birth in the past 12 months Now married:
34.3% (987)Unmarried:
65.7% (1,893)
Marital status - American Indian / Alaska Native population 15 years and over
Males 47.9% Never married34.3% Now married7.6% Separated0.0% Widowed10.2% DivorcedFemales 67.4% Never married23.6% Now married2.8% Separated1.5% Widowed4.7% DivorcedWomen who gave birth in the past 12 months Now married:
25.6% (10)Unmarried:
74.4% (30)
Women who did not give birth in the past 12 months Now married:
23.0% (97)Unmarried:
77.0% (325)
Marital status - Asian population 15 years and over
Males 43.9% Never married52.8% Now married0.2% Separated0.1% Widowed3.0% DivorcedFemales 32.5% Never married60.5% Now married0.0% Separated4.6% Widowed2.4% DivorcedWomen who gave birth in the past 12 months Now married:
100.0% (218)Unmarried:
0.0% (0)
Women who did not give birth in the past 12 months Now married:
57.0% (914)Unmarried:
43.0% (690)
Marital status - Other race population 15 years and over
Males 42.8% Never married49.1% Now married0.0% Separated0.0% Widowed8.1% DivorcedFemales 20.9% Never married60.1% Now married0.0% Separated0.0% Widowed19.0% DivorcedWomen who gave birth in the past 12 months Now married:
100.0% (29)Unmarried:
0.0% (0)
Women who did not give birth in the past 12 months Now married:
58.7% (166)Unmarried:
41.3% (117)
Marital status - Two or more races population 15 years and over
Males 72.3% Never married20.2% Now married0.0% Separated0.9% Widowed6.6% DivorcedFemales 51.8% Never married36.3% Now married2.7% Separated0.6% Widowed8.6% DivorcedWomen who gave birth in the past 12 months Now married:
70.7% (93)Unmarried:
29.3% (39)
Women who did not give birth in the past 12 months Now married:
26.5% (363)Unmarried:
73.5% (1,004)
Marital status - White alone, not Hispanic / Latino population 15 years and over
Males 47.9% Never married40.5% Now married0.4% Separated1.7% Widowed9.5% DivorcedFemales 40.6% Never married39.9% Now married0.6% Separated6.7% Widowed12.3% DivorcedWomen who gave birth in the past 12 months Now married:
88.2% (762)Unmarried:
11.8% (102)
Women who did not give birth in the past 12 months Now married:
29.1% (7,526)Unmarried:
70.9% (18,380)
Marital status - Hispanic or Latino population 15 years and over
Males 61.2% Never married33.6% Now married0.0% Separated0.9% Widowed4.3% DivorcedFemales 42.3% Never married48.0% Now married3.5% Separated0.0% Widowed6.2% DivorcedWomen who gave birth in the past 12 months Now married:
92.0% (110)Unmarried:
8.0% (10)
Women who did not give birth in the past 12 months Now married:
43.8% (448)Unmarried:
56.2% (576)
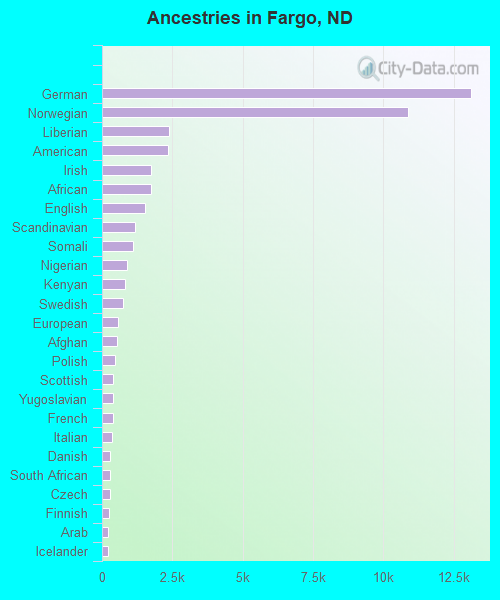
Ancestries in Fargo
13,099 23.5% German10,881 19.5% Norwegian2,370 4.2% Liberian2,349 4.2% American1,758 3.2% Irish1,756 3.1% African1,537 2.8% English1,168 2.1% Scandinavian1,099 2.0% Somali876 1.6% Nigerian832 1.5% Kenyan763 1.4% Swedish552 1.0% European518 0.9% Afghan456 0.8% Polish382 0.7% Scottish377 0.7% Yugoslavian375 0.7% French372 0.7% Italian295 0.5% Danish290 0.5% South African274 0.5% Czech261 0.5% Finnish222 0.4% Arab209 0.4% Icelander201 0.4% Scotch-Irish182 0.3% Northern European161 0.3% French Canadian156 0.3% Ukrainian151 0.3% Egyptian150 0.3% German Russian121 0.2% Czechoslovakian111 0.2% British110 0.2% Austrian110 0.2% Jamaican108 0.2% Dutch108 0.2% Ghanaian95 0.2% Eastern European90 0.2% Slovak87 0.2% Swiss84 0.2% Romanian80 0.1% Haitian54 0.10% Albanian53 0.10% Bulgarian48 0.09% Canadian37 0.07% Iranian35 0.06% Welsh34 0.06% Brazilian20 0.04% Slovene17 0.03% Greek17 0.03% Sudanese16 0.03% Moroccan15 0.03% Australian14 0.03% Pennsylvania German13 0.02% Croatian13 0.02% Russian9 0.02% Estonian6 0.01% Hungarian3 0.01% Slavic
Geographical mobility in Fargo Same house 1 year ago 82,034 78.9% White (Caucasian)8,433 71.0% Black or African American1,144 81.6% American Indian / Alaska Native3,460 70.0% Asian640 46.0% Other race4,785 71.3% Two or more races81,069 78.8% White alone, not Hispanic / Latino3,563 73.2% Hispanic or LatinoMoved within same county 13,733 13.2% White / Caucasian2,678 22.5% Black or African American129 9.2% American Indian / Alaska Native594 12.0% Asian111 8.0% Other race916 13.7% Two or more races13,710 13.3% White alone, not Hispanic / Latino431 8.9% Hispanic or LatinoMoved within same state 2,053 2.0% White / Caucasian48 0.4% Black or African American6 0.5% American Indian / Alaska Native103 2.1% Asian4 100.0% Native Hawaiian / Pacific Islander66 4.7% Other race405 6.0% Two or more races1,992 1.9% White alone, not Hispanic / Latino404 8.3% Hispanic or LatinoMoved from different state 6,098 5.9% White / Caucasian664 5.6% Black or African American69 4.9% American Indian / Alaska Native197 4.0% Asian351 25.2% Other race604 9.0% Two or more races6,098 5.9% White alone, not Hispanic / Latino470 9.7% Hispanic or LatinoMoved from abroad 25 0.0% White61 0.5% Black or African American308 6.2% Asian54 3.9% Other race25 0.0% White alone, not Hispanic / Latino
Children Nativity (place of birth) in Fargo
Children under 6 years - Living with two parents Both parents native 4,485 100.0% NativeBoth parents foreign-born 1,553 100.0% NativeOne native, one foreign-born parent 507 100.0% NativeChildren under 6 years - Living with one parent Native parent 1,559 100.0% NativeForeign-born parent 1,305 94.3% Native79 5.7% Foreign-bornChildren 6 to 17 years - Living with two parents Both parents native 9,063 100.0% NativeBoth parents foreign-born 687 48.5% Native729 51.5% Foreign-bornOne native, one foreign-born parent 332 100.0% NativeChildren 6 to 17 years - Living with one parent Native parent 3,226 100.0% NativeForeign-born parent 2,496 61.3% Native1,576 38.7% Foreign-born
Grandparents responsible for own grandchildren in Fargo
Grandparents (30 to 59 years) White / Caucasian 53 53.4% Responsible for grandchildren46 46.6% Not responsible for grandchildrenBlack or African American 3 44.2% Responsible for grandchildren3 55.8% Not responsible for grandchildrenAmerican Indian / Alaska Native 11 100.0% Not responsible for grandchildrenAsian 32 100.0% Not responsible for grandchildrenWhite alone, not Hispanic / Latino 53 49.2% Responsible for grandchildren55 50.8% Not responsible for grandchildrenGrandparents (60 years and over) White / Caucasian 115 30.0% Responsible for grandchildren268 70.0% Not responsible for grandchildrenBlack or African American 25 100.0% Responsible for grandchildrenAsian 5 100.0% Not responsible for grandchildrenWhite alone, not Hispanic / Latino 116 29.7% Responsible for grandchildren274 70.3% Not responsible for grandchildren