Races in Fairland, Maryland (MD) Detailed Stats
Data:
Races - White alone (%)
Races - White alone (% change since 2000)
Races - Black alone (%)
Races - Black alone (% change since 2000)
Races - American Indian alone (%)
Races - American Indian alone (% change since 2000)
Races - Asian alone (%)
Races - Asian alone (% change since 2000)
Races - Hispanic (%)
Races - Hispanic (% change since 2000)
Races - Native Hawaiian and Other Pacific Islander alone (%)
Races - Native Hawaiian and Other Pacific Islander alone (% change since 2000)
Races - Two or more races(%)
Races - Two or more races(% change since 2000)
Races - Other race alone (%)
Races - Other race alone (% change since 2000)
Racial diversity
Place of birth - Born in state of residence (%)
Place of birth - Born in state of residence (%) - White
Place of birth - Born in state of residence (%) - Black or African American
Place of birth - Born in state of residence (%) - Asian
Place of birth - Born in state of residence (%) - Hispanic or Latino
Place of birth - Born in state of residence (%) - American Indian and Alaska Native
Place of birth - Born in state of residence (%) - Multirace
Place of birth - Born in state of residence (%) - Other Race
Place of birth - Born in other state (%)
Place of birth - Born in other state (%) - White
Place of birth - Born in other state (%) - Black or African American
Place of birth - Born in other state (%) - Asian
Place of birth - Born in other state (%) - Hispanic or Latino
Place of birth - Born in other state (%) - American Indian and Alaska Native
Place of birth - Born in other state (%) - Multirace
Place of birth - Born in other state (%) - Other Race
Place of birth - Native, outside of US (%)
Place of birth - Native, outside of US (%) - White
Place of birth - Native, outside of US (%) - Black or African American
Place of birth - Native, outside of US (%) - Asian
Place of birth - Native, outside of US (%) - Hispanic or Latino
Place of birth - Native, outside of US (%) - American Indian and Alaska Native
Place of birth - Native, outside of US (%) - Multirace
Place of birth - Native, outside of US (%) - Other Race
Place of birth - Foreign born (%)
Place of birth - Foreign born (%) - White
Place of birth - Foreign born (%) - Black or African American
Place of birth - Foreign born (%) - Asian
Place of birth - Foreign born (%) - Hispanic or Latino
Place of birth - Foreign born (%) - American Indian and Alaska Native
Place of birth - Foreign born (%) - Multirace
Place of birth - Foreign born (%) - Other Race
Residents speaking English at home (%)
Residents speaking English at home - Born in the United States (%)
Residents speaking English at home - Native, born elsewhere (%)
Residents speaking English at home - Foreign born (%)
Residents speaking Spanish at home (%)
Residents speaking Spanish at home - Born in the United States (%)
Residents speaking Spanish at home - Native, born elsewhere (%)
Residents speaking Spanish at home - Foreign born (%)
Residents speaking other language at home (%)
Residents speaking other language at home - Born in the United States (%)
Residents speaking other language at home - Native, born elsewhere (%)
Residents speaking other language at home - Foreign born (%)
Marital status - Never married (%)
Marital status - Now married (%)
Marital status - Separated (%)
Marital status - Widowed (%)
Marital status - Divorced (%)
Ancestries Reported - Arab (%)
Ancestries Reported - Czech (%)
Ancestries Reported - Danish (%)
Ancestries Reported - Dutch (%)
Ancestries Reported - English (%)
Ancestries Reported - French (%)
Ancestries Reported - French Canadian (%)
Ancestries Reported - German (%)
Ancestries Reported - Greek (%)
Ancestries Reported - Hungarian (%)
Ancestries Reported - Irish (%)
Ancestries Reported - Italian (%)
Ancestries Reported - Lithuanian (%)
Ancestries Reported - Norwegian (%)
Ancestries Reported - Polish (%)
Ancestries Reported - Portuguese (%)
Ancestries Reported - Russian (%)
Ancestries Reported - Scotch-Irish (%)
Ancestries Reported - Scottish (%)
Ancestries Reported - Slovak (%)
Ancestries Reported - Subsaharan African (%)
Ancestries Reported - Swedish (%)
Ancestries Reported - Swiss (%)
Ancestries Reported - Ukrainian (%)
Ancestries Reported - United States (%)
Ancestries Reported - Welsh (%)
Ancestries Reported - West Indian (%)
Ancestries Reported - Other (%)
Geographical mobility - Same house 1 year ago (%)
Geographical mobility - Same house 1 year ago (%) - White
Geographical mobility - Same house 1 year ago (%) - Black or African American
Geographical mobility - Same house 1 year ago (%) - Asian
Geographical mobility - Same house 1 year ago (%) - Hispanic or Latino
Geographical mobility - Same house 1 year ago (%) - American Indian and Alaska Native
Geographical mobility - Same house 1 year ago (%) - Multirace
Geographical mobility - Same house 1 year ago (%) - Other Race
Geographical mobility - Moved within same county (%)
Geographical mobility - Moved within same county (%) - White
Geographical mobility - Moved within same county (%) - Black or African American
Geographical mobility - Moved within same county (%) - Asian
Geographical mobility - Moved within same county (%) - Hispanic or Latino
Geographical mobility - Moved within same county (%) - American Indian and Alaska Native
Geographical mobility - Moved within same county (%) - Multirace
Geographical mobility - Moved within same county (%) - Other Race
Geographical mobility - Moved from different county within same state (%)
Geographical mobility - Moved from different county within same state (%) - White
Geographical mobility - Moved from different county within same state (%) - Black or African American
Geographical mobility - Moved from different county within same state (%) - Asian
Geographical mobility - Moved from different county within same state (%) - Hispanic or Latino
Geographical mobility - Moved from different county within same state (%) - American Indian and Alaska Native
Geographical mobility - Moved from different county within same state (%) - Multirace
Geographical mobility - Moved from different county within same state (%) - Other Race
Geographical mobility - Moved from different state (%)
Geographical mobility - Moved from different state (%) - White
Geographical mobility - Moved from different state (%) - Black or African American
Geographical mobility - Moved from different state (%) - Asian
Geographical mobility - Moved from different state (%) - Hispanic or Latino
Geographical mobility - Moved from different state (%) - American Indian and Alaska Native
Geographical mobility - Moved from different state (%) - Multirace
Geographical mobility - Moved from different state (%) - Other Race
Geographical mobility - Moved from abroad (%)
Geographical mobility - Moved from abroad (%) - White
Geographical mobility - Moved from abroad (%) - Black or African American
Geographical mobility - Moved from abroad (%) - Asian
Geographical mobility - Moved from abroad (%) - Hispanic or Latino
Geographical mobility - Moved from abroad (%) - American Indian and Alaska Native
Geographical mobility - Moved from abroad (%) - Multirace
Geographical mobility - Moved from abroad (%) - Other Race
Place of birth for the foreign-born population - Ireland (%)
Place of birth for the foreign-born population - Denmark (%)
Place of birth for the foreign-born population - Norway (%)
Place of birth for the foreign-born population - Sweden (%)
Place of birth for the foreign-born population - United Kingdom (%)
Place of birth for the foreign-born population - England (%)
Place of birth for the foreign-born population - Scotland (%)
Place of birth for the foreign-born population - Other Northern Europe (%)
Place of birth for the foreign-born population - Austria (%)
Place of birth for the foreign-born population - Belgium (%)
Place of birth for the foreign-born population - France (%)
Place of birth for the foreign-born population - Germany (%)
Place of birth for the foreign-born population - Netherlands (%)
Place of birth for the foreign-born population - Switzerland (%)
Place of birth for the foreign-born population - Other Western Europe (%)
Place of birth for the foreign-born population - Greece (%)
Place of birth for the foreign-born population - Italy (%)
Place of birth for the foreign-born population - Portugal (%)
Place of birth for the foreign-born population - Spain (%)
Place of birth for the foreign-born population - Other Southern Europe (%)
Place of birth for the foreign-born population - Albania (%)
Place of birth for the foreign-born population - Belarus (%)
Place of birth for the foreign-born population - Bosnia and Herzegovina (%)
Place of birth for the foreign-born population - Bulgaria (%)
Place of birth for the foreign-born population - Croatia (%)
Place of birth for the foreign-born population - Czechoslovakia (%)
Place of birth for the foreign-born population - Hungary (%)
Place of birth for the foreign-born population - Latvia (%)
Place of birth for the foreign-born population - Lithuania (%)
Place of birth for the foreign-born population - North Macedonia (Macedonia) (%)
Place of birth for the foreign-born population - Moldova (%)
Place of birth for the foreign-born population - Poland (%)
Place of birth for the foreign-born population - Romania (%)
Place of birth for the foreign-born population - Russia (%)
Place of birth for the foreign-born population - Serbia (%)
Place of birth for the foreign-born population - Ukraine (%)
Place of birth for the foreign-born population - Other Eastern Europe (%)
Place of birth for the foreign-born population - China (%)
Place of birth for the foreign-born population - Hong Kong (%)
Place of birth for the foreign-born population - Taiwan (%)
Place of birth for the foreign-born population - Japan (%)
Place of birth for the foreign-born population - Korea (%)
Place of birth for the foreign-born population - Other Eastern Asia (%)
Place of birth for the foreign-born population - Afghanistan (%)
Place of birth for the foreign-born population - Bangladesh (%)
Place of birth for the foreign-born population - India (%)
Place of birth for the foreign-born population - Iran (%)
Place of birth for the foreign-born population - Kazakhstan (%)
Place of birth for the foreign-born population - Nepal (%)
Place of birth for the foreign-born population - Pakistan (%)
Place of birth for the foreign-born population - Sri Lanka (%)
Place of birth for the foreign-born population - Uzbekistan (%)
Place of birth for the foreign-born population - Other South Central Asia (%)
Place of birth for the foreign-born population - Burma (%)
Place of birth for the foreign-born population - Cambodia (%)
Place of birth for the foreign-born population - Indonesia (%)
Place of birth for the foreign-born population - Laos (%)
Place of birth for the foreign-born population - Malaysia (%)
Place of birth for the foreign-born population - Philippines (%)
Place of birth for the foreign-born population - Singapore (%)
Place of birth for the foreign-born population - Thailand (%)
Place of birth for the foreign-born population - Vietnam (%)
Place of birth for the foreign-born population - Other South Eastern Asia (%)
Place of birth for the foreign-born population - Armenia (%)
Place of birth for the foreign-born population - Iraq (%)
Place of birth for the foreign-born population - Israel (%)
Place of birth for the foreign-born population - Jordan (%)
Place of birth for the foreign-born population - Kuwait (%)
Place of birth for the foreign-born population - Lebanon (%)
Place of birth for the foreign-born population - Saudi Arabia (%)
Place of birth for the foreign-born population - Syria (%)
Place of birth for the foreign-born population - Turkey (%)
Place of birth for the foreign-born population - Yemen (%)
Place of birth for the foreign-born population - Other Western Asia (%)
Place of birth for the foreign-born population - Eritrea (%)
Place of birth for the foreign-born population - Ethiopia (%)
Place of birth for the foreign-born population - Kenya (%)
Place of birth for the foreign-born population - Somalia (%)
Place of birth for the foreign-born population - Uganda (%)
Place of birth for the foreign-born population - Zimbabwe (%)
Place of birth for the foreign-born population - Other Eastern Africa (%)
Place of birth for the foreign-born population - Cameroon (%)
Place of birth for the foreign-born population - Congo (%)
Place of birth for the foreign-born population - Democratic Republic of Congo (Zaire) (%)
Place of birth for the foreign-born population - Other Middle Africa (%)
Place of birth for the foreign-born population - Egypt (%)
Place of birth for the foreign-born population - Morocco (%)
Place of birth for the foreign-born population - Sudan (%)
Place of birth for the foreign-born population - Other Northern Africa (%)
Place of birth for the foreign-born population - South Africa (%)
Place of birth for the foreign-born population - Other Southern Africa (%)
Place of birth for the foreign-born population - Cabo Verde (%)
Place of birth for the foreign-born population - Ghana (%)
Place of birth for the foreign-born population - Liberia (%)
Place of birth for the foreign-born population - Nigeria (%)
Place of birth for the foreign-born population - Senegal (%)
Place of birth for the foreign-born population - Sierra Leone (%)
Place of birth for the foreign-born population - Other Western Africa (%)
Place of birth for the foreign-born population - Australia (%)
Place of birth for the foreign-born population - New Zealand (%)
Place of birth for the foreign-born population - Fiji (%)
Place of birth for the foreign-born population - Micronesia (%)
Place of birth for the foreign-born population - Bahamas (%)
Place of birth for the foreign-born population - Barbados (%)
Place of birth for the foreign-born population - Cuba (%)
Place of birth for the foreign-born population - Dominica (%)
Place of birth for the foreign-born population - Dominican Republic (%)
Place of birth for the foreign-born population - Grenada (%)
Place of birth for the foreign-born population - Haiti (%)
Place of birth for the foreign-born population - Jamaica (%)
Place of birth for the foreign-born population - St. Vincent and the Grenadines (%)
Place of birth for the foreign-born population - Trinidad and Tobago (%)
Place of birth for the foreign-born population - West Indies (%)
Place of birth for the foreign-born population - Other Caribbean (%)
Place of birth for the foreign-born population - Belize (%)
Place of birth for the foreign-born population - Costa Rica (%)
Place of birth for the foreign-born population - El Salvador (%)
Place of birth for the foreign-born population - Guatemala (%)
Place of birth for the foreign-born population - Honduras (%)
Place of birth for the foreign-born population - Mexico (%)
Place of birth for the foreign-born population - Nicaragua (%)
Place of birth for the foreign-born population - Panama (%)
Place of birth for the foreign-born population - Other Central America (%)
Place of birth for the foreign-born population - Argentina (%)
Place of birth for the foreign-born population - Bolivia (%)
Place of birth for the foreign-born population - Brazil (%)
Place of birth for the foreign-born population - Chile (%)
Place of birth for the foreign-born population - Colombia (%)
Place of birth for the foreign-born population - Ecuador (%)
Place of birth for the foreign-born population - Guyana (%)
Place of birth for the foreign-born population - Peru (%)
Place of birth for the foreign-born population - Uruguay (%)
Place of birth for the foreign-born population - Venezuela (%)
Place of birth for the foreign-born population - Other South America (%)
Place of birth for the foreign-born population - Canada (%)
Place of birth for the foreign-born population - Other Northern America (%)
Place of birth for the foreign-born population - Other (%)
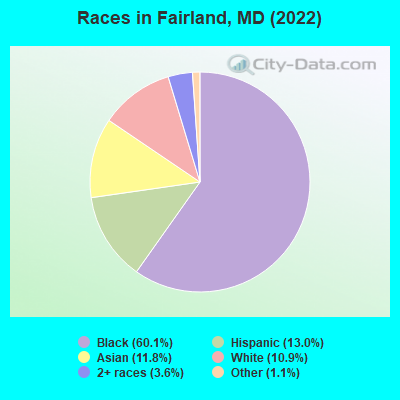
According to 2022 data, the most numerous races in Fairland, MD are White alone (2,829 residents), Black alone (15,547 residents), and Hispanic (3,377 residents). 58.5% of Fairland residents speak English at home. 37.0% of Fairland, MD residents are foreign-born (16.9% born in Africa, 9.2% born in Asia, 8.3% born in Latin America), which is 56.7% greater than the foreign-born rate of 16.0% across the entire state of Maryland.
Race distribution in Fairland
2000 2022
3,286,547 62.1% White alone 1,464,735 27.7% Black alone 227,916 4.3% Hispanic 209,738 4.0% Asian alone 82,946 1.6% Two or more races 13,312 0.3% American Indian alone 9,379 0.2% Other race alone 1,913 0.04% Native Hawaiian and Other
2,906,492 47.1% White alone 1,800,914 29.2% Black alone 705,842 11.4% Hispanic 401,818 6.5% Asian alone 291,317 4.7% Two or more races 46,930 0.8% Other race alone 8,930 0.1% American Indian alone 2,417 0.04% Native Hawaiian and Other
Income and house value in Fairland Median household income in 2022 $112,804 White non-Hispanic householders$74,818 Black householders$96,822 Asian householders$103,763 Some other race householders$71,354 Two or more races householders$87,861 Hispanic or Latino race householdersMedian 2022 house value $532,672 White Non-Hispanic householders$423,413 Black or African American householders$762,440 American Indian or Alaska Native householders $611,433 Asian householders$365,675 Some other race householders$393,804 Two or more races householders$401,798 Hispanic or Latino householders
Median age by race in Fairland
55.9 Median age for White residents54.9 56.2 35.2 Median age for Black or African American residents35.4 35.1 -610,526,315.2 Median age for American Indian / Alaska Native residents-555,555,555.0 -671,704,449.4 42.8 Median age for Asian residents41.8 42.7 -763,333,332.6 Median age for Native Hawaiian / Pacific Islander residents-720,061,021.4 -760,942,760.2 27.6 Median age for Other race residents31.4 24.5 40.8 Median age for Two or more races residents33.8 44.0 54.1 Median age for White alone residents50.7 57.9 33.0 Median age for Hispanic or Latino residents35.8 30.9
Owner/renter occupied households by race in Fairland
House owners and renters - White residents 1,148 76.8% Owner occupied348 23.2% Renter occupiedHouse owners and renters - Black or African American residents 2,119 36.0% Owner occupied3,763 64.0% Renter occupiedHouse owners and renters - American Indian / Alaska Native residents 35 100.0% Owner occupiedHouse owners and renters - Asian residents 805 79.9% Owner occupied202 20.1% Renter occupiedHouse owners and renters - Other race residents 183 32.7% Owner occupied377 67.3% Renter occupiedHouse owners and renters - Two or more races residents 290 41.9% Owner occupied401 58.1% Renter occupiedHouse owners and renters - White alone residents 961 77.2% Owner occupied283 22.8% Renter occupiedHouse owners and renters - Hispanic or Latino residents 359 35.0% Owner occupied668 65.0% Renter occupied
Language usage in Fairland
English speakers - Total 58.5% of residents of Fairland speak English at home.
10.8% of residents speak Spanish at home 1,578 60.9% Speak English very well1,012 39.1% Speak English less than very well30.7% of residents speak other language at home 4,861 65.9% Speak English very well2,512 34.1% Speak English less than very well
English speakers - Born in the United States 89.8% of residents of Fairland speak English at home.
5.4% of residents speak Spanish at home 382 95.5% Speak English very well18 4.5% Speak English less than very well5.0% of residents speak other language at home 326 87.6% Speak English very well46 12.4% Speak English less than very well
English speakers - Native, born elsewhere 59.2% of residents of Fairland speak English at home.
30.0% of residents speak Spanish at home 127 100.0% Speak English very well5.4% of residents speak other language at home 23 100.0% Speak English very well
English speakers - Foreign-born 23.1% of residents of Fairland speak English at home.
13.0% of residents speak Spanish at home 367 29.7% Speak English very well870 70.3% Speak English less than very well63.6% of residents speak other language at home 3,821 63.3% Speak English very well2,219 36.7% Speak English less than very well
White (Caucasian) - Speak only English Native:
89.1% (2,425)Foreign-born:
16.2% (95)
White (Caucasian) - Speak another language Native:
9.9% (268)Foreign-born:
82.6% (485)
Black or African American - Speak only English Native:
89.5% (8,021)Foreign-born:
28.3% (1,516)
Black or African American - Speak another language Native:
10.2% (916)Foreign-born:
70.1% (3,755)
Asian - Speak only English Native:
44.6% (385)Foreign-born:
12.7% (263)
Asian - Speak another language Native:
55.9% (482)Foreign-born:
87.3% (1,812)
Other race - Speak only English Native:
15.4% (152)Foreign-born:
2.0% (18)
Other race - Speak another language Native:
82.3% (810)Foreign-born:
98.4% (901)
Two or more races - Speak only English Native:
73.5% (927)Foreign-born:
26.5% (135)
Two or more races - Speak another language Native:
24.3% (307)Foreign-born:
74.7% (381)
White alone - Speak only English Native:
97.1% (2,327)Foreign-born:
27.3% (96)
White alone - Speak another language Native:
3.1% (75)Foreign-born:
72.3% (255)
Hispanic or Latino - Speak only English Native:
35.1% (666)Foreign-born:
2.3% (28)
Hispanic or Latino - Speak another language Native:
65.2% (1,237)Foreign-born:
97.9% (1,182)
Foreign-born residents in Fairland 9,563 residents are foreign born (16.9% Africa , 9.2% Asia , 8.3% Latin America ).
This city:
37.0%Maryland:
15.7%
Marital status for residents in Fairland Marital status - White (Caucasian) population 15 years and over
Males 29.7% Never married57.7% Now married3.0% Separated0.8% Widowed8.8% DivorcedFemales 29.4% Never married48.3% Now married0.5% Separated11.2% Widowed10.6% DivorcedWomen who gave birth in the past 12 months Now married:
0.0% (0)Unmarried:
100.0% (20)
Women who did not give birth in the past 12 months Now married:
37.1% (216)Unmarried:
62.9% (366)
Marital status - Black or African American population 15 years and over
Males 45.1% Never married43.0% Now married1.8% Separated0.9% Widowed9.1% DivorcedFemales 40.0% Never married35.5% Now married3.6% Separated7.3% Widowed13.6% DivorcedWomen who gave birth in the past 12 months Now married:
67.5% (192)Unmarried:
32.5% (93)
Women who did not give birth in the past 12 months Now married:
34.5% (1,183)Unmarried:
65.5% (2,243)
Marital status - Asian population 15 years and over
Males 26.0% Never married69.9% Now married0.0% Separated2.1% Widowed2.0% DivorcedFemales 31.3% Never married57.7% Now married0.0% Separated6.0% Widowed4.9% DivorcedWomen who gave birth in the past 12 months Now married:
100.0% (28)Unmarried:
0.0% (0)
Women who did not give birth in the past 12 months Now married:
47.1% (361)Unmarried:
52.9% (406)
Marital status - Other race population 15 years and over
Males 59.7% Never married39.1% Now married0.0% Separated1.3% Widowed0.0% DivorcedFemales 37.8% Never married26.4% Now married6.2% Separated0.9% Widowed28.6% DivorcedWomen who gave birth in the past 12 months Now married:
0.0% (0)Unmarried:
100.0% (44)
Women who did not give birth in the past 12 months Now married:
48.5% (281)Unmarried:
51.5% (298)
Marital status - Two or more races population 15 years and over
Males 54.3% Never married28.2% Now married0.0% Separated0.0% Widowed17.5% DivorcedFemales 52.1% Never married36.0% Now married0.0% Separated1.6% Widowed10.3% DivorcedWomen who gave birth in the past 12 months Now married:
100.0% (36)Unmarried:
0.0% (0)
Women who did not give birth in the past 12 months Now married:
11.0% (49)Unmarried:
89.0% (395)
Marital status - White alone, not Hispanic / Latino population 15 years and over
Males 25.2% Never married58.2% Now married4.2% Separated1.1% Widowed11.2% DivorcedFemales 31.2% Never married46.1% Now married0.6% Separated13.5% Widowed8.6% DivorcedWomen who gave birth in the past 12 months Now married:
0.0% (0)Unmarried:
100.0% (22)
Women who did not give birth in the past 12 months Now married:
37.7% (208)Unmarried:
62.3% (343)
Marital status - Hispanic or Latino population 15 years and over
Males 52.7% Never married42.0% Now married0.0% Separated0.5% Widowed4.7% DivorcedFemales 44.5% Never married36.3% Now married4.5% Separated0.5% Widowed14.1% DivorcedWomen who gave birth in the past 12 months Now married:
19.7% (15)Unmarried:
80.3% (61)
Women who did not give birth in the past 12 months Now married:
33.7% (276)Unmarried:
66.3% (543)
Ancestries in Fairland
1,639 8.3% African1,133 5.8% Ethiopian778 4.0% Ghanaian609 3.1% Jamaican290 1.5% German275 1.4% American272 1.4% West Indian227 1.2% Irish213 1.1% Haitian207 1.1% Sierra Leonean199 1.0% Nigerian150 0.8% Trinidadian and Tobagonian147 0.7% European140 0.7% Scottish108 0.5% Kenyan79 0.4% Italian72 0.4% Iranian69 0.4% English64 0.3% Romanian60 0.3% Liberian59 0.3% Greek59 0.3% Polish55 0.3% Afghan54 0.3% Ugandan34 0.2% Swedish32 0.2% Russian32 0.2% Zimbabwean29 0.1% Jordanian29 0.1% Finnish25 0.1% Czechoslovakian25 0.1% Iraqi23 0.1% Brazilian21 0.1% Arab20 0.1% Lithuanian19 0.10% Somali19 0.10% Syrian16 0.08% Albanian10 0.05% Scandinavian10 0.05% Austrian9 0.05% Scotch-Irish8 0.04% Eastern European4 0.02% Canadian3 0.02% Hungarian
Geographical mobility in Fairland Same house 1 year ago 3,066 91.5% White (Caucasian)13,648 88.1% Black or African American37 98.9% American Indian / Alaska Native2,573 83.9% Asian2,107 96.6% Other race1,766 95.5% Two or more races2,472 88.7% White alone, not Hispanic / Latino3,251 97.0% Hispanic or LatinoMoved within same county 104 3.1% White / Caucasian856 5.5% Black or African American296 9.6% Asian47 2.1% Other race13 0.7% Two or more races114 4.1% White alone, not Hispanic / Latino38 1.1% Hispanic or LatinoMoved within same state 87 2.6% White / Caucasian435 2.8% Black or African American52 1.7% Asian42 1.9% Other race58 3.1% Two or more races88 3.1% White alone, not Hispanic / Latino68 2.0% Hispanic or LatinoMoved from different state 91 2.7% White / Caucasian284 1.8% Black or African American64 2.1% Asian5 0.2% Other race34 1.8% Two or more races95 3.4% White alone, not Hispanic / Latino44 1.3% Hispanic or LatinoMoved from abroad 135 0.9% Black or African American
Children Nativity (place of birth) in Fairland
Children under 6 years - Living with two parents Both parents native 205 100.0% NativeBoth parents foreign-born 683 87.1% Native101 12.9% Foreign-bornOne native, one foreign-born parent 235 100.0% NativeChildren under 6 years - Living with one parent Native parent 667 100.0% NativeForeign-born parent 286 100.0% NativeChildren 6 to 17 years - Living with two parents Both parents native 616 97.0% Native19 3.0% Foreign-bornBoth parents foreign-born 1,059 77.7% Native304 22.3% Foreign-bornOne native, one foreign-born parent 233 100.0% NativeChildren 6 to 17 years - Living with one parent Native parent 1,259 100.0% NativeForeign-born parent 777 55.3% Native629 44.7% Foreign-born
Grandparents responsible for own grandchildren in Fairland
Grandparents (30 to 59 years) White / Caucasian 3 100.0% Not responsible for grandchildrenBlack or African American 22 22.9% Responsible for grandchildren73 77.1% Not responsible for grandchildrenAsian 16 100.0% Not responsible for grandchildrenOther race 40 100.0% Not responsible for grandchildrenWhite alone, not Hispanic / Latino 5 100.0% Not responsible for grandchildrenHispanic or Latino 35 100.0% Not responsible for grandchildrenGrandparents (60 years and over) White / Caucasian 40 100.0% Not responsible for grandchildrenBlack or African American 104 41.2% Responsible for grandchildren148 58.8% Not responsible for grandchildrenAsian 47 35.9% Responsible for grandchildren84 64.1% Not responsible for grandchildrenOther race 7 100.0% Not responsible for grandchildrenWhite alone, not Hispanic / Latino 50 100.0% Not responsible for grandchildrenHispanic or Latino 6 100.0% Not responsible for grandchildren